It’s 2020, and I’m reading a 10-year-old report by the Electronic Frontier Foundation about location privacy that is more relevant than ever. Seeing how prevalent the bulk collection of location data would become, the authors discussed the possible threats to our privacy as well as solutions that would limit this unrestricted collection while still allowing to reap the benefits of GPS enabled devices.
Some may have the opinion that companies and governments should stop collecting sensitive and personal information altogether. But that is unlikely to happen and a lot of data is already in the system, changing hands, getting processed, and analyzed over and over again. This can be quite unnerving but most of us do enjoy the benefits of this information sharing like receiving tips on short-cuts through the city during the morning rush hour. So how can we protect the individual’s rights and make responsible use of location data?
Until very recently, the main approach was to anonymize these data sets: hide rare features, add noise, aggregate exact locations into rough regions or publish only summary statistics (for a great technical but still accessible overview, I can recommend this survey). Cryptography also offers tools to keep most of the sensitive information on-device and only transmit codes that compress use-case relevant information. However, these techniques make a big trade-off between privacy, accuracy, and utility of the modified data. Even after this preprocessing, if the original data retains any of its utility then the risk of successfully re-identifying an individual is extremely high.
D.N.A. is probably the only thing that’s harder to anonymize than precise geolocation information.
Time and again, we see how subpar anonymization can lead to high-profile privacy leaks and this is not surprising, especially for mobility data: in a paper published in Scientific Reports, researchers showed that 95% of the population can be uniquely identified just from four time-location points in a data set with hourly records and spatial resolution given by the carrier’s antenna. In 2014, the publication of supposedly safe pseudonymized taxi trips allowed data scientists to find where celebrities like Bradley Cooper or Jessica Alba were heading by querying the data based on publicly available photos. Last year, a series of articles in the New York Times highlighted this issue again: from a data set with anonymized user IDs, the journalists captured the homes and movements of US government officials and easily re-identified and tracked even the president.
Mostly AI’s solution for privacy-preserving data publishing is to go synthetic. We develop AI-based methods for modeling complex data sets and then generate statistically representative artificial records. The synthetic data contains only made-up individuals and can be used for test and development, analysis, AI training, or any downstream tasks really. Below, I will explain this process and showcase our work on a real-world mobility data set.
The Difficulties With Mobility Data
What is a mobility data set in the first place? In its simplest form, we might be talking about single locations only where a record is a pair of latitude and longitude coordinates. In most situations though, we have trips or trajectories which are sequences of locations.
The trips are often tagged by a user ID and the records can include timestamps, device information, and various use-case specific attributes.
The aim of our new Mobility Engine is to capture and reproduce the intricate relationship between these attributes. But there are numerous issues that make mobility data hard to model.
- Sparsity: a fixed latitude/longitude pair from the data set appears once or a few times, especially at high granularity records.
- Noise: GPS recordings can include a fair amount of noise so even people traveling the exact same route can have quite different trajectories recorded.
- Different scales: the same data set could include pedestrians walking in a park and people taking cabs from the airport to the city so the change in data points can vary highly.
- Sampling rate: making modeling even more difficult, even short trips can contain hundreds of recordings and long trips might sample very infrequently.
- Size of the data set: the most useful data sets are often the largest. Any viable modeling solution should handle millions of trips with a reasonable turn-over.
Our solution can overcome all these difficulties without the need to compromise on accuracy, privacy or utility. Let me demonstrate.
Generating Synthetic Trajectories
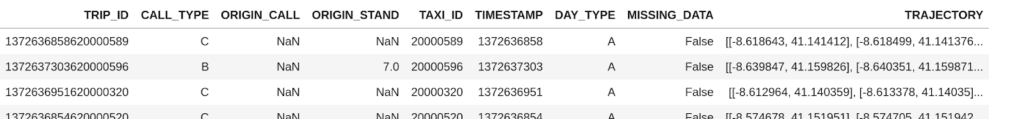
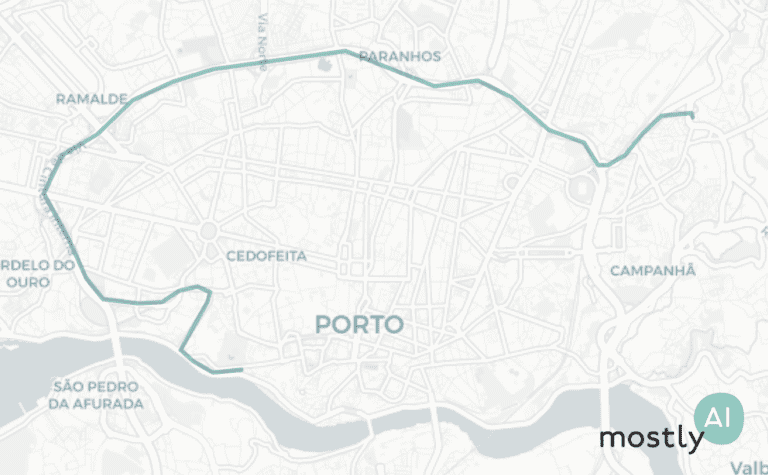
The Porto Taxi data set is a public collection of a year’s worth of trips by 442 cabs running in the city of Porto, Portugal. The records are trips, sequences of latitude/longitude coordinates recorded at 15-second intervals, with some additional metadata (such as driver ID or time of day) that we won’t consider now. There are short and long trips alike and some of the trajectories are missing a few locations so there could be rather big jumps in them.
Given this data, we had our Mobility Engine sift through the trajectories multiple times and learn the parameters of a statistical process that could have generated such a data set. Essentially, our engine is learning to answer questions like
- “What portion of the trips start at the airport?” or
- “If a trip started at point A in the city and turned left at intersection B, what is the chance that the next location is recorded at C?”
You can imagine that if you are able to answer a few million of these questions then you have a good idea about what the traffic patterns look like. At the same time, you would not learn much about a single real individual’s mobility behavior. Similarly, the chance that our engine is reproducing exact trips that occur in the real data set, which in turn could hurt one’s privacy, is astronomically small.
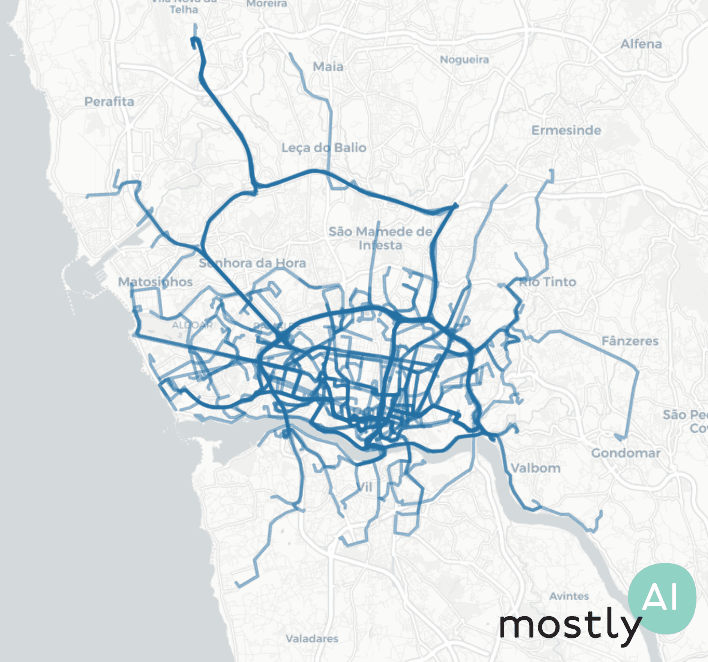
For the case of this post, we trained on 1.5 million real trajectories and then had the model generate synthetic trips. We produced 250’000 artificial trips for the following analysis, but with the same trained model, we could have as easily built 250 million trips.
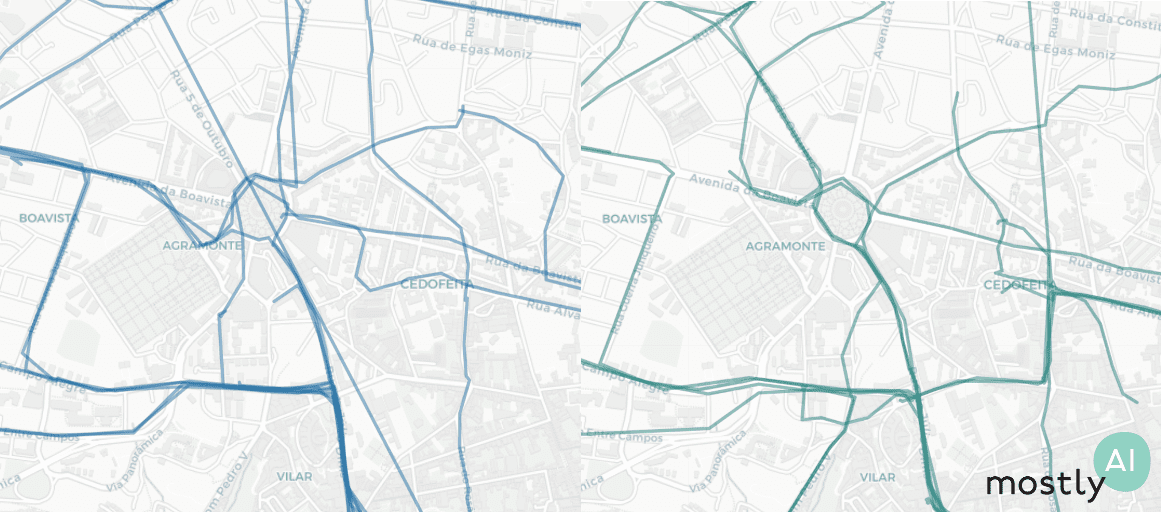
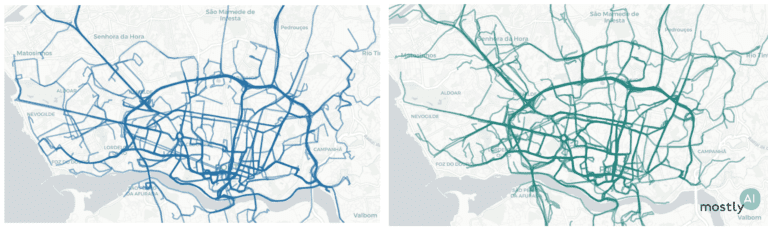
First, for a quick visual, we plotted 200 real trips recorded by real taxi drivers (on the left, in blue) and 200 of the artificial trajectories that our model generated (on the right, in green). As you can see, the overall picture is rather convincing with the high-level patterns nicely preserved.
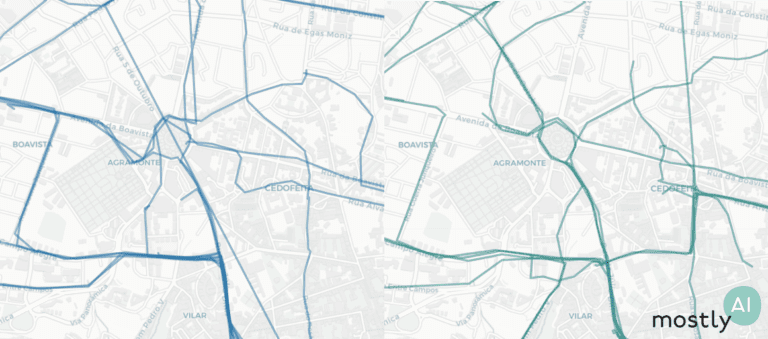
Looking more closely, we see very similar noise in the real and synthetic trips on the street level.
In general, we keep three main things in mind when evaluating synthetic data sets.
- Accuracy: How closely does the synthetic data follow the distribution of the real data set?
- Utility: Can we get competitive results using the synthetic data in downstream tasks?
- Privacy: Is it possible that we are disclosing some information about real individuals in our synthetic data?
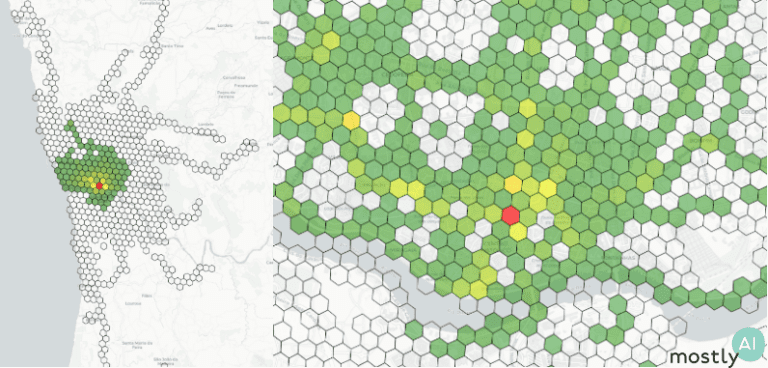
As for accuracy, we compare the real and synthetic data across several location-and trip-level metrics. First, we require the model to accurately reproduce the location densities, the ratio of recordings at a given spatial area, and hot-spots at different granularity. There are plenty of open-source spatial analysis libraries that can help you work with location data such as skmob, geopandas, or Uber’s H3 which we used to generate the hexagonal plots below. The green-yellow-red transition marks how the city center is visited more frequently than the outskirts with a clear hot-spot in the red region.
From the sequences of latitude and longitude coordinates, we derive various features such as trip duration and distance traveled, origin-destination distance, and a number of jump length statistics.
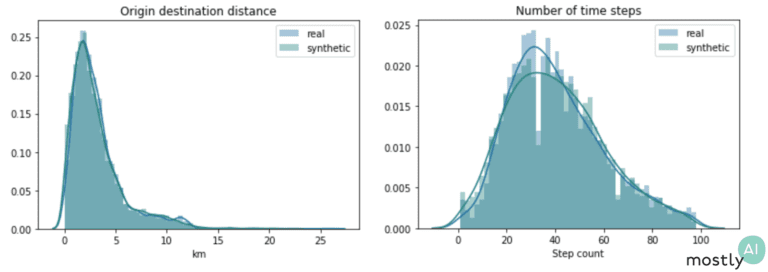
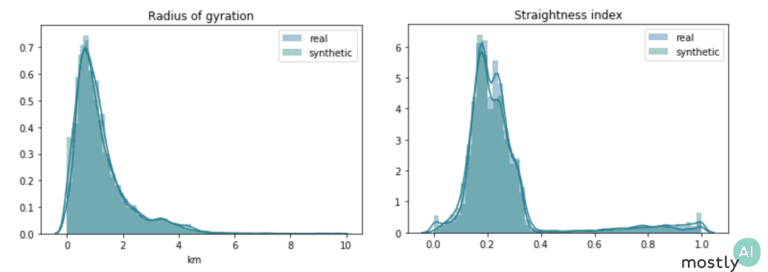
The plots above show two of these distributions both for the real and synthetic trips. The fact that these distributions overlap almost perfectly shows that our engine is spot-on at reproducing the hidden relationships in the data. To capture a different aspect of behavior, we also consider geometric properties of paths: the radius of gyration measures how far on average the trip is from its center of mass and the straightness index is the ratio of the origin-destination distance with the full traveled distance. So, for a straight line, the index is exactly 1 and for more curvy trips it takes lower values with a round trip corresponding to straightness index 0. We again see that the synthetic data follows the exact same trends as the real one, even mimicking the slight increase in the straightness distribution from 0.4 to 1. I should stress that we get this impressive performance without ever optimizing the model for these particular metrics and so we would expect similarly high accuracy for other so far untested features.
Regarding utility, one way we can test-drive our synthetic mobility data is to use it in practical machine learning scenarios. Here, we trained three models to predict the duration of a trip based on the origin and destination: a Support Vector Machine, a K-nearest neighbor regressor, and an LGBM regressor,
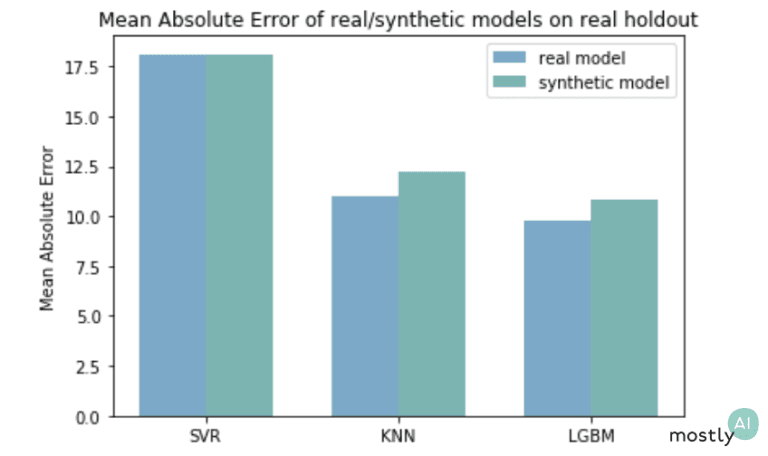
We trained the synthetic models only on synthetic data and the real models on the original trajectories. The scores in the plot came from testing all the models against a holdout from the original, real-life data set. As expected, the synthetically trained models performed slightly worse than the ones that have seen real data but still achieved a highly competitive performance.
Moreover, imagine you are an industry-leading company and shared the safe synthetic mobility data in a competition or hackathon to solve this prediction task. If the teams came up with the above-shown solutions and got the green error rates on the public, synthetic data then you can rightly infer that the winner solution would also do best on your real but sensitive data set that the teams have never seen.
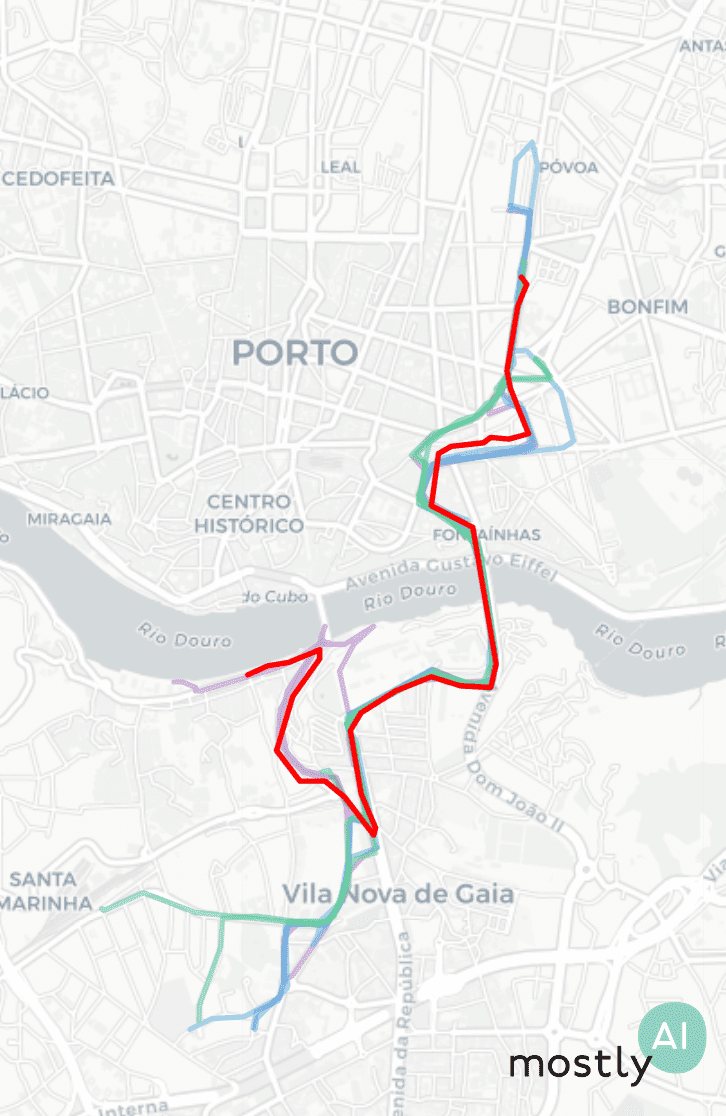
The privacy evaluation of the generated data is always a critical and complicated issue. Already at the training phase, we have controls in place to stop the learning process and thus prevent overfitting. This ensures that the model is learning the general patterns in the data rather than memorizing exact trips or overly specific attributes of the training set. Second, we also compare how far our synthetic trips fall from the closest real trips in the training data. In the plot below, we have a single synthetic trip in red, with the purple trips being the three closest real trajectories, then the blue and green paths sampled from the 10-20th and 50-100th closest real trips.
To quantify privacy, we actually look at the distribution of closest distances between real and synthetic trips. In order to have a baseline distribution, we repeat this calculation using a holdout of the original but so far unused trips instead of the synthetic ones. If these real-vs-synthetic and real-vs-holdout distributions differ heavily, in particular, if the synthetic data falls closer to the real samples than what we would expect based on the holdout, that could indicate an issue with the modeling. For example, if we simply add noise to real trajectories then the latter distributions will clearly flag this data set for a privacy leak. However, the data generated by our Mobility Engine passed these tests with flying colors.
Conclusions
We should be loud about not compromising on privacy, no matter the benefits offered by sharing our personal information. Governments, operators, service providers, and others alike need to take privacy seriously and invest in technology that protects the individual’s rights during the whole life cycle of the data. We at Mostly AI believe that synthetic data is THE way forward for privacy-preserving data sharing. Our new Mobility Engine allows organizations to fully utilize sensitive locational data by producing safe synthetic data at a so-far unseen level of accuracy.
Acknowledgment
This research and development on synthetic mobility data is supported by a grant of the Vienna Business Agency (Wirtschaftsagentur Wien), a fund of the City of Vienna.