
This article explains what data drift is, how it affects machine learning models in production, what the difference between data drift and concept drift is, and what you can do to tackle data drift using synthetic data.
What is data drift?
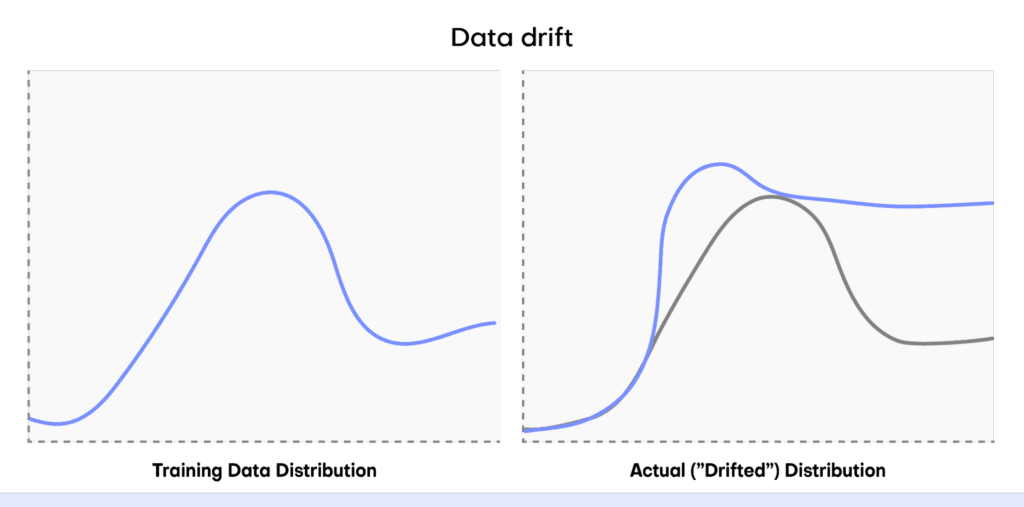
“Data drift” is a term in machine learning that refers to the phenomenon in which a machine learning model’s performance slowly decreases over time. This happens because machine learning models are trained on historical data (i.e. “the past”) but then use current data (i.e. “the present”) when they are being used in production. In reality, the historical data and the current data may have different statistical characteristics and this is what we call “data drift”: the data used for predictions starts to drift from the data used for training. This means the machine learning model is no longer fully optimized for the data it is seeing.
How does data drift affect ML models?
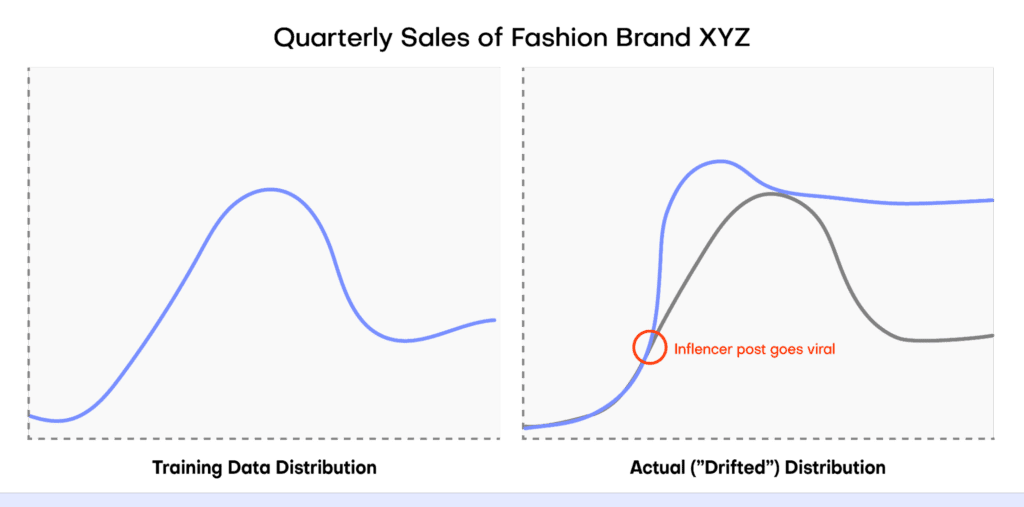
Drift can be a big problem when using machine learning models in the real world, causing a decrease in predictive power. For example, let’s say we have trained a machine learning model to accurately predict the quarterly sales of a particular fashion brand. We then put this model into production.
At first it operates well: the actual data it is receiving (from the present) resembles the data that was used to train the model (from the past). But then something unexpected happens. A popular influencer spontaneously posts about the fashion brand and the post goes viral. Sales sky-rocket in a way that the machine learning model could never have foreseen because nothing like the unexpected viral post event was present in the training data.
This causes a significant change in the statistical distribution of the input data (i.e. “data drift”) and the machine learning model no longer performs at optimum performance. The model loses accuracy and may even produce unreliable predictions if the data distributions vary significantly.
Data drift vs concept drift
There are different kinds of drift that can be observed in machine learning projects. Data drift refers specifically to the phenomenon in which the distribution of the real-world data used when the model is in production drifts from the data that was used for training.
Concept drift refers to the situation in which the relationship between features in the data changes over time. In this case, the pattern (or “concept”) that the machine learning model is trying to learn is evolving. In short, data drift deals with changes in the data that the model uses to make predictions, whereas concept drift refers to changes in the patterns between features in the data.
How can I deal with data drift?
Data drift is a complex phenomenon that generally requires a multidimensional approach to solve. Some of the most effective things you can do to deal with data drift include:
- Retrain your machine learning model on fresh data that includes the drifted distribution so that the model is performing at peak performance again.
- Perform robust feature engineering so that features are less sensitive to changes in the underlying data.
- Use ensemble methods like model blending and stacking or building a fully-online machine learning pipeline that can continuously update and retrain itself as new data comes in.
In practice, retraining a machine learning model with fresh data is one of the most common methods used to deal with data drift. However, this approach comes with some drawbacks. Acquiring new data that is ready for training a machine learning model is often:
- Expensive and time-consuming;
- Disruptive to ongoing workflows and processes;
- Difficult to execute because of privacy regulations.
Tackle data drift with synthetic data
Synthetic data generation can help you tackle data drift by providing a high-quality, low-friction source of data on which you can retrain your machine learning models. Synthetic data generators enable you to produce virtually limitless data and often give you fine-grained control over the distributions of this new data. By accurately modeling new synthetic datasets, you can then update your machine learning model to incorporate the drifted data distribution.
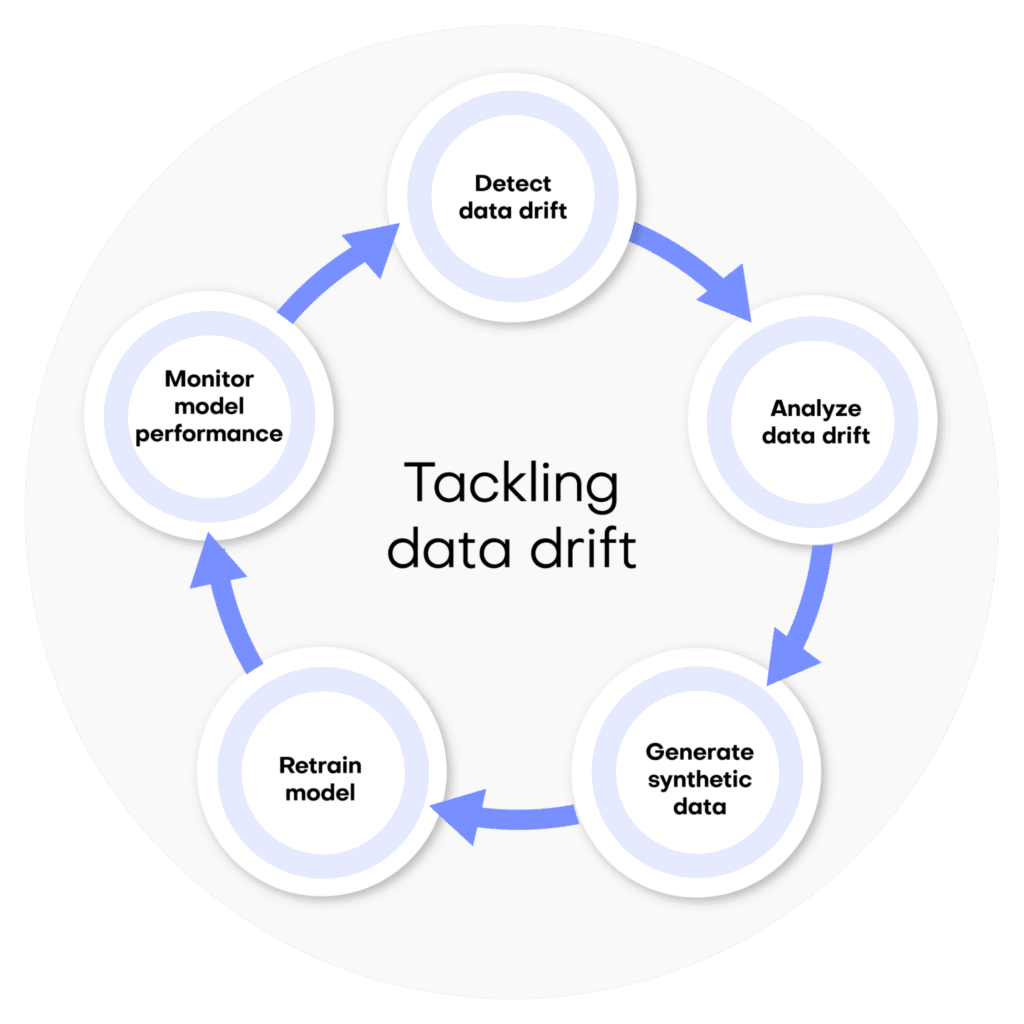
We’ve broken it down into 5 steps for clarity:
- Detect your data drift
- Understand your data drift
- Generate synthetic data
- Retrain your model
- Monitor and repeat
1. Detect your data drift
Detecting data drift should be a fundamental part of any machine learning life cycle. There are many ways to perform data drift detection and many resources to learn about it. This article focuses on solutions that will help you fix data drift once it has been detected.
2. Understand your data drift
Before tackling data drift, it’s important that you have a good understanding of its nature and potential causes. Analyze your model and the incoming data to identify points where the data is drifting and analyze its statistical characteristics. This will help you understand how to incorporate the data drift into your updated model.
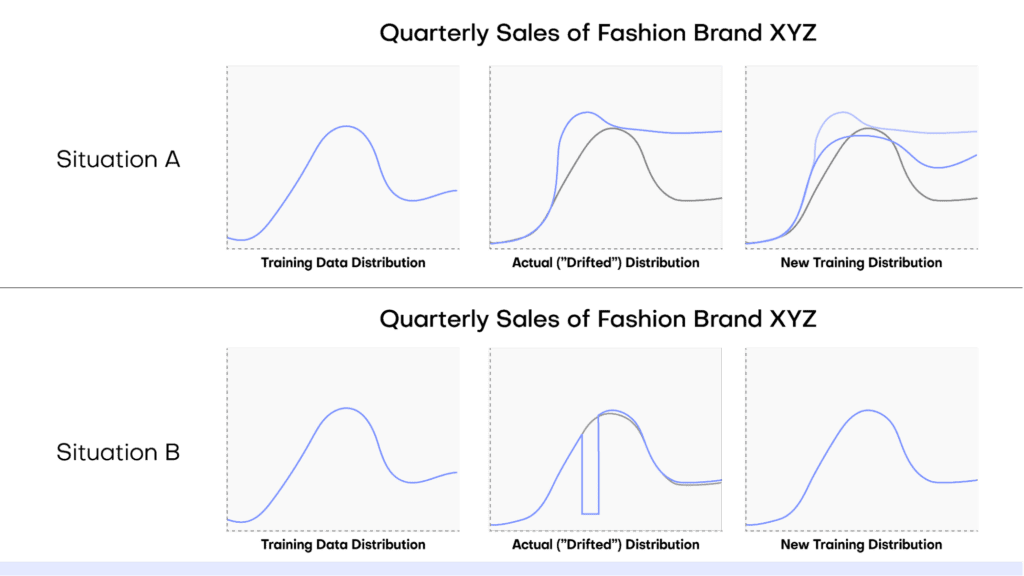
For example, in the case of the quarterly fashion sales predictions mentioned above, the fact that we can reliably trace the data drift to the viral influencer post helps us know how to deal with the data drift. It’s reasonable to expect the influencer post to have lasting effects on the fashion brand’s perception and future sales: we should therefore adjust our data projections to include some of the ripple effects of this unexpected sales boost.
On the contrary, if we had instead seen a massive but temporary drop in sales due to a failure in the webshop’s main server, we may want to choose not to incorporate this data at all in the projections for next quarter, the assumption here being that the webshop will not experience another failure.
3. Generate synthetic data
Once you have a good understanding of the statistical nature and potential sources of your data drift, you can then proceed to use synthetic data generation to supplement your training dataset with cases that might occur due to data drift.
We’ll walk through how to generate the right kind of synthetic data to tackle your data drift with MOSTLY AI's synthetic data platform, using a technique called conditional generation.
- Split your dataset into two separate tables: one table containing the ID column and the columns containing your desired target features, and a second table containing the ID column along with all of the other predictor columns.
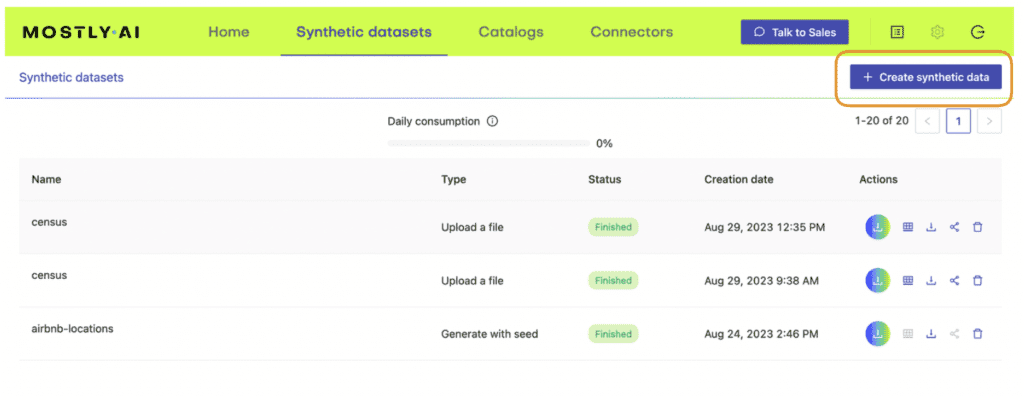
- Log in to your MOSTLY AI account.
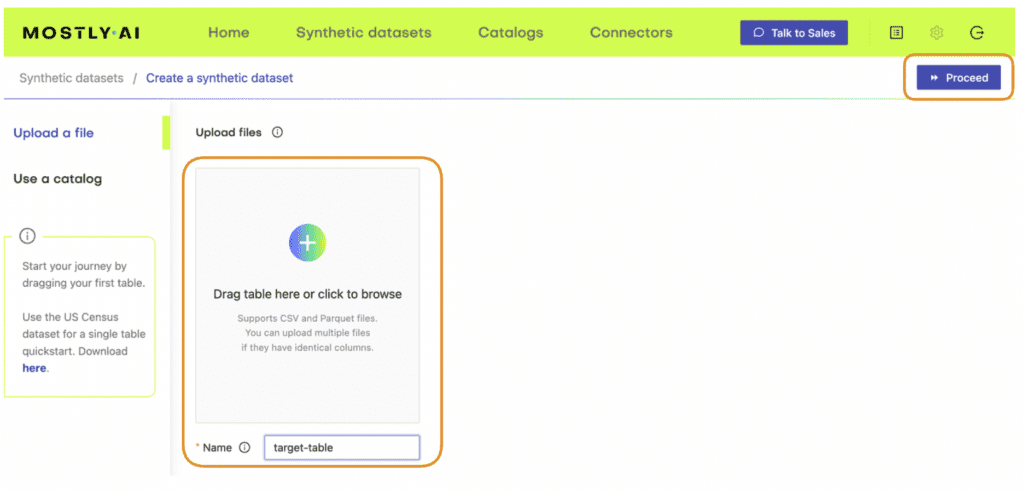
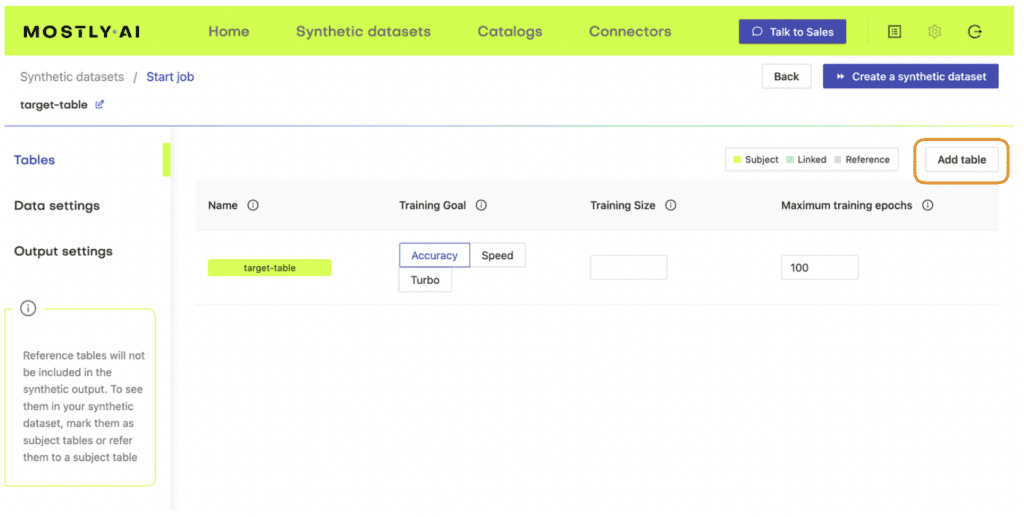
- Launch a new job using the “Create Synthetic Data” button in the “Synthetic Datasets” tab. Upload the first table (containing the ID column and the target feature(s) to start a new job and then add the second table.
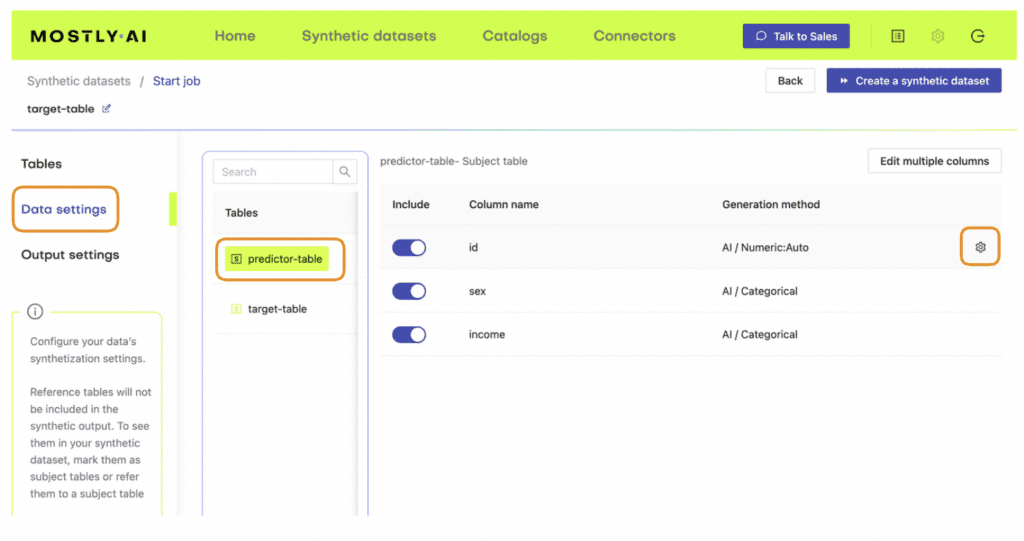
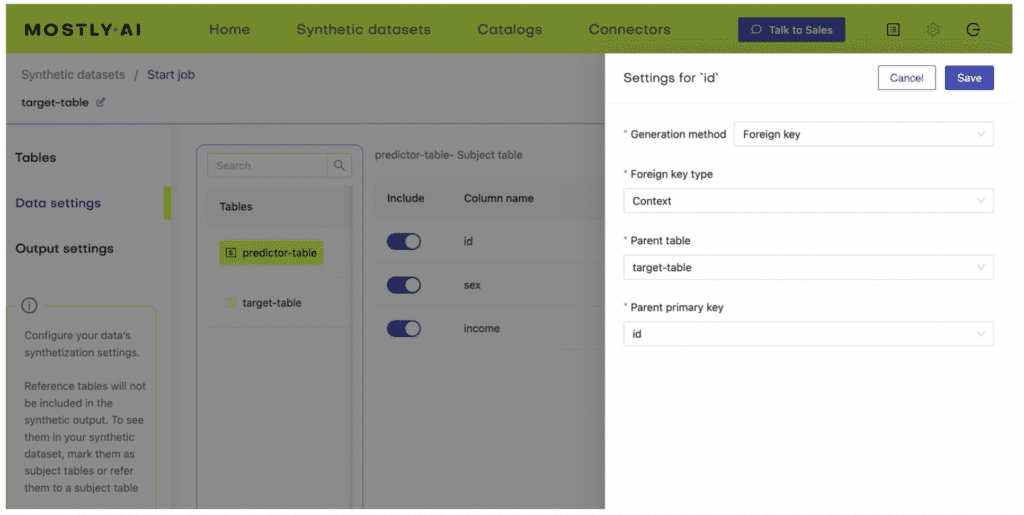
4. Define the relationship between the two tables using the Data Settings tab and navigating to the settings for the table containing the predictor columns. Click on the gear icon to the right of the ID column and set the following settings:
Generation Method: Foreign Key
Foreign Key: Type: Context
Parent Table: <your-table-with-target-column>
Parent Primary column: <id-column-of-target-table>
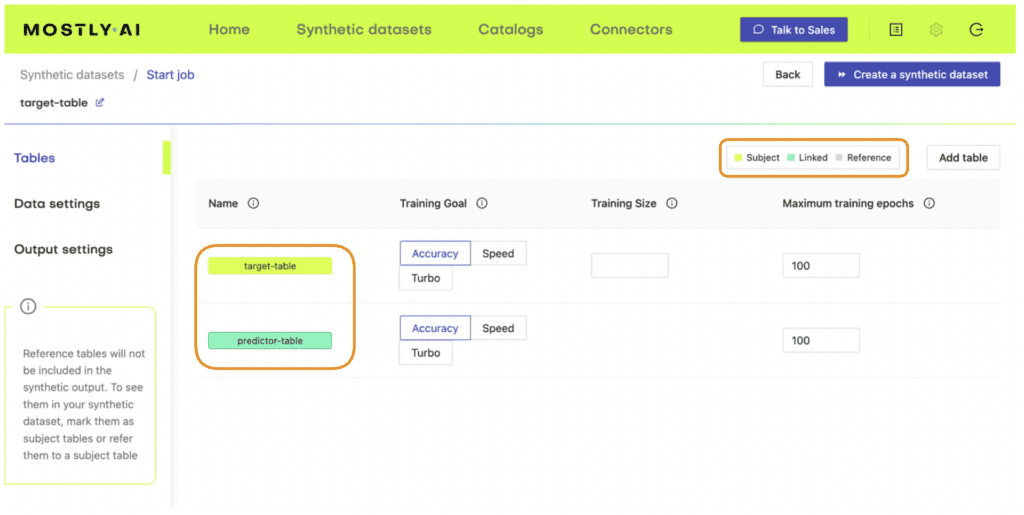
Save the settings. Under the “Tables” tab you should now see that the predictor table has changed into a Linked Table (lime green color coding).
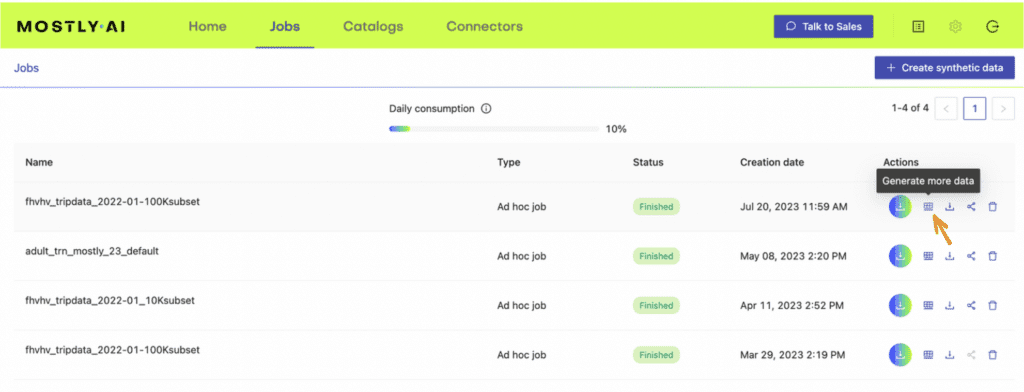
5. Once the job has been completed, select the “Generate more data” action on the right-hand side of the newly-generated dataset row and select “Generate with seed” to perform conditional generation.
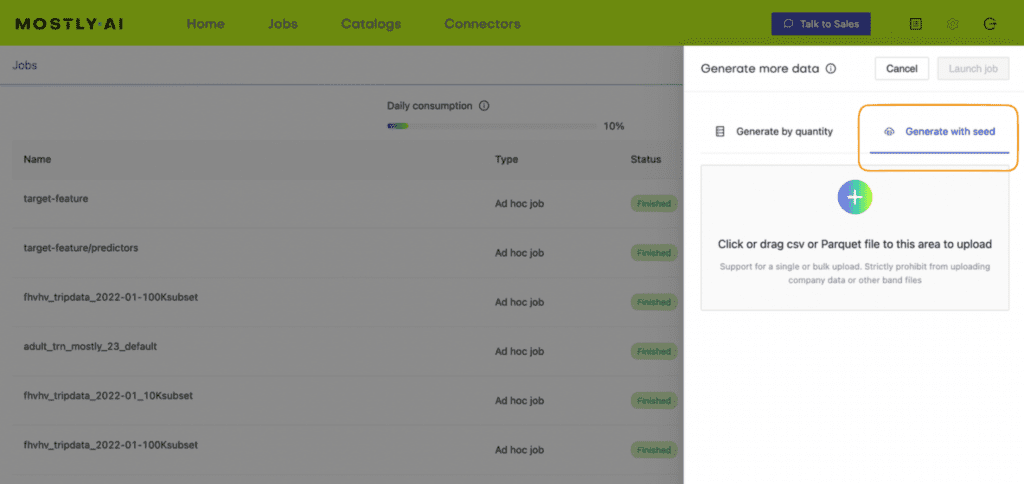
6. Now upload a subject table with a different kind of distribution.
This subject table can be generated manually or programmatically and should contain the drifted distribution. The simulated subject table (containing the drifted target feature distribution) will be used to generate a synthetic dataset (i.e. the predictor columns) that would produce the new, drifted distribution.
In our viral fashion post example, we would create a simulation of the target feature (sales) that follows the “new training distribution” depicted in Figure 4 above and use this to generate a synthetic dataset.
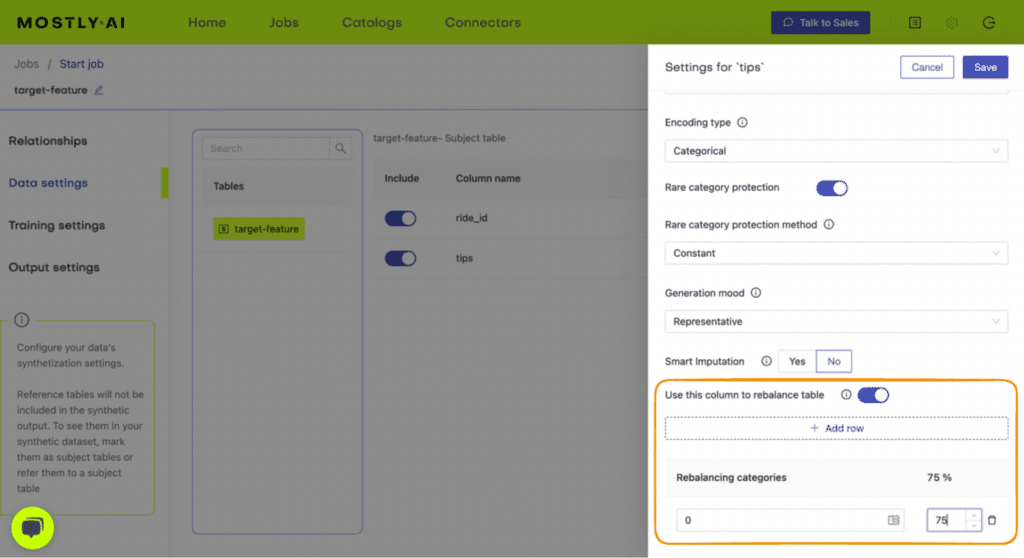
Open-source Python packages like NumPy or SciPy enable you to perform fine-grained data simulation. You can use MOSTLY AI’s rebalancing feature to programmatically simulate drifted target feature distributions for categorical columns.
7. Repeat for all the different scenarios you want to model.
To properly accommodate all of the possible future scenarios, you may want to create multiple simulated datasets, each with a different assumption and associated distribution. In the case of our viral fashion post, we may want to create three simulations: one in which sales continue to skyrocket at the same rate as we saw this quarter, one in which sales just go back to ‘normal’ (i.e. the influencer post has no lasting effect), and a third scenario that takes the average of these two extremes. With these 3 synthetic datasets we can then train different models to predict 3 kinds of possible future scenarios.
4. Re-train your model
With your freshly generated synthetic data ready, you can now proceed to re-train your machine learning model. You can use just the synthetic data or a mix of real and synthetic data, depending on the privacy requirements of your model.
5. Monitor model performance and repeat
Finally, make sure to put precise monitoring tools in place to continue to detect data drift. For example, you could use open-source Python libraries like Evidently or NannyML to keep track of your model performance throughout the machine learning lifecycle. When your model metrics indicate a recurrence of data drift, update your synthetic data to reflect the new distributions and re-train your model.
Tackling data drift with MOSTLY AI
Synthetic data generation can help you tackle data drift by making it easy to simulate potential future scenarios based on new statistical distributions of the data. By providing a high-quality, low-friction source of data on which you can retrain your machine learning models, synthetic data generators enable you to produce virtually limitless data to model changes in the underlying data. MOSTLY AI gives you fine-grained control over the distributions of this new data so you can accurately model new synthetic datasets that take into consideration the drifted data distributions.
Try it out today – the first 100K rows of synthetic data are on us!