
AI-generated data synthesis is on the rise and the number of software solutions available on the market is growing. Users of synthetic data have to make important decisions about which solution to use. But evaluating the quality of AI-generated synthetic datasets is challenging. How should you go about comparing different solutions?
MOSTLY AI co-developed a research-based empirical framework for evaluating the quality of mixed-type tabular synthetic data. This framework provides empirical methods to quantify both the accuracy (utility) and privacy of a synthetic dataset. This article explains how the methodology works and presents the benchmarking results of 8 synthetic data generators on 4 different datasets.
The evaluation framework allows you to confidently make the switch to generative AI synthetic data by comparing the performance of different solutions so that you can choose the best platform for your use case. You can reproduce the results or compare other solutions for yourself using the code in this public Github repository.
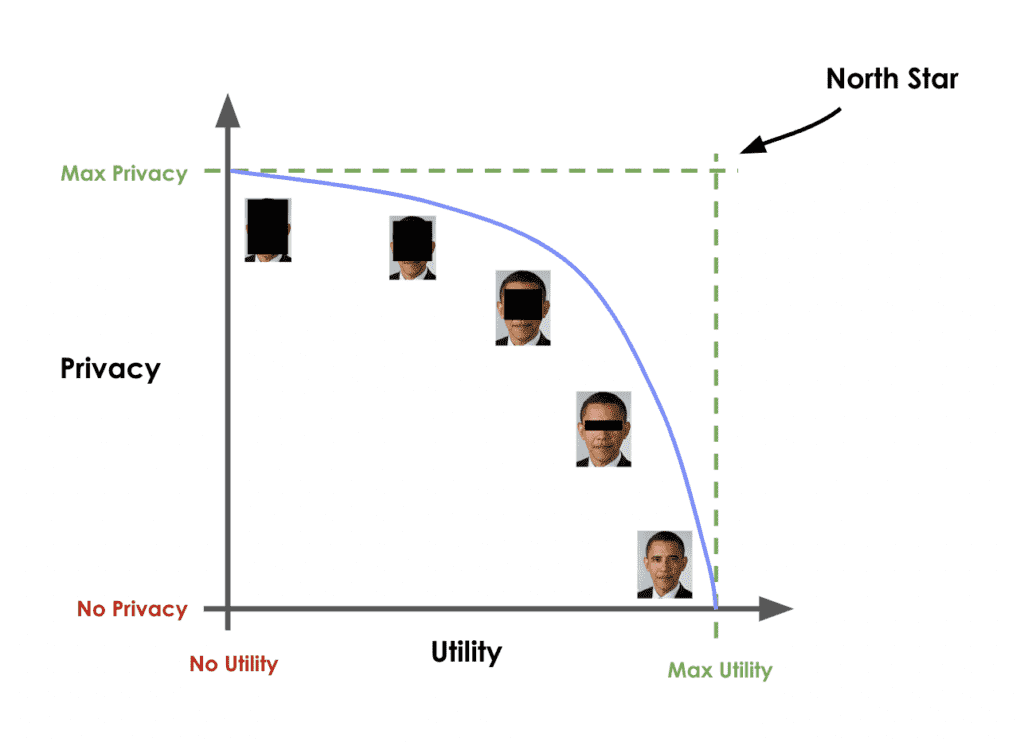
The black dot in the top-right corner is the ‘North Star’ of maximum privacy and utility preservation.
Privacy vs. Utility
Traditional data anonymization techniques struggle with the privacy-utility tradeoff for today’s datasets, which consist of more than just a handful of attributes per individual. Let’s illustrate this fundamental tradeoff with an example: you could easily add enough noise to a dataset to guarantee its privacy. However, except for the most trivial cases, the resulting data will then no longer be realistic nor representative of the original dataset. An analysis performed or a model trained on this kind of perturbed data will yield totally inaccurate results. You’ve lost your data utility.
On the other hand, you could decide to only add a marginal amount of noise. This would preserve the data utility, but would not protect against even the most basic forms of re-identification attacks. Thus, while you maintain utility, you offer no meaningful privacy protection.
Of course the ideal goal would be to achieve both: maximum data utility and maximum privacy - the "North Star" to the top right as shown in the chart below.
AI-generated synthetic data promises to be better than these conventional data anonymization techniques. But how can you quantify their ability to deliver on this promise?
How to benchmark synthetic data generators
Building a robust evaluation methodology for synthetic data generators is no easy task. This technical section will walk you through a specific evaluation framework, co-developed by MOSTLY AI. This section guides you step by step so that you gain an understanding of how the framework is built and can confidently use it to evaluate different synthetic data solutions for yourself. If you are not interested in the technical details, you can skip straight to the results.
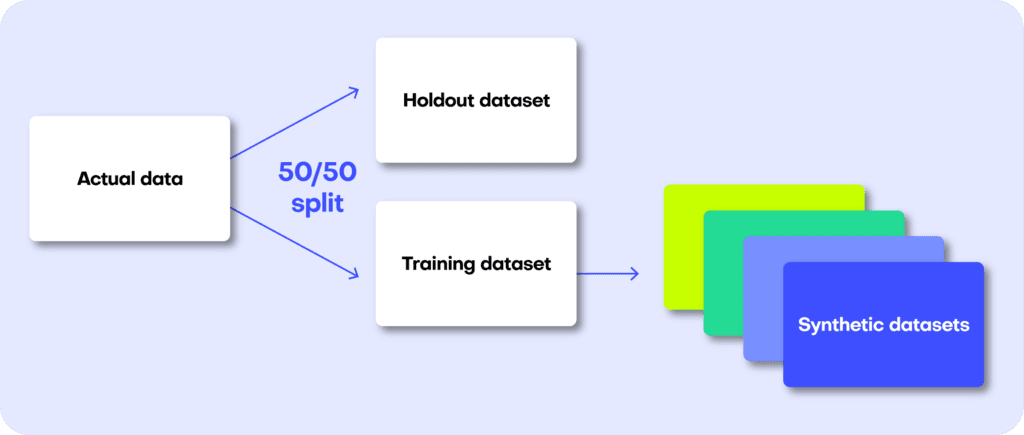
A perfect data synthesizer should be capable of generating data samples that closely resemble actual data points that the model has never seen before. The synthetic dataset should have the same statistical characteristics as the original dataset; without revealing any private information. To assess this property, we therefore split the original data into a training and a holdout set. The generated synthetic data samples should then be just as close to the training dataset as the points in the holdout set, which are real data records that the model has never seen before.
So how does it work?
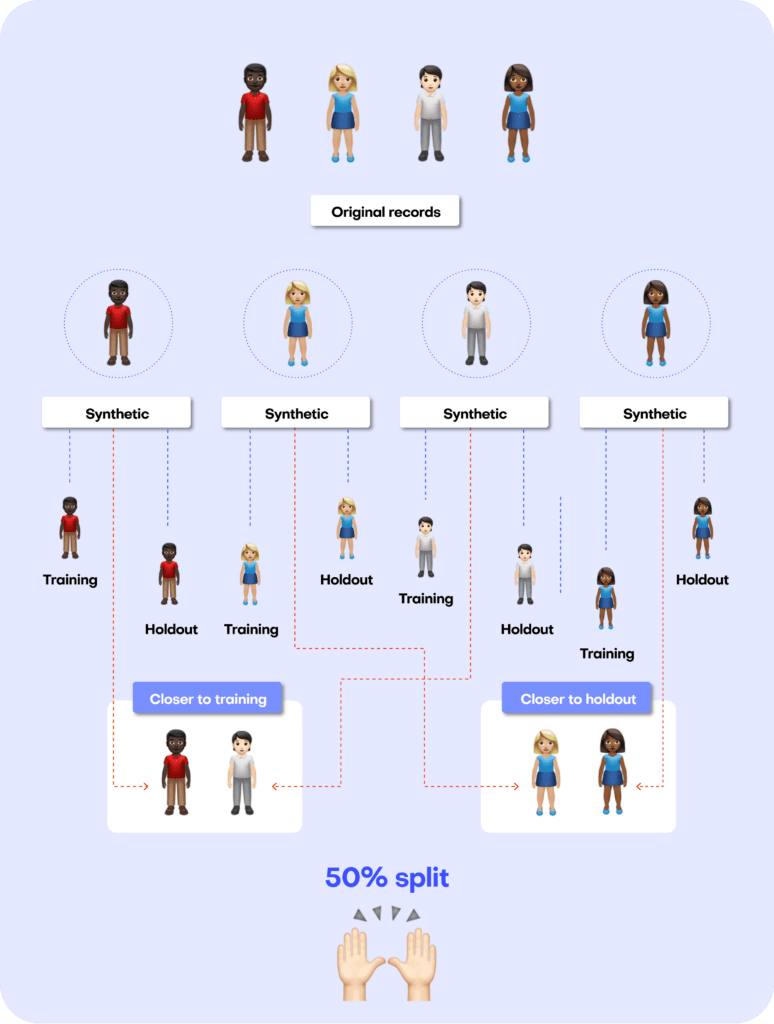
The first step is taking the original dataset and splitting it in half to yield the training and the holdout datasets. The synthesizer is only trained on the training samples (50% of the original dataset) and is then used to generate synthetic data samples. The holdout samples are never exposed to the synthesis process but kept aside for the evaluation.
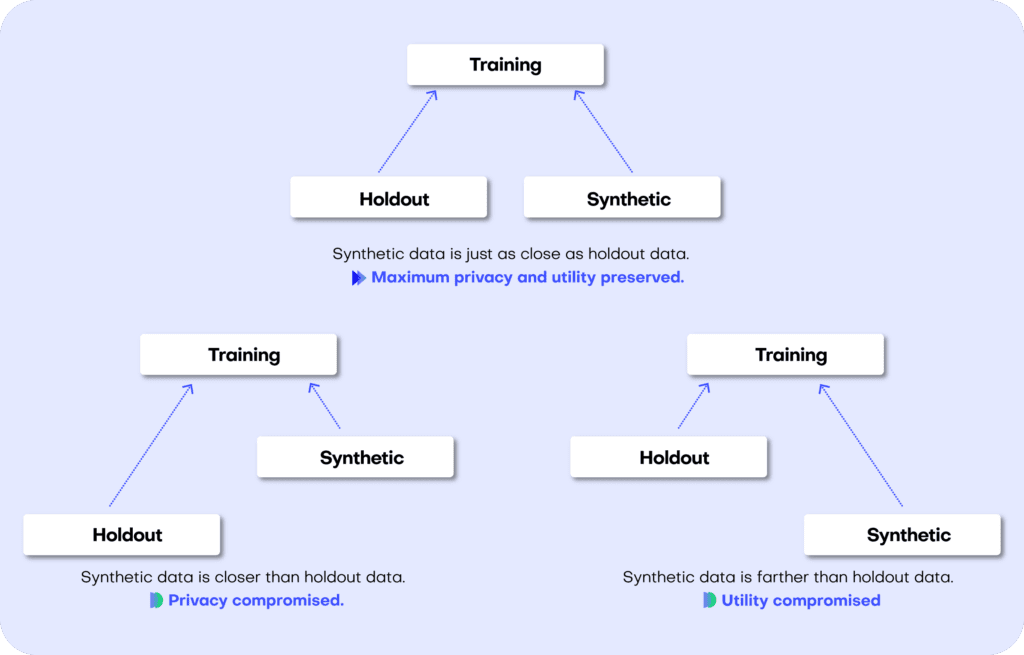
We can then evaluate the quality of this generated synthetic data by evaluating whether the synthetic samples created by the trained generator are any “closer” to the training data than the holdout data.
If the synthetic data is significantly closer to the training data than to the holdout, the generative model has likely been overfitted. This would indicate that the synthetic data potentially contains information that is specific to the individuals of the training data and that does not generalize beyond those individuals. On the other hand, if the synthetic data is significantly farther away from the training data than the holdout set, we are apparently not representative of the actual data. In that scenario, we would be compromising the fidelity of the data, which negatively impacts the utility of our downstream models trained on this data.
So how do we quantify this fidelity “closeness”?
Remember that the benchmark model starts out by randomly splitting the original dataset into 2 equal halves: a training set and a holdout set. Since these are all samples from the same dataset, these two sets will exhibit the same statistics and the same distributions. Naturally, however, there will be some difference between the training and holdout sets, simply because they consist of different samples. This difference in statistics is thus due to the so-called sampling variance.
After training our synthetic data generator on the training dataset, we will then use it to generate some new, synthetic data samples. Ideally, these synthetic data should be just as far from the training data as the holdout data in terms of accuracy. In other words, there should be just as much difference between the statistics of the synthetic samples and the statistics of the training samples as between the corresponding statistics of the training samples and the statistics of the holdout samples (the difference being the magnitude of the sampling variance).
If the synthetic data is significantly closer to the training data than the holdout data, this means that some information specific to the training data has leaked into the synthetic dataset. If the synthetic data is significantly farther from the training data than the holdout data, this means that we have lost information in terms of accuracy or fidelity.
The specific distance metric we use to evaluate the fidelity of the synthetic dataset is the Total Variational Distance (TVD) between the empirical marginal distributions. It is calculated by treating all the variables in the dataset as categoricals (and thus binning any numerical features) and then measuring the sum of all deviations between the empirical marginal distributions.
This can be done for univariate, bivariate, and to some extent, also for all higher-dimensional marginal distributions. For more details on the exact implementation, read the original paper published in Frontiers in Big Data or take a look at the reproducible code in the dedicated Github repository. An Accuracy metric can then be easily defined as 1 - TVD to yield a percentage value: a synthetic dataset with a TVD of 0.05 from the holdout dataset thus translates to an accuracy of 95%, which is also reported as part of MOSTLY AI’s Quality Assurance report.
Synthetic data should match the original real-world datasets as closely as possible. This is true not only for the distribution of individual attributes or features but also for their multivariate combinations and the relationships among the set of attributes. This becomes complex very fast due to the curse of dimensionality: a dataset of 50 attributes (or columns in a traditional tabular dataset) will have 1,225 bivariate interactions and 19,600 three-way interactions (!) How do we quantify the closeness of the synthetic dataset across so many dimensions?
The solution proposed in the framework co-developed by MOSTLY AI is a non-parametric, model- and assumption-free approach to empirically measure the fidelity as the Total Variational Distance of the empirical marginal distributions.
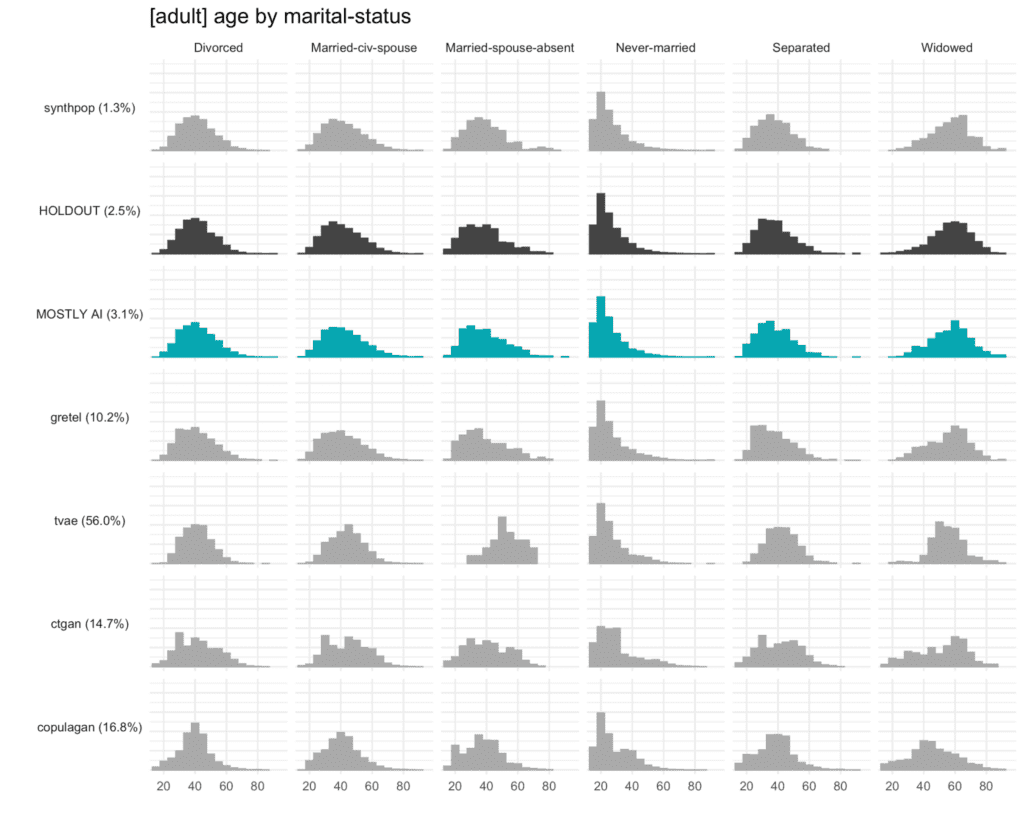
This may sound complex but becomes intuitive when translated into a visualization such as the one below. It’s relatively easy to identify which distributions resemble that of the HOLDOUT set and which don’t. The copulagan distribution for age by “widowed”, for example, is clearly deviating significantly from the distribution in the HOLDOUT set.
For each multivariate combination, the framework evaluates the similarity between the distributions as the Total Variational Distance and measures an average of all these similarities to report a single summary metric.
Privacy
Just as for accuracy, we start by splitting the dataset into equal training and holdout sets, train the generator on the training set and then use the generator to create a synthetic dataset.
For each individual in the synthetic dataset, we then find its nearest neighbor in the training dataset. The nearest neighbor is the individual in the training set which most closely resembles it. We measure the distance between these two neighbors using the Distance to Closest Record method and compare the distance to its nearest neighbor in the holdout dataset. We repeat this for every synthetic sample to calculate the share of records that are closer to a training than to a holdout record.
A resulting share of 50% would mean that the synthetic dataset is just as different from the original training data as from the holdout set. This would give a strong signal that no private information from the training dataset has made it into the synthetic dataset.
Benchmark results
To see the benchmarking framework in action, we used it to evaluate 8 publicly accessible synthetic data generators on 4 unique datasets.
The following generators are included in the benchmark:
- 4 generators contained as part of MIT’s Synthetic Data Vault (SDV) library, specifically the CopulaGAN, CTGAN, Gaussian Copula, and TVAE synthesizers;
- the synthcity RTVAE generator;
- the synthpop R package;
- an open-sourced generator by Gretel;
- MOSTLY AI’s proprietary generator.
Both Gretel and MOSTLY AI were accessed through their web-based browser applications. The other generators were accessed using their respective Python and R APIs. All generators were used with their default settings, so no parameter-tuning was performed. The code to reproduce the benchmarks is available on Github.
The datasets included in the benchmarks are:
- adult: 48,842 records with 15 attributes (6 numerical, 9 categorical)
- bank-marketing: 45,211 records with 17 attributes (7 numerical, 10 categorical)
- credit-default: 30,000 records with 24 attributes (20 numerical, 4 categorical)
- online-shoppers: 12,330 records with 18 attributes (4 numerical, 14 categorical)
Fidelity performance on a single dataset
The plot below shows the Total Variational Distance of each synthetic dataset trained on the adult dataset, measured once for all univariate distributions, once for all bivariate distributions, and once for all 3-way interactions. The higher the TVD value, the further away the synthetic data points are from the training data, indicating a loss in terms of accuracy.
Only MOSTLY AI and synthpop achieve proximity to the original data, measured as their distance from the holdout dataset. All other synthesizers seem significantly less performant in terms of accuracy, resulting in insights or ML models that are not necessarily representative of the real world. If one looks close, then one can see that synthpop actually seems to do its job too well – its synthetic samples are closer to the training data than the holdout which may be a sign of an overfitted model.
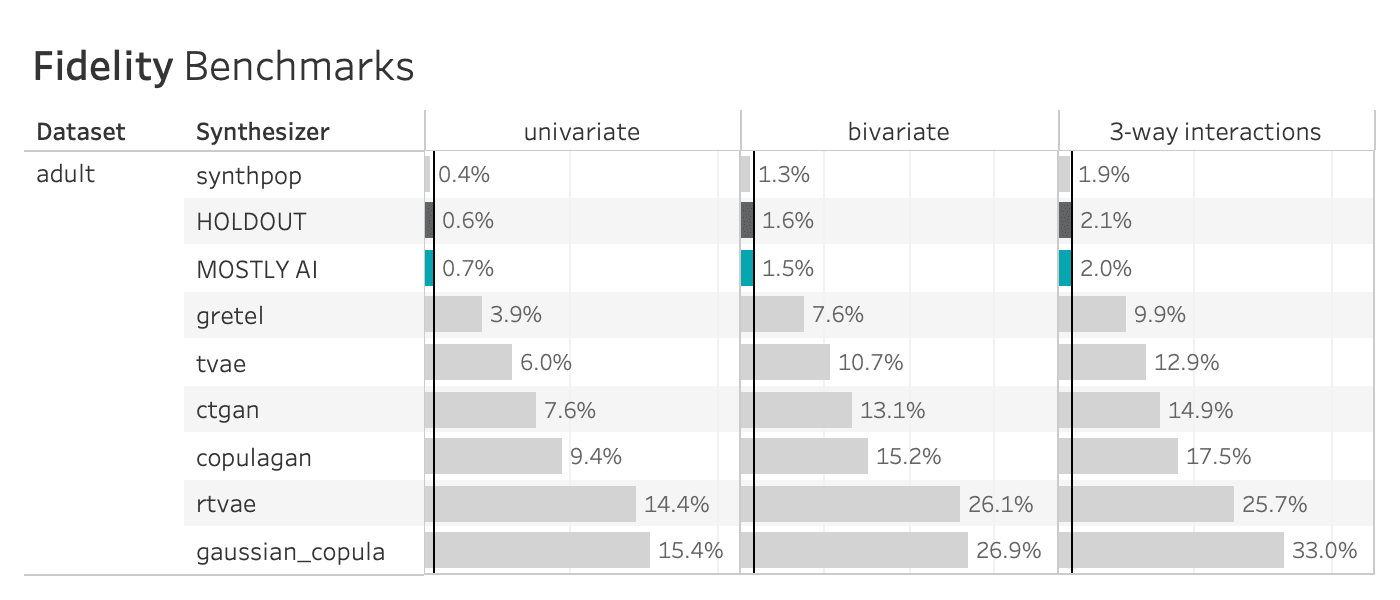
Many of the synthetic data generators create data that is significantly different from the holdout adult dataset, indicating a loss of data utility. Only MOSTLY AI and synthpop closely resemble the holdout dataset.
Fidelity Performance on all Four Datasets
The table below shows the performance of the 8 data synthesizers on all 4 benchmarked datasets, measured as the TVD. The HOLDOUT row shows the deviation measured for the holdout dataset, and serves us as a reference to quantify deviations expected due to the sampling variance. The synthetic datasets should match the Holdout fidelity score as closely as possible.
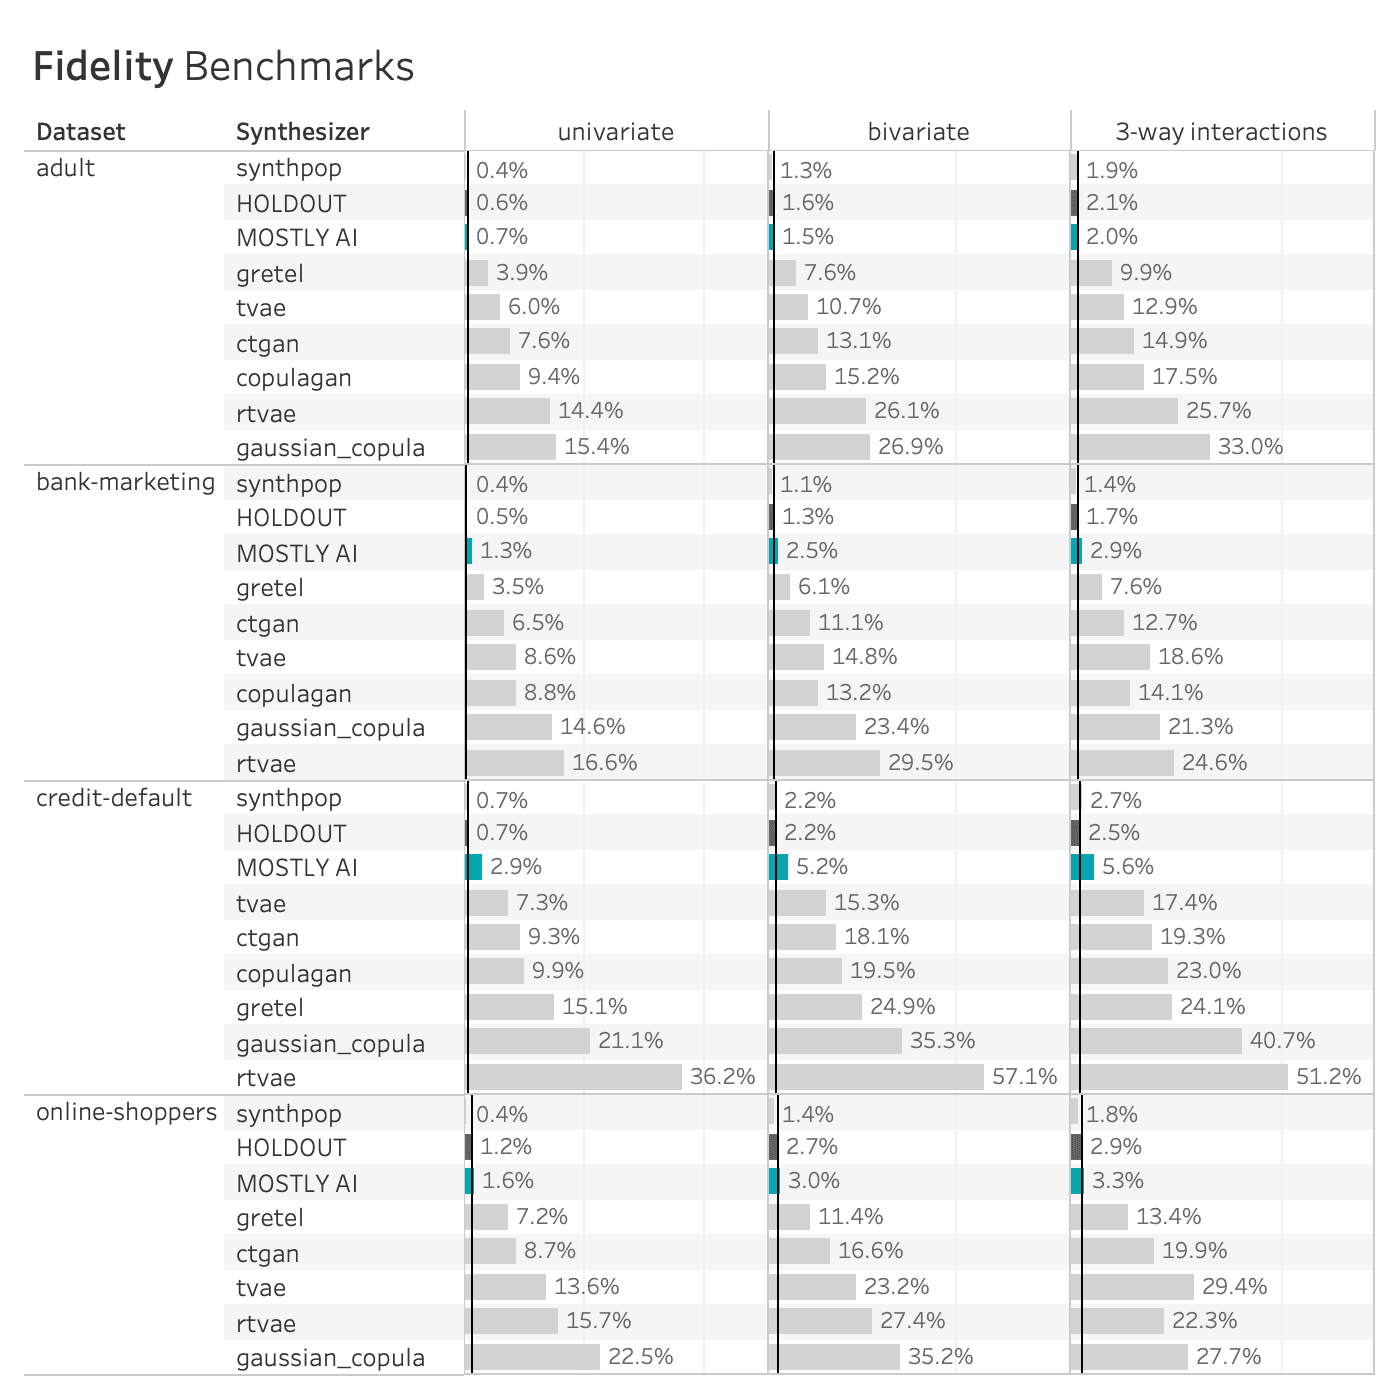
Many of the synthetic data generators create data that is significantly different from the holdout data, indicating a loss of data utility. The copulagan synthesizer failed to complete the online-shoppers benchmark. Only MOSTLY AI and synthpop closely resemble the holdout dataset.
The patterns seen on the adult dataset above are consistent across synthesizers and datasets. The Synthetic Data Vault and Synthcity generators compromise significantly on accuracy. The Gretel synthesizer does better but is still quite far (different) from the holdout set, especially for the bivariate and three-way interactions. Only MOSTLY AI and synthpop closely resemble the distribution of the holdout dataset, with synthpop consistently being closer to the training dataset than the holdout (i.e. potentially overfitting the training data).
Privacy Performance on a Single Dataset
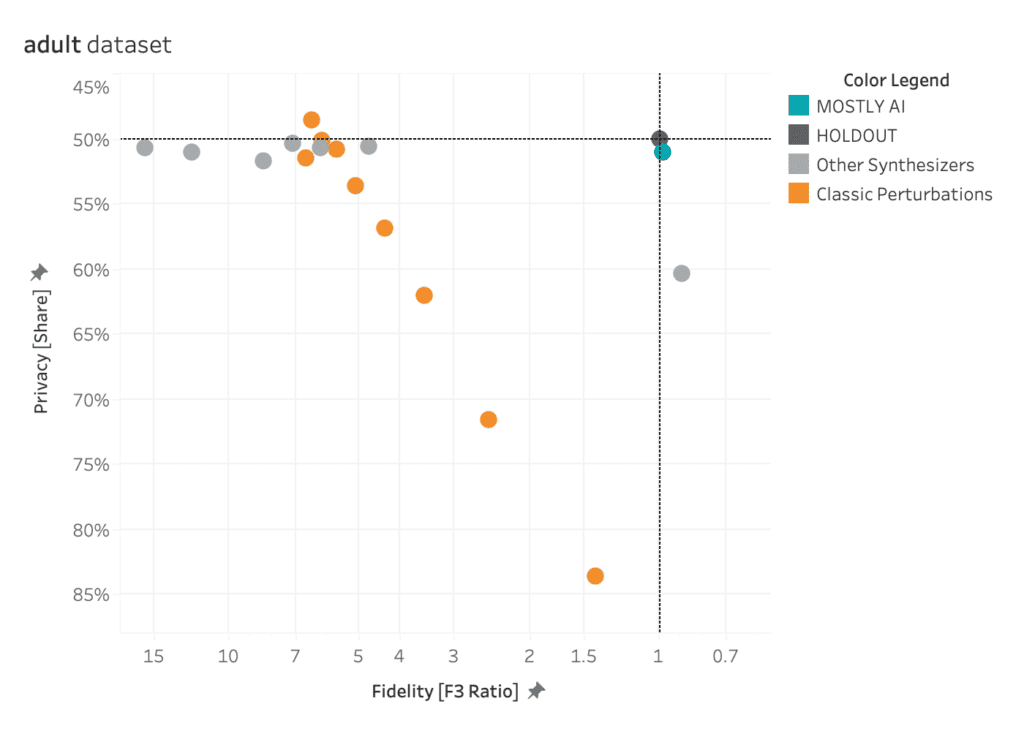
The plot below shows the privacy evaluation of the 8 benchmarked synthetic data generators, as well as for a varying degree of classic perturbation techniques, on the adult dataset. On the one hand, we report the ratio of the distance to the closest record (DCR) with respect to the training samples vs. with respect to the holdout samples. Here, a ratio of 1 would indicate that the synthetic samples are not any closer to the training samples than to the holdout samples. On the other hand, we also report the share of samples that is closer to a training sample than to a holdout sample. A share of 50% would indicate that the synthetic samples are just as likely to be closer to training than to a holdout record.
Almost all of the synthetic data generators are able to achieve a Privacy Share close to 50% (respectively a DCR Ratio close to 1) indicating that they are doing a good job of preserving the privacy of the records in the training dataset. Only synthpop seems to be slightly overfitting on the training data, confirming the previously reported results. All of the synthesizers seem fair to excellent when compared to the classic perturbation techniques that simply try to protect data by randomly substituting values.
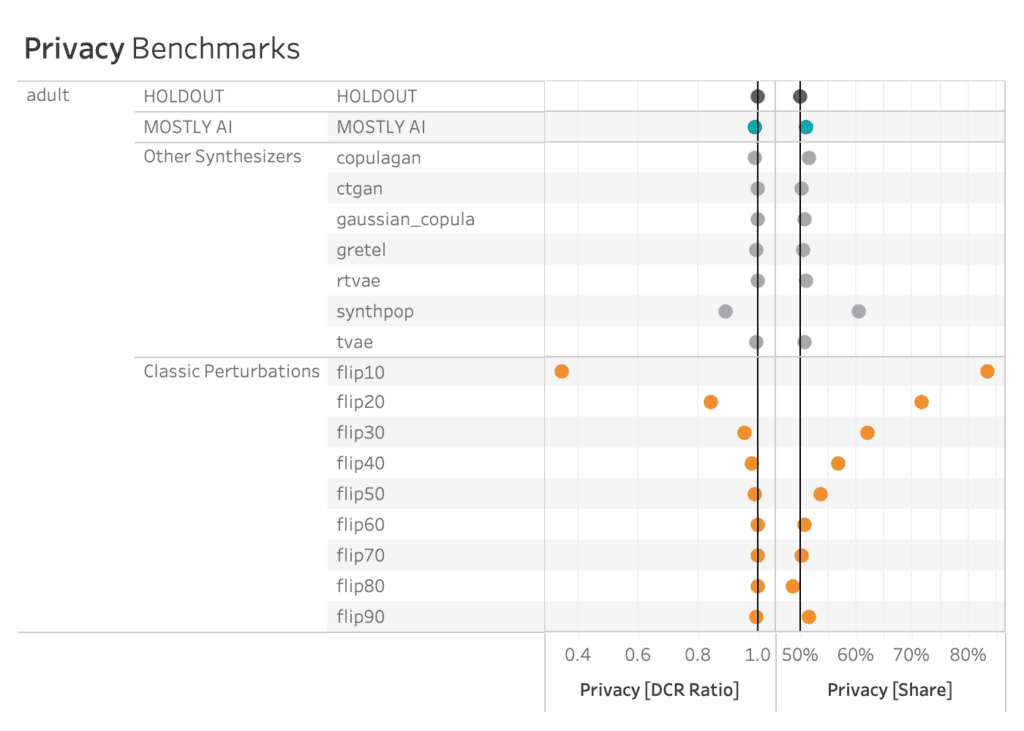
AI-driven synthesizers outperform classic perturbation techniques in terms of privacy measures.
Privacy Performance on all Four Datasets
The patterns seen on the adult dataset above are again consistent across synthesizers and datasets, with some greater variability on the credit-default and online-shoppers datasets. See below for full details. However, as argued before, privacy is only half the picture, and cannot be looked at in isolation. For that reason, it’s crucial to evaluate privacy and fidelity together, as shown in this final section.
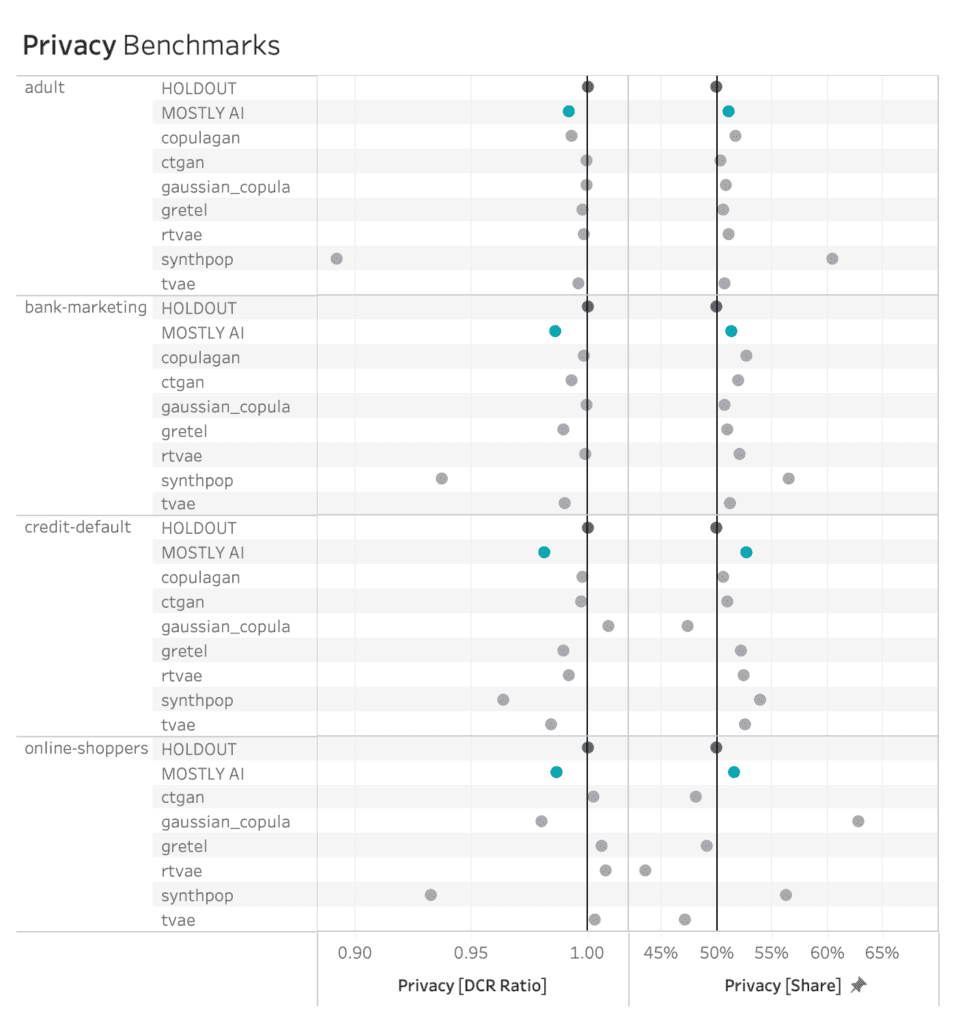
MOSTLY AI consistently ranks among the best synthesizers in terms of privacy measures.
The Full Picture
AI-driven synthetic data generators promise to deliver synthetic data that overcomes the classic privacy-utility tradeoff: preserving maximum data utility without compromising on the privacy of the training data. The visualizations below show to what extent the benchmarked synthetic data generators deliver on this promise.
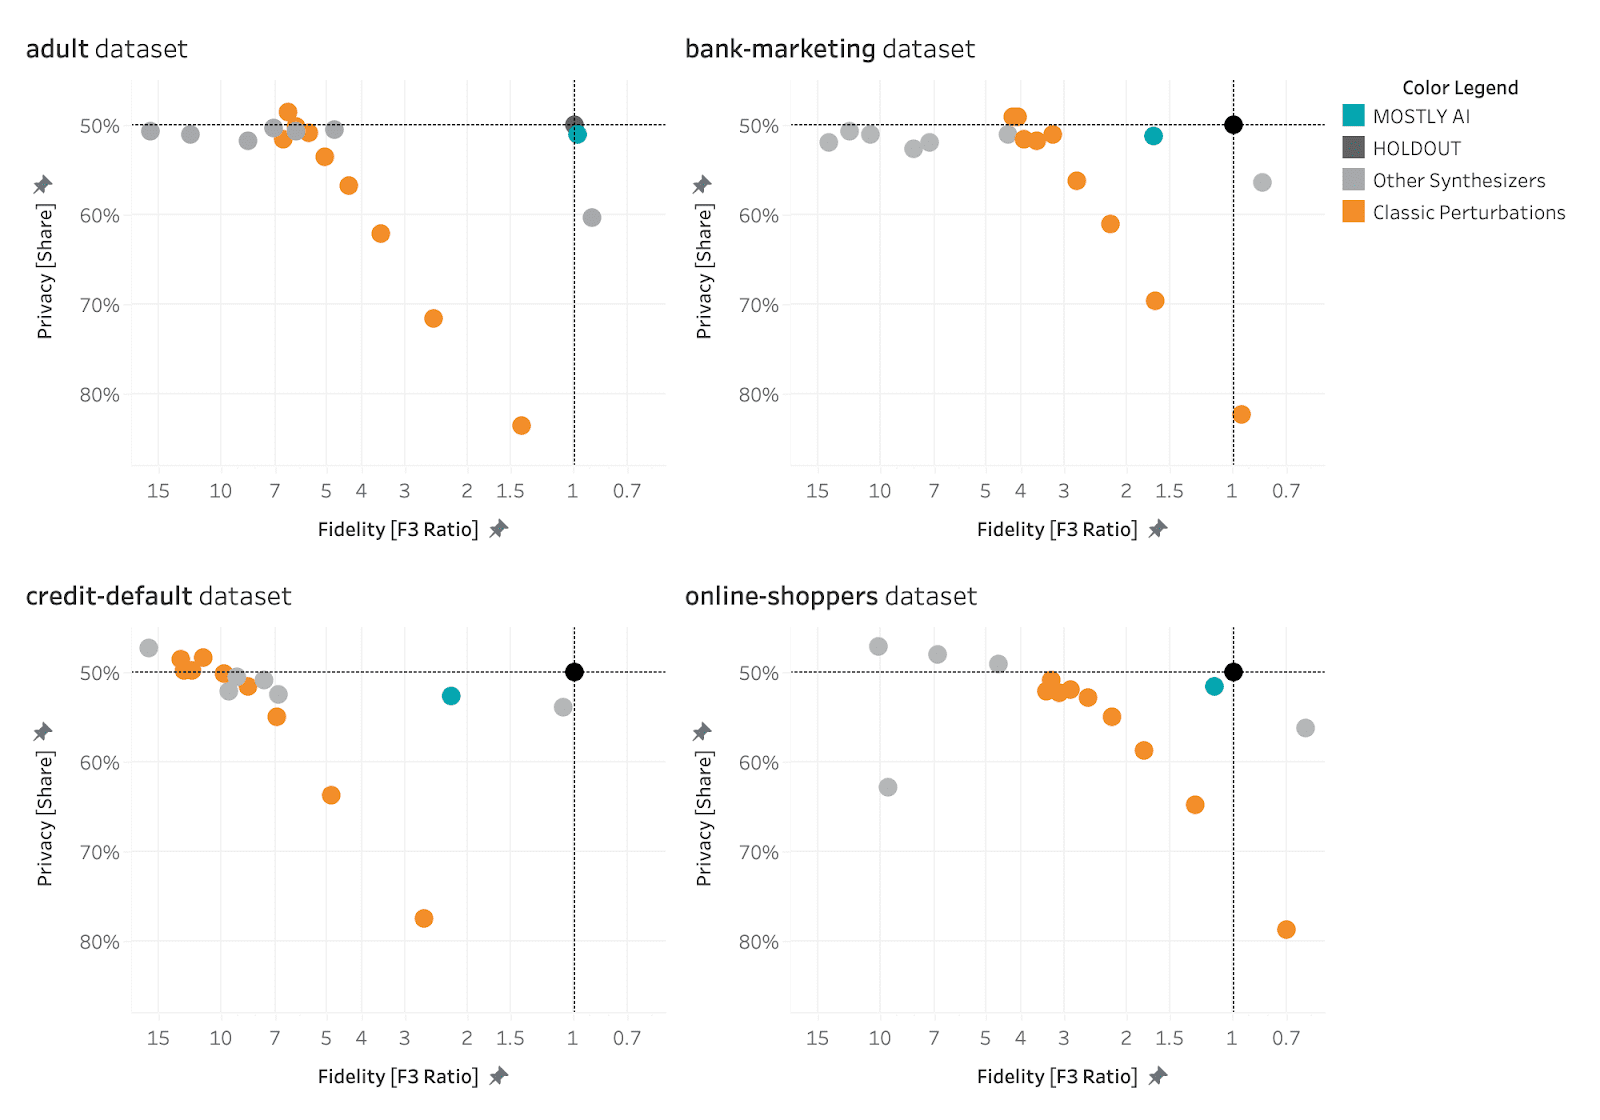
MOSTLY AI consistently ranks at the top of the benchmarked synthetic data generators in terms of both accuracy and privacy.
The black dot in the top right corner is the North Star of maximum utility and privacy preservation. The orange dots represented traditional anonymization techniques using various degrees of data perturbation. The grey dots represent the various synthetic data generators. The turqoise dot is MOSTLY AI which consistently ranks at the top of the benchmark results, both in terms of accuracy and privacy.
If you’re looking for a synthetic data generator that is able to consistently deliver optimal privacy and utility performance, give MOSTLY AI a try today and let us know what you think – the first 100K rows of synthetic data are on us!