Intro
In part I of this mini-series we outlined the particular challenges for anonymizing behavioral data, and continued in part II with a first real-world case study on transactional e-commerce data. In this post, we will expand the study, present further sequential datasets, and demonstrate the unparalleled accuracy and thus utility of MOSTLY AI’s synthetic data platform for behavioral data. Its ability to retain the valuable statistical information finally allows organizations to meet privacy regulations (and customers’ expectations) and still reap the immense value of their behavioral data assets at scale.
Datasets
These are the datasets of our study:
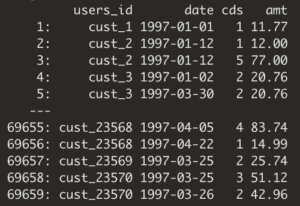
1. cdnow: 18-month of transaction records for CD purchases from a cohort of 23,570 customers. Each transaction contains information on the date of purchase, the number of CDs, as well as the total transaction amount. The dataset can be obtained from here
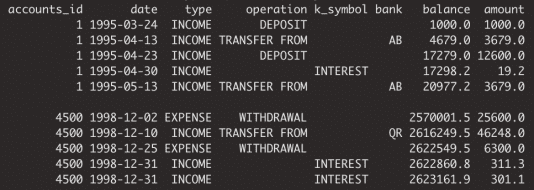
2. berka: This is one of the few freely available datasets on retail bank transactions. It has been released by a Czech bank for a machine learning competition in 1999, can be obtained from here, and consists of a bit over 1 million transactions with 6 attributes for a cohort of 4’500 bank customers.
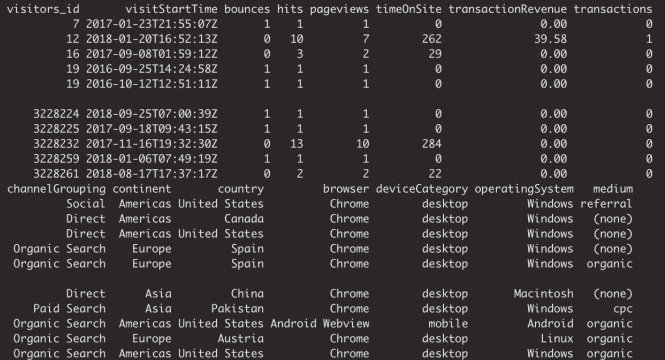
3. gstore: This set contains Google Analytics 360 data and represents site traffic for the Google Merchandise online store. The original dataset can be obtained from here, and contains over 1.6 million visitors, together with 14 of their visit-specific attributes over a 26-month period.
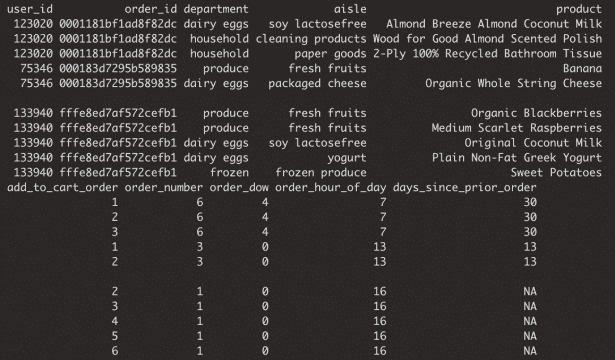
4. insta: This Kaggle dataset consists of 3.2 million orders by over 200’00 grocery customers, with an average basket size of 10.1 items, ordering from a total assortment of 49’677 products across 21 grocery departments.
The following table summarizes the varying range of dataset sizes:

Bear in mind, that these are all drastically limited versions of the underlying real-world data assets. Many of the otherwise available attributes, on subject- as well as on item-level, were held back by data providers in order to anonymize the data. With synthetic data all of the originally available information could have been shared in a privacy-preserving manner.
For each of the four datasets, we used the latest enterprise version of MOSTLY AI's synthetic data platform to create corresponding synthetic versions thereof. With the click of a few buttons we generated hundreds of thousands of synthetic subjects and their data points. All of them being highly realistic, as well as statistically representative of the original data, but fully anonymous.
As we’ve made the case before, behavioral data is all about its inherent sequential structure. Just as a text loses its meaning when words are assembled in random order (see an example with the First Amendment of the US Constitution below), behavioral data loses its value if its composition, its consistency and coherence cannot be retained. Any data synthesization thus needs to ensure that not only representative events, but that representative subjects together with their representative events are being generated.
for freedom or for or of the respecting peaceably no right religion, abridging the make the law and to shall a the of speech, to exercise establishment or of people government grievances. or Congress redress of assemble, thereof; of the the press; an prohibiting petition
With that in mind, we will focus the analysis in this study on the valuable intertemporal relationships.
CDNOW
The customer base of this former online CD store exhibits a broad variety of behavioral patterns. While we have transactions range from zero dollars (presumably promotional offers) to over a thousand dollars, and from 1 to 99 CDs being purchased at a single time, one can expect that customers rather tend to be consistent, and that transactions by the same person are strongly correlated. I.e., a person making a high-value purchase once is likely to do so again. And indeed, as it turns out, this is the case, both when analyzing the original and when analyzing our artificially generated data. The following charts visualize these correlations, as well as the full distribution of the difference between a first and a second transaction amount, and how each of these statistics perfectly aligns between original and synthetic data.

Due to this auto-correlation of succeeding transactions, it’s also common to observe a relatively small share of customers contribute to most of the total revenues of a company (and thus justifying different levels of acquisition and retention efforts). So, let’s validate this and move towards customer-level summary statistics, by aggregating over all the purchases for each customer. And indeed, in the presented dataset 20% of the most frequently buying customers of the actual cohort make up more than half (58%) of all transactions, and 20% of the most valuable customers contribute to 62% of all revenues. When querying the synthetic data, we can gain the same insights, with corresponding metrics being reported at 59% and 61% respectively. Yet, it’s not only single statistics but the full spectrum of these subject-level aggregates that is being accurately represented in the synthetic cohort, as can be seen in detail from the following plotted empirical distributions.

Next up, let’s investigate the share of customers that purchase a certain number of CDs, that had a given transaction amount spend, or that had a particular preceding inactivity period, at any one of their recorded transactions. E.g., while overall 45% of all transactions consisted of just a single CD, it is over two thirds (67%) of all customers that have had at least one single-CD purchase within their overall customer journey. Along the same line, it is 57% of customers that have exhibited a purchase hiatus longer than 135 days. Both statistics have been highlighted in the charts below, and show once again perfectly aligned results.

Further, let’s take yet another angle, and specifically, check for the consistency across all of the transactions of a customer. For that we will study the dispersion within attributes, and strengthen the test further by normalizing the standard deviation by its mean, resulting in the so-called coefficient of variation plotted below. In particular, the coefficient of variation for the intertransaction times being centered around 1 is an indication for exponentially distributed timing patterns. Once more, this same derived pattern can be seen for the actual as well as for the synthetic data.

In case your mind is boggling in the face of all these customer statistics, then don’t worry. The point that we are making here is that you can take any angle at the fully anonymous synthetic data in order to gain a deeper customer understanding, no matter whether it’s been anticipated or not before the actual synthesization process, and you will end up with highly aligned results.
BERKA
Our second case reflects a typical dataset structure within the finance industry. However, this publicly available set consists of only 4’500 accounts, while on the other hand each account has hundreds of data points. The challenge for a generic synthetic data solution thus is, to automatically extract generalizable relationships between all these data points based on a rather small sample.
We start out with an overall transaction-level analysis to gain a basic understanding of the original and synthetic datasets, before we compare again subject-level (in this case account-level) statistics in more detail. Transactions are spread out across a period ranging from 1993 to 1998, with a steadily growing upward trend, coupled with a strong seasonal pattern at the beginning of each year, as well as increased activity at the end of each month. In addition, there are strong dependencies between the categorical attributes as shown by the heatmap.

Accounts see a varying number of transactions, ranging from only a few up to 600 over the observed time period. Plotting the date of first transaction, i.e. the customer acquisition date, shows that the customer base has been steadily growing, with a particular strong year in 1996. Further, an analysis of the timing of the 100-th transaction remains consistent between the original and the synthetic data as well.

Next up we investigate the intertransacion times, which is a derived measure calculated as the elapsed number of days between two succeeding transactions. A value of 0 implies that a transaction has occurred on the same day as the previous transaction. The following charts take 3 different perspectives on this intertemporal metric. While, for example, overall a quarter of the transactions happened on the same date as a previous transaction, that pattern has been less pronounced in 1993, the initial year of the recording, as it had a significantly larger share of 13 days or longer periods of customer inactivity.

And lastly, we again look at the share of accounts that had a given amount/symbol/type at any of their transactions. E.g. while practically all accounts have had expenses and incomes recorded, the share of accounts with withdrawals is consistently low at around 25%, both for the real and the synthetic accounts.

GSTORE
It’s time to step up the game, and consider this online Merchandise store case with a significantly bigger population size, in this case, 1.6 million visitors, together with their visits. With this amount of data, the underlying generative deep neural network models of MOSTLY AI are able to fully leverage their capacity and retain information at a deeper level, as we will see next.
Visitors to the site are coming from over 200 different countries, with the US making up 40% of all visitors, India is second with a share of 7%, and UK, Canada, Germany follow the ranks. However, the exhibited behavior is distinctively different by country. US and Canadian visitors are the ones who are more likely to return multiple times to the site (20% likelihood vs. a 10% chance for the rest of the world) and are also the ones that actually end up making purchases at the store (as recorded by the attribute `transactionRevenue`). However, in that respect, a US visitor is still more than 3 times as likely to generate revenues than a Canadian visitor. Certainly a relevant insight for anyone looking to improve the store’s performance.

Each visitor is being identified in the dataset by a unique identifier. Typically, a visitor accesses the site with the same device, the same browser and within the same country, thus these attributes remain consistent across visits. However, there are exceptions to this rule, and we can detect these same exceptions again reliably in the synthetic data. 4.1% of returning visitors access the site from a different country, and 0.4% use a different browser in one of their later visits than they did in their first visit. For the synthetic data, these numbers are closely matched, with 4.4% and 0.6% each, i.e. it exhibits the same level of subject-level consistency over time as is present in original data.

Finally, let’s dive even deeper into the data by cross-tabulating subject-level statistics by two categorical visit-level attributes. The following analysis indicates that the combination of the traffic source (of a visitor’s initial visit) and the device category is strongly, yet non-linearly related to the time spent on the site. While referrals result in shorter sessions for their first-time visit on the desktop than on the mobile, it is interestingly the other way around for organic traffic. For their second-time visit desktop users are then consistently spending more time on the site compared to mobile users. A non-trivial, yet persistent relationship worth investigating further.

INSTA
We will conclude our benchmark study with another large real-world dataset from the retail industry. This one consists of over 200k customers and their 32 million purchased product items.
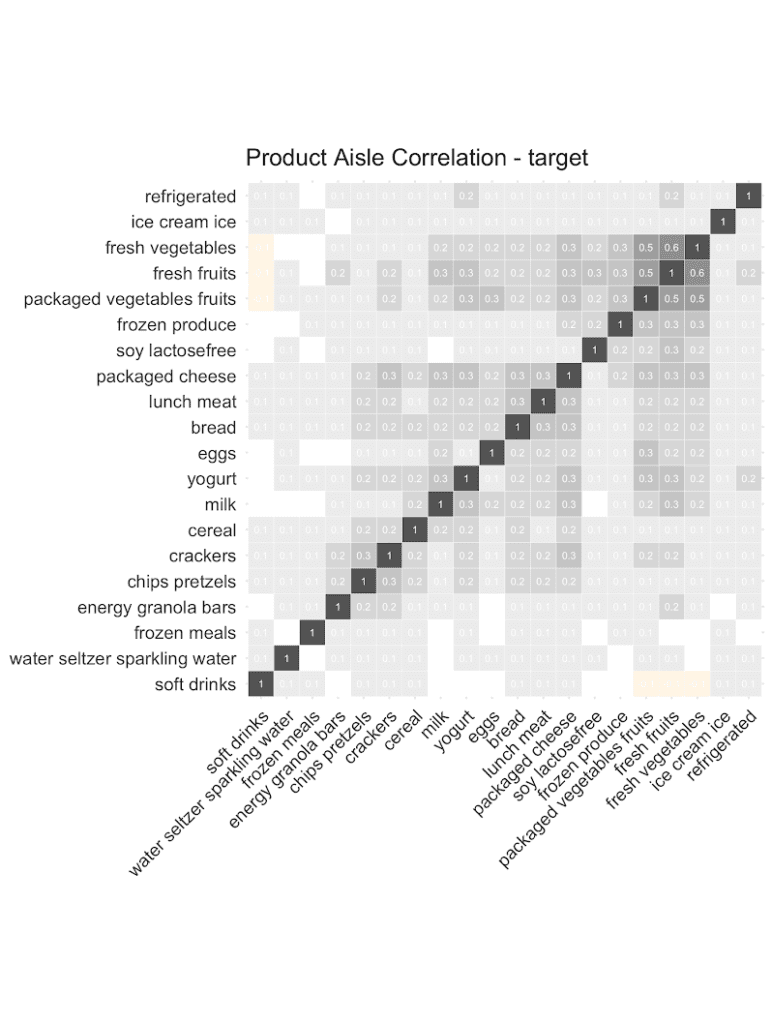
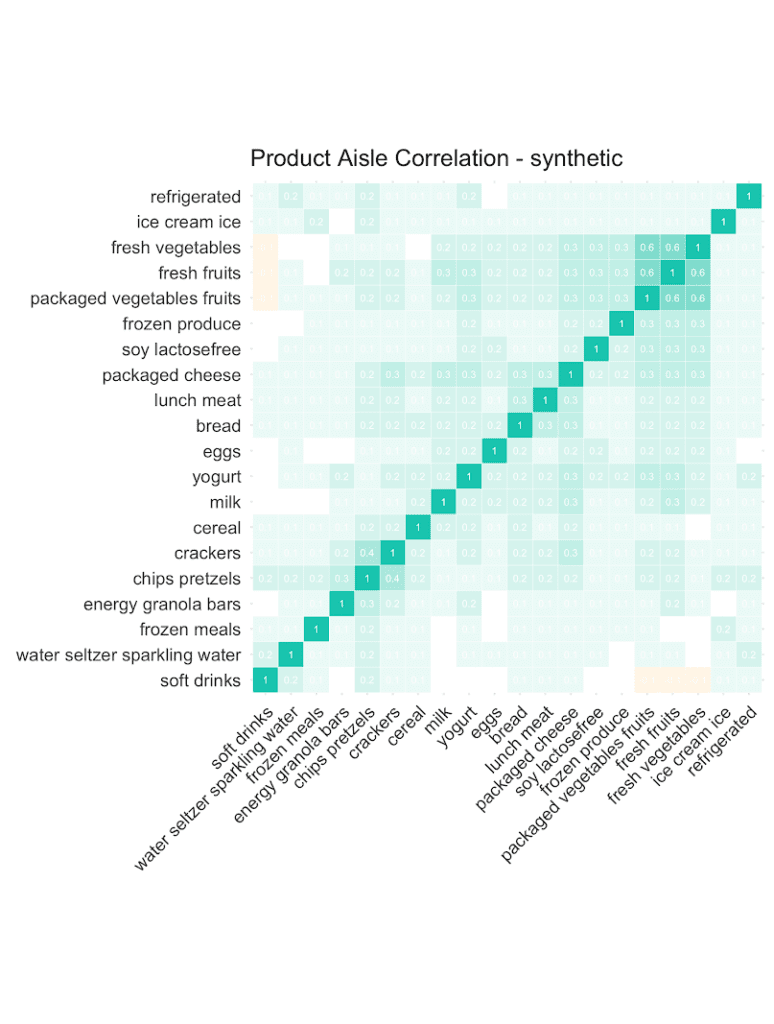
Let’s start out by checking the co-occurrences of popular product aisles: Purchases of chips are positively correlated with purchases of pretzels. And customers that buy fresh vegetables are more likely to add fresh fruits, and less likely to add soft drinks to their shopping list. And as can be seen from the following correlation plots, it’s the overall structure and relationships that are being very well retained in the synthetic data. This valuable information on basket compositions (in the context of a customer’s past purchase behavior) allows to build smart recommender systems that help users quickly add further items to their baskets, significantly improving their shopping experience. All possible in a fully privacy-preserving manner, with any internal teams or external partners developing these systems, thanks to our AI-based synthetic data solution.
Overall, the grocery store has a very broad assortment with over 49’677 products across 134 aisles, and 21 departments being enlisted. Here are the actual and the synthetic shares of all products, of all aisles and of all departments plotted against each other.

But any given customer will only ever purchase from a small subset of the assortment, in particular as customers tend to repurchase the same items over and over again. Let’s thus check the distribution, in terms of number of distinct products and distinct product aisles being ever purchased by customers. And of course, as we are not just interested in an “average” customer, we will inspect the full distribution of these metrics, as visualized below. Once more, we can see a near-perfect alignment between the real world and our synthetic world. This is a particularly remarkable achievement, as the synthetic data generator needs to be aware of the complete product spectrum as well as the full purchase history when generating new synthetic orders, that are to be statistically representative and coherent.

Conclusions
This third blog post in our series on synthetic behavioral data turned out lengthy and technical, and contained lots (and lots and lots) of statistics. Thanks for bearing with us. But we intentionally wanted to go the extra mile to demonstrate the sheer power and unparalleled accuracy of MOSTLY AI's AI-powered synthetic data platform across a broad range of datasets. So, no matter whether your customer data is big or small, wide or tall, static or dynamic, numeric or categorical, our solution will be able to reliably pick up the patterns and provide you with a synthetic, statistically representative version thereof. One that captures all the value, and yet is fully anonymous, and thus unrestricted to utilize and leverage further.
Behavioral data is the new gold, but it requires more than a few people to make the most out of it. And yet, the era of privacy is here, and here to stay. So, reach out to us and learn more about how you can go synthetic, and become the superhero of your organization who can finally make both data sharing and data protection possible at the same time.
Credits: This work is supported by the "ICT of the Future” funding programme of the Austrian Federal Ministry for Climate Action, Environment, Energy, Mobility, Innovation and Technology.


