TL;DR Understanding data diversity and fairness in AI is crucial for developing responsible models. This blog post explores the impact of biased data and the benefits of using diverse datasets. Biased data can lead to discriminatory outcomes in decisions like mortgage approvals or job applications. Traditional techniques to mitigate bias include diverse data collection, data preprocessing, and fair representation learning. However, traditional methods can be complex and resource-intensive. An innovative solution is using statistical parity synthetic data, which ensures a fair representation of all groups without sacrificing model performance. By leveraging the latest release of the MOSTLY AI Platform, we demonstrate how fair synthetic data can be created that can create more equitable AI systems and help reduce societal biases.
Everyone is talking about data diversity and fairness in AI. The big questions are: why should you care, and what can you do?
On one hand, everyone should care about how AI is used and how we can drive its future, as data stewards, data scientists, or stakeholders. On the other hand, it is challenging to engage with others and communicate its importance effectively.
In this blog post, we will explore the challenges of biased data and the opportunities that come when using more diverse data. By leveraging diverse data, such as the statistical parity synthetic data that can be created with the MOSTLY AI Platform, we can better understand and mitigate biases. This innovative approach allows us to create fairer and more robust models, offering a best-in-class solution for fairness and making us more responsible data practitioners.
But first let’s start with an overview of what biased data actually is and what impact it has in the real world.
What is biased data?
If you ask ChatGPT what biased data is, the answer would be something like:
“Biased data refers to information that is systematically skewed or unrepresentative of the true situation or population being studied. This skewing can arise from various sources and can significantly impact the conclusions drawn from the data.“
ChatGPT
Here, we encounter the first challenge: communicating the risk of biased data without sounding like a bot!
Biased data is more straightforward to understand if we discuss its consequences. We use data every day to better understand the world and make decisions. Training a machine-learning algorithm transforms data into code. Different techniques translate data into code differently, but the result is the same: we learn from data to make and influence decisions. Oftentimes these decisions can be summarized as “yes-or-no” decisions.
Real-World Impact of Biased Data
For example, consider these scenarios of yes-or-no decisions:
- Can I get a mortgage for my dream house?
- Am I a good candidate for that job position?
- Will my last Instagram post go viral?
Machine-learning algorithms constantly answer these questions. But what is the data that has been used to train them? Am I going to be discriminated against because the training data does not represent me well? If people like me don’t usually get a mortgage, will I be able to? And even further, what will the algorithm compare me against? The same gender? Age? Salary?
We are starting to understand why we should care more about the data we use and how well it represents society. Data is incomplete by nature. We can only capture a timeframe, some attributes, and parts of the population. Humans, services, and apps collect data. If you don’t interact with them, you are not there. So, which part of the data population represents you?
Think of a clinical study. If the participants are from a specific age group, the results may not apply to the broader population. The same goes for data used for analyses and training of ML models.
Biased data is incomplete data that doesn’t accurately represent society. It can also represent society incorrectly or not in a way that we would actually like society to be represented. For example if the data comes from a different era or contains prejudices. The big problem with biased data is that it leads to biased models or analyses that then in turn lead to biased decisions.
What does a biased dataset look like?
The 1994 US Census dataset is an excellent example of a biased dataset. The dataset captures various socioeconomic and demographic characteristics, but it also mirrors the biases present in society at that time. For instance, there are notable disparities in income levels across different gender and racial groups, often rooted in historical inequities as shown in the charts below. Women and minority groups are underrepresented in higher income brackets, not due to a lack of qualification or effort, but because of systemic discrimination and data collection issues.
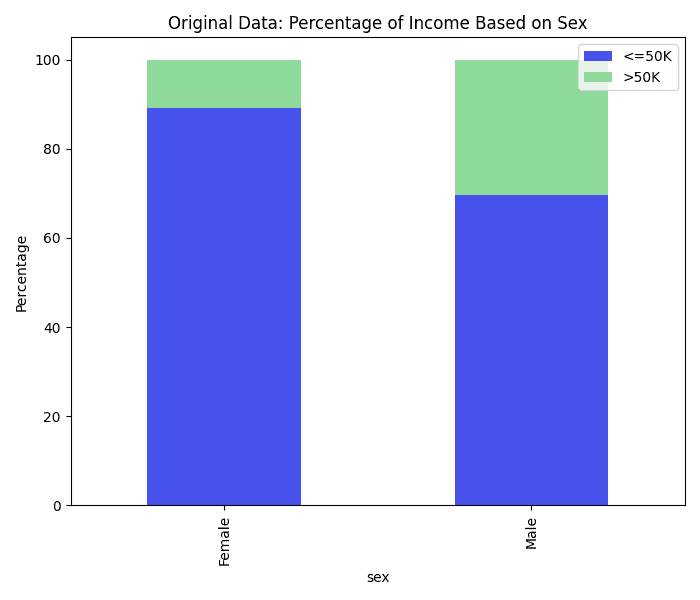
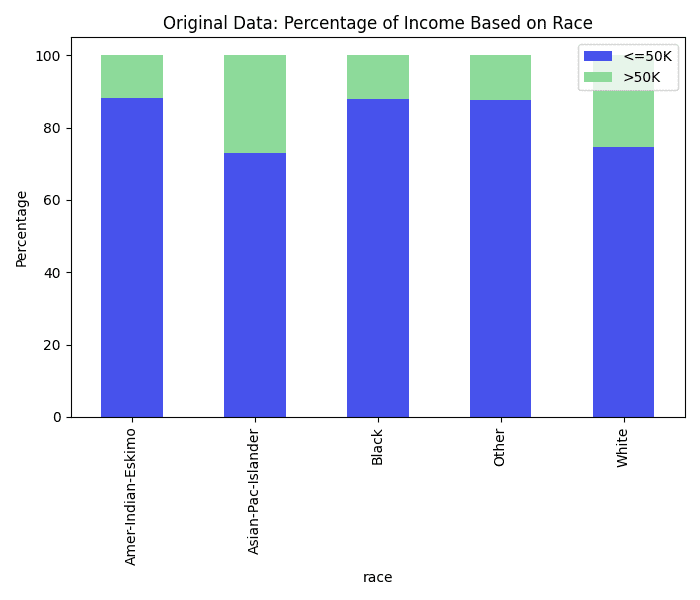
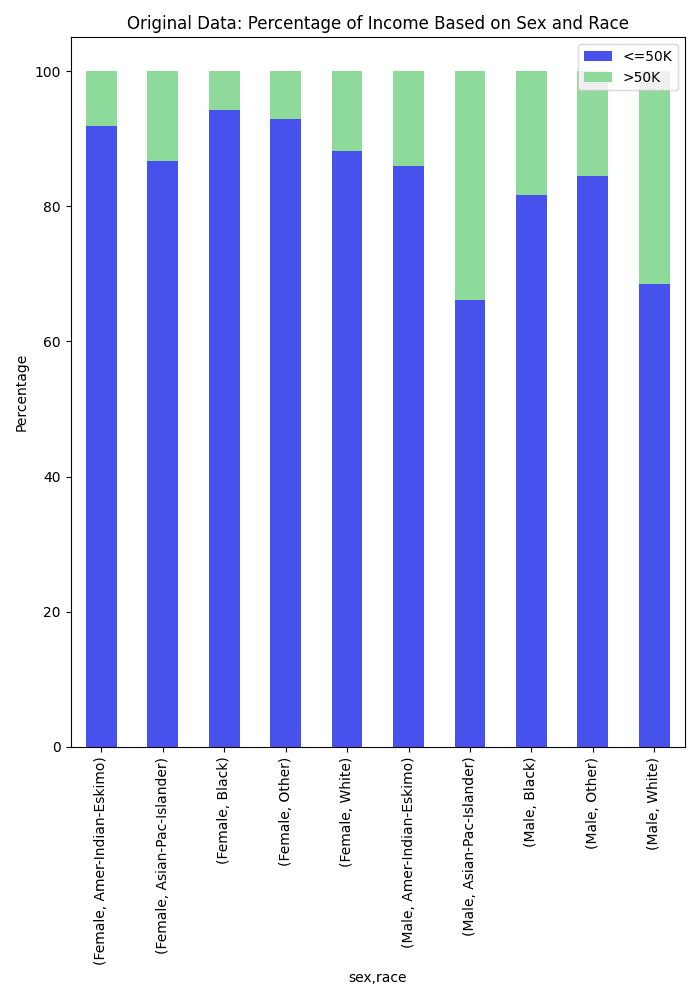
Looking at the distribution of low income vs. high income for sex, race, and sex and race combined, it is clear that the data distribution represents systematic biases. White males are the most represented with high income in the dataset.
Training a machine learning model – for example, an income predictor – will predict higher incomes for men compared to women with similar qualifications and experience due to the historical income disparity reflected in the data.
The model might produce discriminatory outcomes in real-world applications, such as hiring, lending, or educational opportunities, leading to unequal treatment of individuals based on gender, race, or other demographic factors.
In many jurisdictions, there are legal requirements to ensure non-discriminatory practices in employment, credit, and other areas. A biased classifier could result in legal repercussions for violating these regulations.
Furthermore, using a biased model raises significant ethical issues, as it can reinforce societal inequalities and harm disadvantaged groups.
So, how can we get rid of biases?
Bias mitigation techniques
Now that we understand the challenges of biased data let’s explore how to mitigate its effects. This involves using different techniques during the stages of data collection, preprocessing, and model training.
Data Collection and Sampling Strategies
The first step in mitigating bias starts with how we collect and sample data. The foundation of any model is its training data, and it is crucial to ensure that the dataset is diverse and representative.
- Diverse Data Collection: Actively seek out underrepresented groups.
- Random Sampling: Use random sampling to reduce selection bias and ensure equal inclusion chances.
Data Preprocessing
Once we have collected the data, the next stage is preprocessing it. This step involves preparing the dataset to eliminate biases and inconsistencies that may skew the model’s results.
- Data Cleaning: Remove inaccuracies, outliers, and inconsistencies.
- Data Augmentation: Create new samples to represent underrepresented or critical cases better.
- Resampling: Balance the dataset by oversampling underrepresented groups and undersampling overrepresented ones (e.g., using SMOTE).
Feature Engineering
After preprocessing the data, the next step is feature engineering. This process involves selecting and creating features that the model will use to make predictions, which significantly mitigates bias.
- Feature Selection: Choose features that are less likely to introduce bias, avoiding direct features related to sensitive attributes like race, sex, or age.
- Feature Creation: Introduce new features that help mitigate bias, such as those related to socioeconomic status.
Model Training
The way we train our models also significantly impacts their fairness. There are specific techniques we can employ during training to reduce bias.
- Adversarial Debiasing: This involves training a model alongside an adversarial component designed to predict a sensitive attribute (like race or sex). The goal is to minimize the primary task error while making it difficult for the adversarial model to succeed. By doing so, the primary model learns to ignore biased information about sensitive attributes, resulting in fairer predictions.
- Fair Representation Learning: This technique creates data representations invariant to sensitive attributes. The data is transformed to hide sensitive information, ensuring these attributes do not influence the model's predictions. This helps ensure the model makes decisions based on unbiased and fair features, reducing the risk of discrimination.
Post-Processing
Even after training, biases can persist in model outputs. Post-processing techniques are used to adjust these outputs to ensure fairness.
- Bias Correction: Adjust model outputs to reduce bias, applying thresholds or other adjustments to ensure fairness across different groups.
- Fairness Constraints: Apply constraints during decision-making to ensure fairness, such as limiting allowable disparity between groups.
Bias Detection and Monitoring
Finally, bias mitigation is an ongoing process. Monitoring and evaluating models is essential to continuously identify and address biases.
- Bias Detection: Monitor models for bias by analyzing performance across different demographic groups.
- Fairness Metrics: Use fairness metrics like disparate impact, equal opportunity, demographic parity, and calibration to measure and ensure fairness in models.
Limitations of Traditional Approaches
While these bias mitigation techniques can help you achieve fairer outcomes, they come with significant challenges. One is the need to change the data ingestion process–sometimes it is too late or simply not possible–or the need for data scientists' knowledge about fairness and bias to implement these strategies effectively. This requires substantial expertise and effort, which can be a barrier for many organizations and steer them away from their primary objectives.
All in all, traditional bias mitigation is a cumbersome and difficult process. There is the need for a more elegant alternative.
Statistical Parity Synthetic Data
Statistical parity synthetic data offers a solution to address these limitations. This approach helps achieve fairness in a more practical and scalable manner. Statistical parity synthetic data involves generating synthetic data that meets statistical parity requirements, ensuring that the likelihood of an outcome is independent of sensitive attributes such as race, sex, or age while keeping the other statistical patterns and correlations intact.
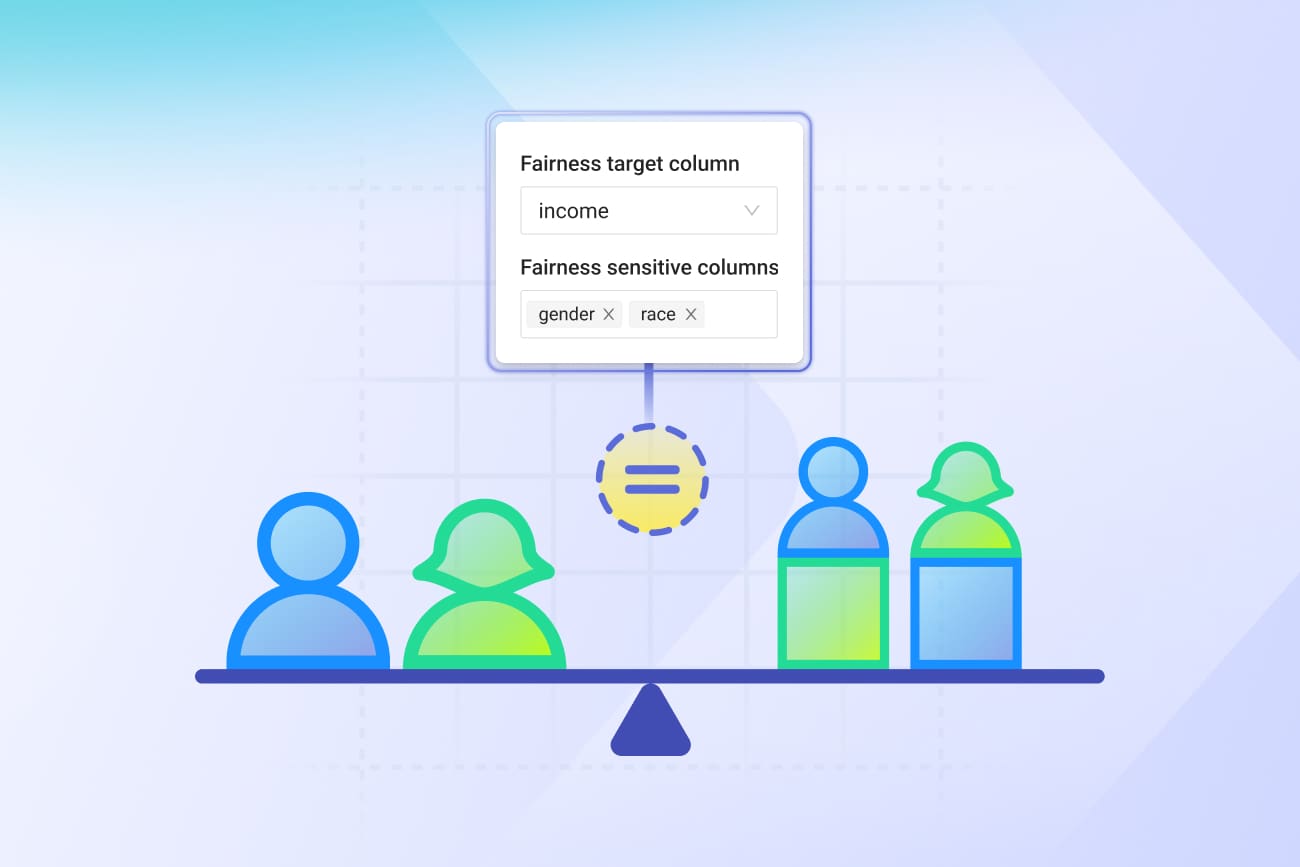
With the latest release of the MOSTLY AI Platform, it is now possible to train a generative AI model on a dataset and then generate synthetic data with a fairness objective. With the fairness objective, the synthetic data will ensure that the distribution of the target column (e.g., income) is statistically independent of the values in the sensitive columns (e.g., sex and race).
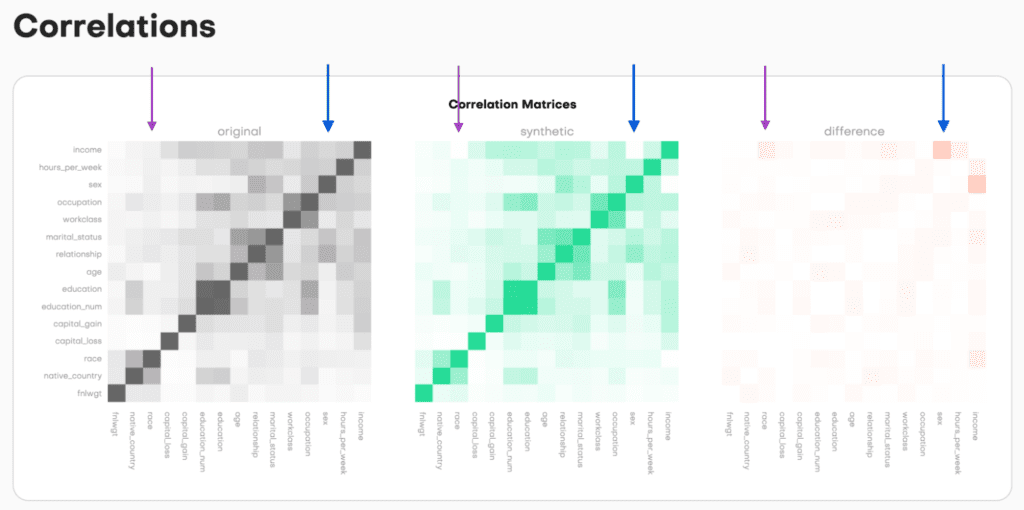
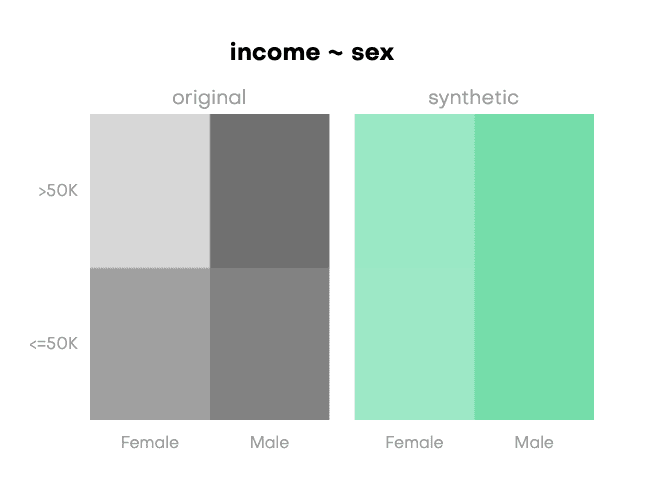
What does that look like in practice? Let’s turn to the 1994 US Census dataset again and correct for the income bias using the MOSTLY AI Platform. The charts below compare the original data with the fair synthetic data. In the statistical parity synthetic data, the percentages of people with high and low income by sex, race, and sex and race combined have been equalized to represent the population more fairly.
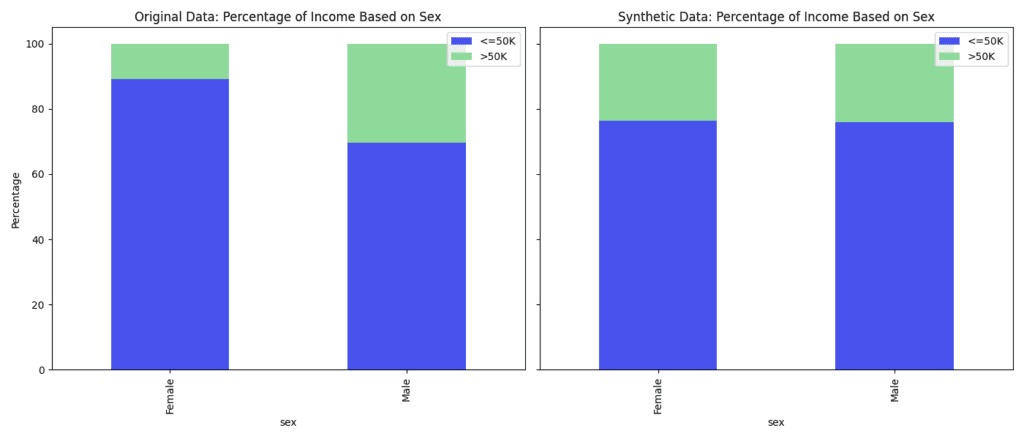
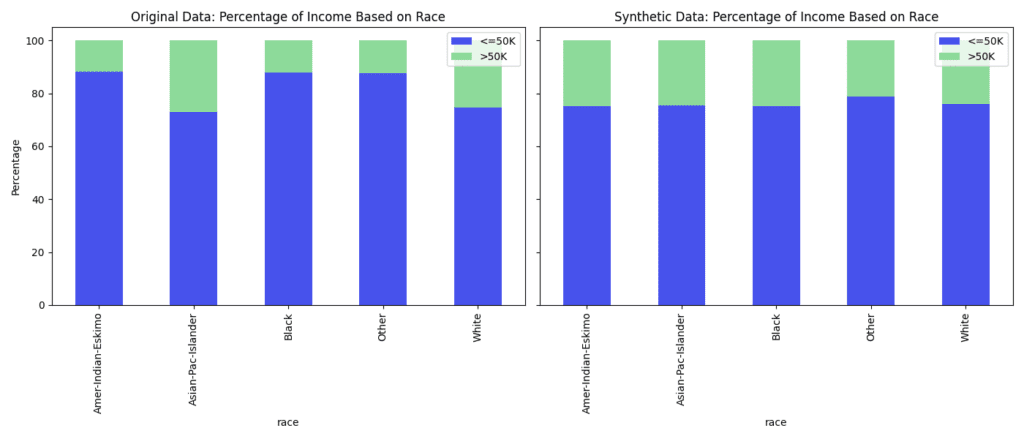
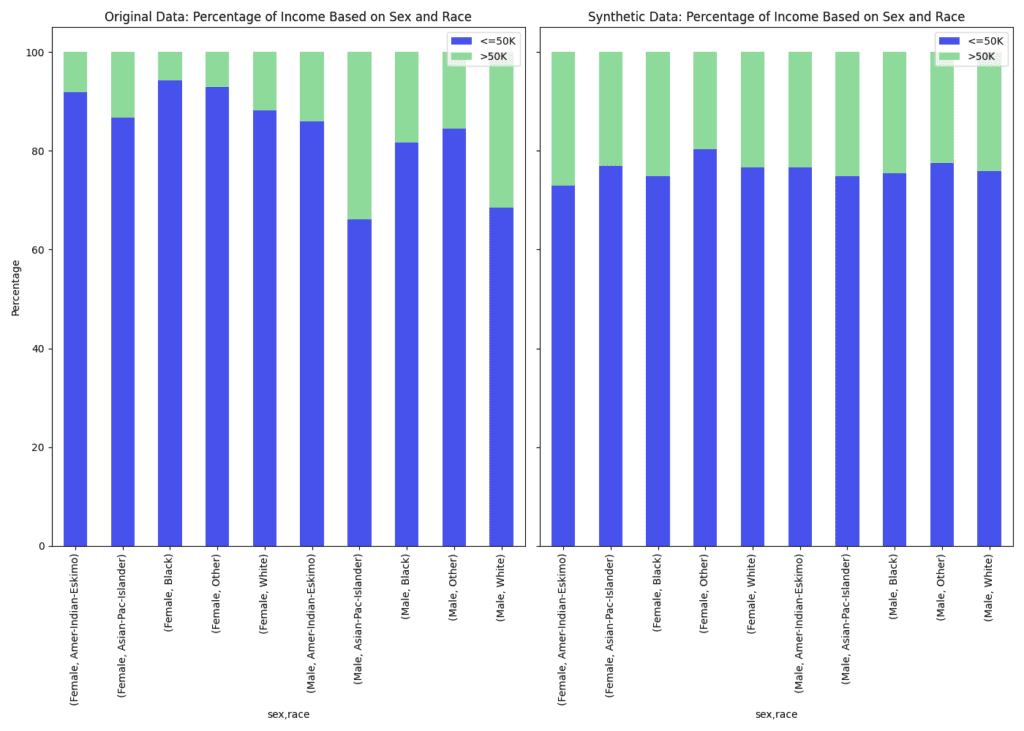
While we fixed the distribution of sex and race vs. income, we can see that all the other correlations are retained.
A model trained on statistical parity data will likely produce more equitable predictions across different demographic groups. By removing correlations between income and sensitive attributes like sex and race, the model treats these attributes as neutral, reducing biased outcomes.
To demonstrate this, we trained ten LightGBM models to classify high-income using the original and synthetic data generated with statistical parity. In the tables below, you can see the average probabilities of classifying a person as high-income based on different sexes, races, and combined sexes and races for models trained on the original and synthetic data.
| Sex | Predicted Probability (Original) | Predicted Probability (Synthetic) |
| Female | 0.108862 | 0.227753 |
| Male | 0.303614 | 0.236027 |
| Race | Predicted Probability (Original) | Predicted Probability (Synthetic) |
| Amer-Indian-Eskimo | 0.157099 | 0.244803 |
| Asian-Pac-Islander | 0.237437 | 0.227347 |
| Black | 0.140645 | 0.234633 |
| Other | 0.110502 | 0.248850 |
| White | 0.253017 | 0.233081 |
| Sex | Race | Predicted Probability (Original) | Predicted Probability (Synthetic) |
| Female | Amer-Indian-Eskimo | 0.032756 | 0.205210 |
| Female | Asian-Pac-Islander | 0.129759 | 0.290558 |
| Female | Black | 0.057664 | 0.235119 |
| Female | Other | 0.026273 | 0.354049 |
| Female | White | 0.118150 | 0.223391 |
| Male | Amer-Indian-Eskimo | 0.204468 | 0.269377 |
| Male | Asian-Pac-Islander | 0.328044 | 0.202589 |
| Male | Black | 0.211490 | 0.234195 |
| Male | Other | 0.166655 | 0.191469 |
| Male | White | 0.313453 | 0.237620 |
The low values for Male—Other and high values for Female—Other in the two datasets can be explained by the low occurrence of these data points.
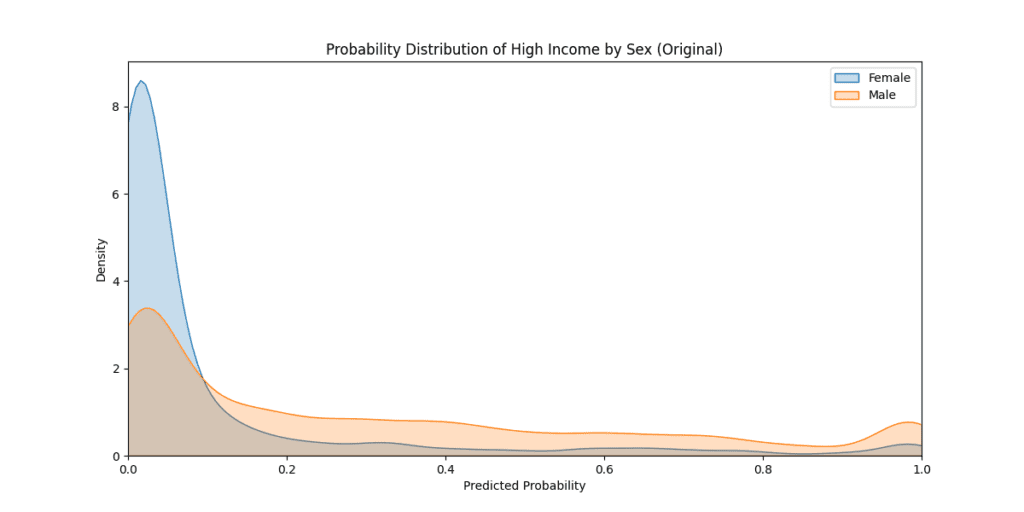
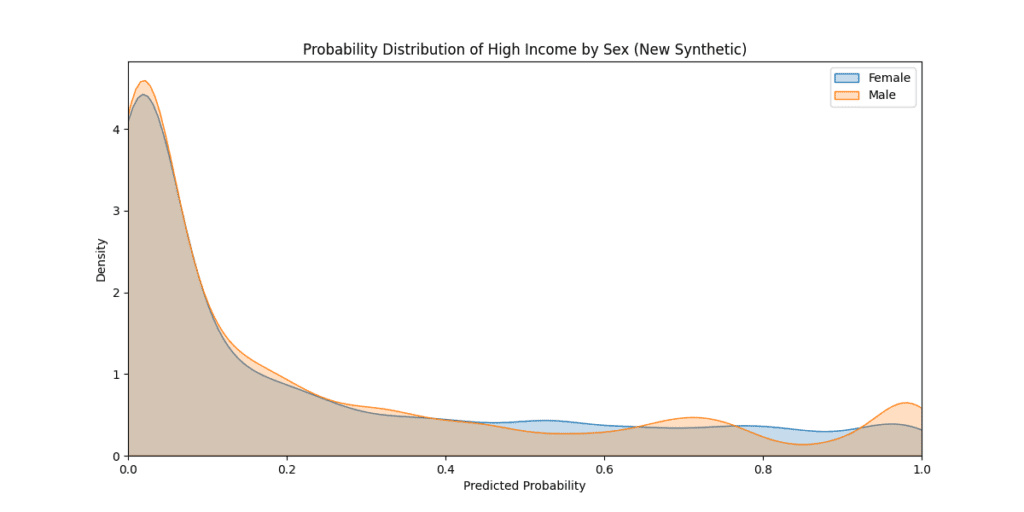
Plotting the probability distribution by sex, we observe an almost perfect equality between the predicted probabilities.
Finally, evaluating the models' performance (averaging the ten models) with the original test set (see the "Evaluate Synthetic Data Quality Using Downstream ML" blog post for more information on the evaluation setup), we can see that the parity correction comes with minimal compromise in predictive accuracy.
| Metric | Model trained on original data | Model trained on statistical parity synthetic data |
| Accuracy | 0.8709 | 0.8448 |
| AUC | 0.9280 | 0.8922 |
This comparison illustrates that while predictive performance metrics are slightly reduced, the significant improvement in fairness and equitable treatment across different demographic groups makes statistical parity synthetic data a compelling choice for creating fair and responsible AI models.
Final considerations
Throughout this blog post, we explored the significant challenges biased data poses and the importance of fairness in AI models. We discussed how biased datasets, such as the 1994 US Census dataset, can perpetuate societal inequalities and lead to discriminatory outcomes in real-world applications. We highlighted the real-world impact of these biases and demonstrated how models trained on biased data could reinforce systemic discrimination.
By comparing models trained on original biased data and those trained on statistical parity synthetic data, we illustrated the effectiveness of using synthetic data to achieve fairer predictions. The results showed that while there might be a slight trade-off in predictive accuracy, the substantial gains in fairness and equitable treatment of diverse demographic groups make it a compelling choice.
Incorporating statistical parity synthetic data offers several key benefits:
- Ease of Use: Unlike traditional methods that require specialized knowledge, statistical parity synthetic data can be used more broadly, reducing the need for expert intervention.
- Balancing Representation: By generating synthetic data that meets statistical parity requirements, we can balance the representation of all groups in the training data. This helps mitigate biases that arise from underrepresented groups.
- Enhancing Fairness: Statistical parity ensures that the likelihood of an outcome is independent of sensitive attributes such as race, sex, or age. This directly contributes to the fairness of the model’s predictions.
- Robust Models: Using synthetic data that meets statistical parity can lead to more robust models that perform better across diverse populations, reducing the risk of biased decisions.
By incorporating statistical parity synthetic data, we can address the limitations of traditional approaches and significantly enhance our models' fairness and robustness.
If you’re curious about fairness and biases, continue reading our Fairness Blog Post Series and listen to this episode of the Data Democratization Podcast.
To explore statistical parity through synthetic data in-depth, check out our NeurIPS 2023 paper, Strong statistical parity through fair synthetic data.
PS: Analysis was proudly done with the MOSTLY AI Assistant.