
In this tutorial, you will learn how to tackle the problem of missing data in an efficient and statistically representative way using smart, synthetic data imputation. You will use MOSTLY AI’s Smart Imputation feature to uncover the original distribution for a dataset with a significant percentage of missing values. This skill will give you the confidence to tackle missing data in any data analysis project.
Dealing with datasets that contain missing values can be a challenge. The presence of missing values can make the rest of your dataset non-representative, which means that it provides a distorted, biased picture of the overall population you are trying to study. Missing values can also be a problem for your machine learning applications, specifically when downstream models are not able to handle missing values. In all cases, it is crucial that you address the missing values as accurately and statistically representative as possible to avoid valuable data loss.
To tackle the problem of missing data, you will use the data imputation capability of MOSTLY AI’s free synthetic data generator. You will start with a modified version of the UCI Adult Income dataset that has a significant portion (~30%) of missing values for the age column. These missing values have been intentionally inserted at random, with a specific bias for the older segments of the population. You will synthesize this dataset and enable the Smart Imputation feature, which will generate a synthetic dataset that does not contain any missing values. With this smartly imputed synthetic dataset, it is then straightforward to accurately analyze the population as if all values were present in the first place.
The Python code for this tutorial is publicly available and runnable in this Google Colab notebook.
Dealing with missing data
Missing data is a common problem in the world of data analysis and there are many different ways to deal with it. While some may choose to simply disregard the records with missing values, this is generally not advised as it causes you to lose valuable data for the other columns that may not have missing data. Instead, most analysts will choose to impute the missing values.
This can be a simple data imputation by, for example, calculating the mean or median value of the column and using this to fill in the missing values. There are also more advanced data imputation methods available. Read the article comparing data imputation methods to explore some of these techniques and learn how MOSTLY AI’s Smart Imputation feature outperforms other data imputation techniques.
Explore the original data
Let’s start by taking a look at our original dataset. This is the modified version of the UCI Adult Income dataset with ~30% missing values for the age column.
If you’re following along in Google Colab, you can run the code below directly. If you are running the code locally, make sure to set the repo variable to the correct path.
import pandas as pd
import numpy as np


# let's load the original data file, that includes missing values
try:
    from google.colab import files  # check whether we are in Google colab

    repo = "https://github.com/mostly-ai/mostly-tutorials/raw/dev/smart-imputation"
except:
    repo = "."


# load the original data, with missing values in place
tgt = pd.read_csv(f"{repo}/census-with-missings.csv")
print(
    f"read original data with {tgt.shape[0]:,} records and {tgt.shape[1]} attributes"
)
Let’s take a look at 10 random samples:
# let's show some samples
tgt[["workclass", "education", "marital-status", "age"]].sample(
    n=10, random_state=42
)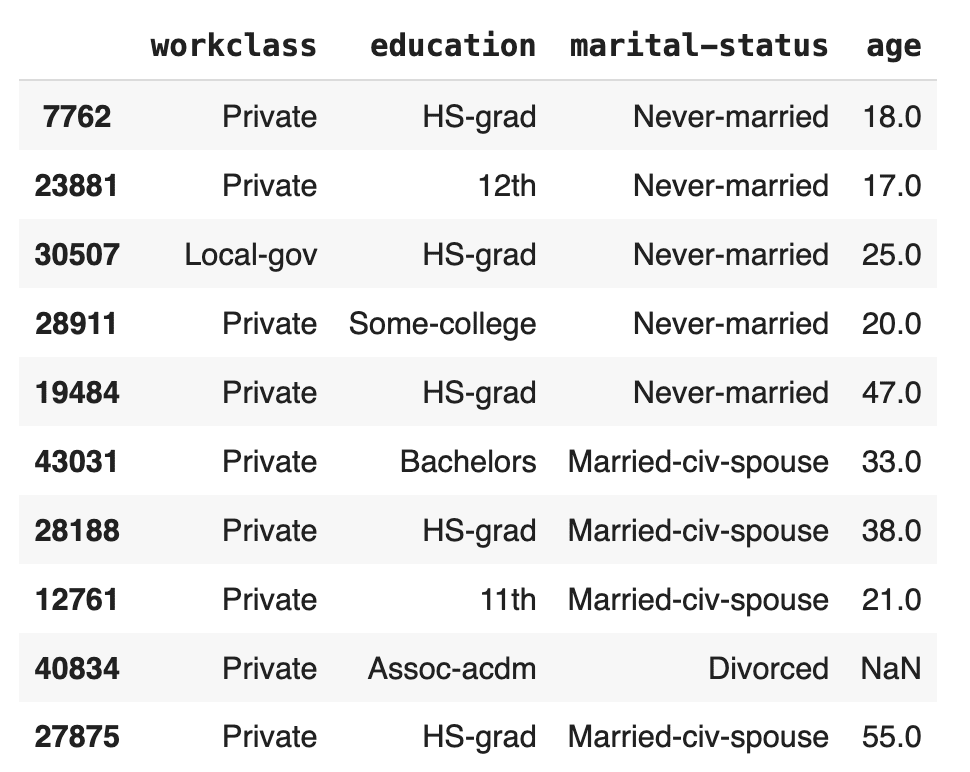
We can already spot 1 missing value in the age column.
Let’s confirm how many missing values we are actually dealing with:
# report share of missing values for column `age`
print(f"{tgt['age'].isna().mean():.1%} of values for column `age` are missing")
32.7% of values for column `age` are missing
Almost one-third of the age column contains missing values. This is a significant amount of relevant data – you would not want to discard these records from your analysis.
Let’s also take a look to see what the distribution of the age column looks like with these missing values.
# plot distribution of column `age`
import matplotlib.pyplot as plt

tgt.age.plot(kind="kde", label="Original Data (with missings)", color="black")
_ = plt.legend(loc="upper right")
_ = plt.title("Age Distribution")
_ = plt.xlim(13, 90)
_ = plt.ylim(0, None)
This might look reasonable but remember that this distribution is showing you only two-thirds of the actual population. If you were to analyze or build machine learning models on this dataset as it is, chances are high that you would be working with a significantly distorted view of the population which would lead to poor analysis results and decisions downstream.
Let’s take a look at how we can use MOSTLY AI’s Smart Imputation method to address the missing values and improve the quality of your analysis.
Synthesize data with smart data imputation
Follow the steps below to download the dataset and synthesize it using MOSTLY AI. For a step-by-step walkthrough, you can also watch the video tutorial.
- Download
census-with-missings.csvby clicking here and pressing either Ctrl+S or Cmd+S to save the file locally. - Synthesize
census-with-missings.csvvia MOSTLY AI. Leave all settings at their default, but activate the Smart Imputation for the age column.
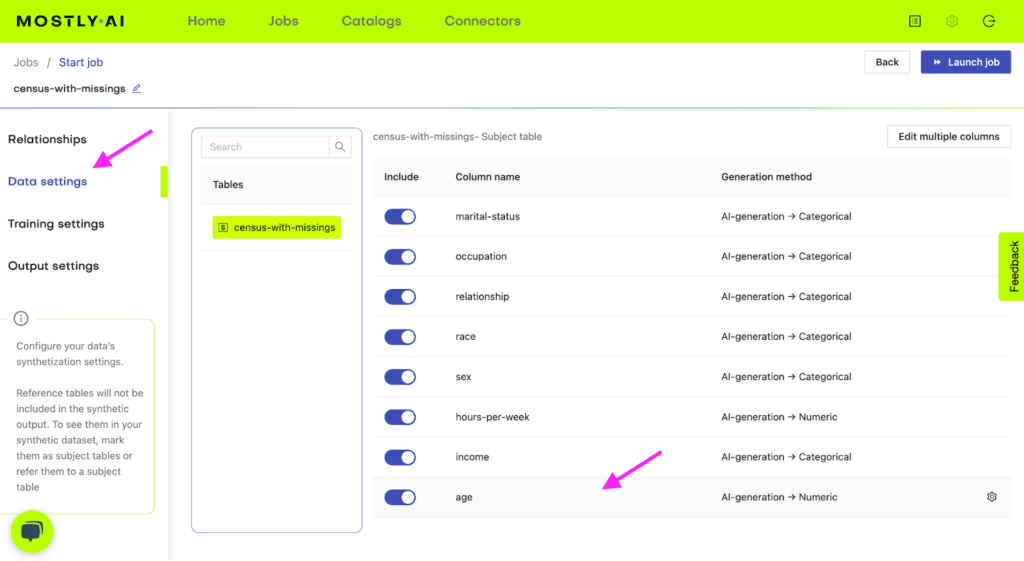
Fig 1 - Navigate to Data Setting and select the age column.
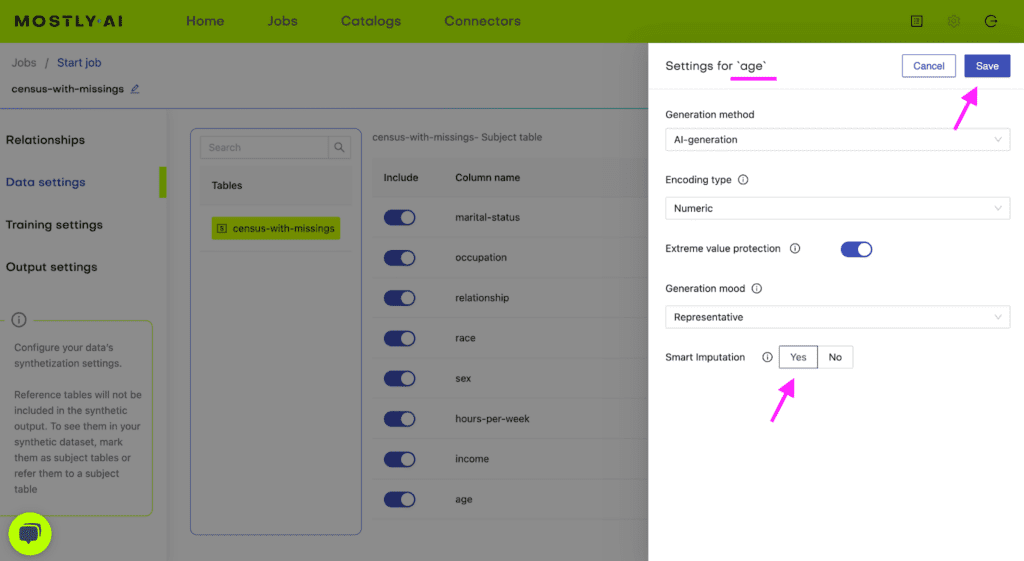
Fig 2 - Enable the Smart Imputation feature for the age column.
- Once the job has finished, download the generated synthetic data as a CSV file to your computer and rename it to
census-synthetic-imputed.csv. Optionally, you can also download a previously synthesized version here.
- Use the following code to upload the synthesized data if you’re running in Google Colab or to access it from disk if you are working locally:
# upload synthetic dataset
import pandas as pd

try:
    # check whether we are in Google colab
    from google.colab import files
    import io

    uploaded = files.upload()
    syn = pd.read_csv(io.BytesIO(list(uploaded.values())[0]))
    print(
        f"uploaded synthetic data with {syn.shape[0]:,} records and {syn.shape[1]:,} attributes"
    )
except:
    syn_file_path = f"{repo}/census-synthetic-imputed.csv"
    print(f"read synthetic data from {syn_file_path}")
    syn = pd.read_csv(syn_file_path)
    print(
        f"read synthetic data with {syn.shape[0]:,} records and {syn.shape[1]:,} attributes"
    )
Now that we’ve had an overall look at the distributions of the underlying model and the generated synthetic data, let’s dive a little deeper into the synthetic data you’ve generated.
Like before, let’s sample 10 random records to see if we can spot any missing values:
# show some synthetic samples
syn[["workclass", "education", "marital-status", "age"]].sample(
    n=10, random_state=42
)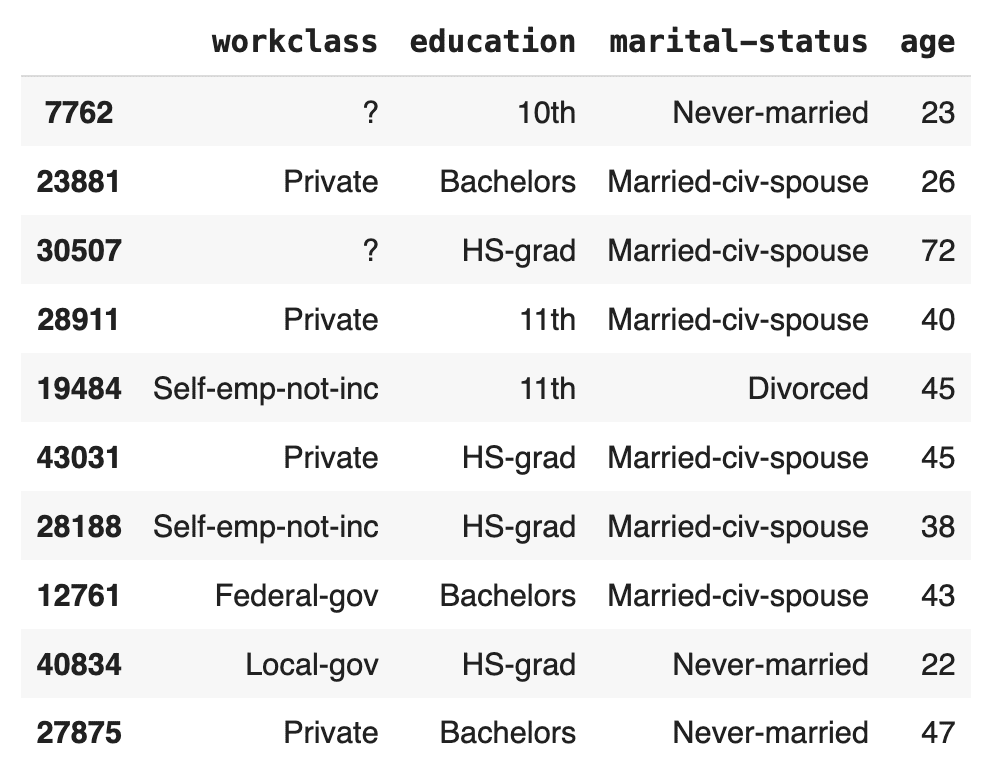
There are no missing values for the age column in this random sample. Let’s verify the percentage of missing values for the entire column:
# report share of missing values for column `age`
print(f"{syn['age'].isna().mean():.1%} of values for column `age` are missing")
0.0% of values for column `age` are missing
We can confirm that all the missing values have been imputed and that we no longer have any missing values for the age column in our dataset.
This is great, but only half of the story. Filling the gaps in our missing data is the easy part: we could do this by simply imputing the mean or the median, for example. It’s filling the gaps in a statistically representative manner that is the challenge.
In the next sections, we will inspect the quality of the generated synthetic data to see how well the Smart Imputation feature performs in terms of imputing values that are statistically representative of the actual population.
Inspecting the synthetic data quality reports
MOSTLY AI provides two Quality Assurance (QA) reports for every synthetic data generation job: a Model QA and a Data QA report. You can access these by clicking on a completed generation job and selecting the Model QA tab.

Fig 3 - Access the QA Reports in your MOSTLY AI account.
The Model QA reports on the accuracy and privacy of the trained Generative AI model. As you can see, the distributions of the training dataset are faithfully learned and also include the right share of missing values:
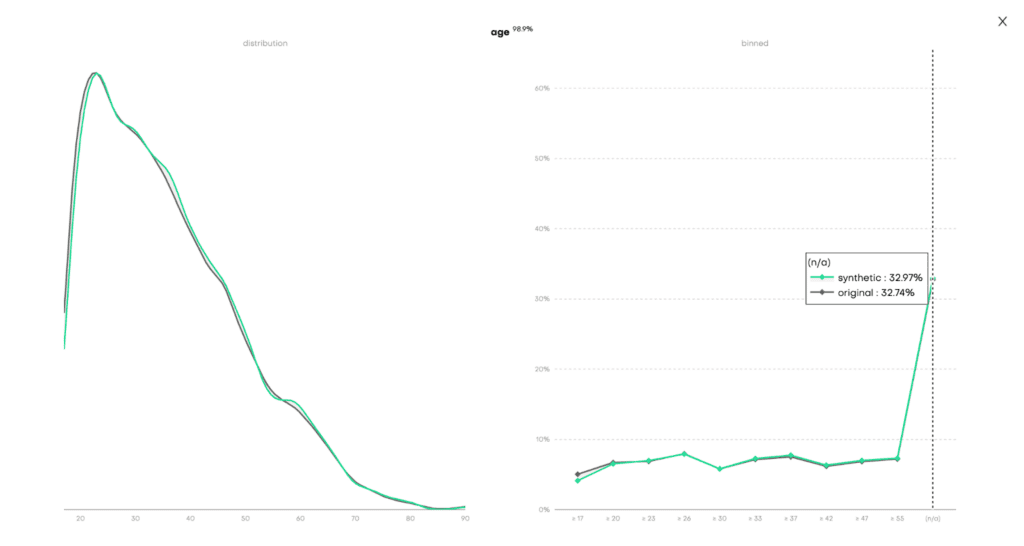
Fig 4 - Model QA report for the univariate distribution of the age column.
The Data QA, on the other hand, visualizes the distributions not of the underlying model but of the outputted synthetic dataset. Since we enabled the Smart Imputation feature, we expect to see no missing values in our generated dataset. Indeed, here we can see that the share of missing values (N/A) has dropped to 0% in the synthetic dataset (vs. 32.74% in the original) and that the distribution has been shifted towards older age buckets:
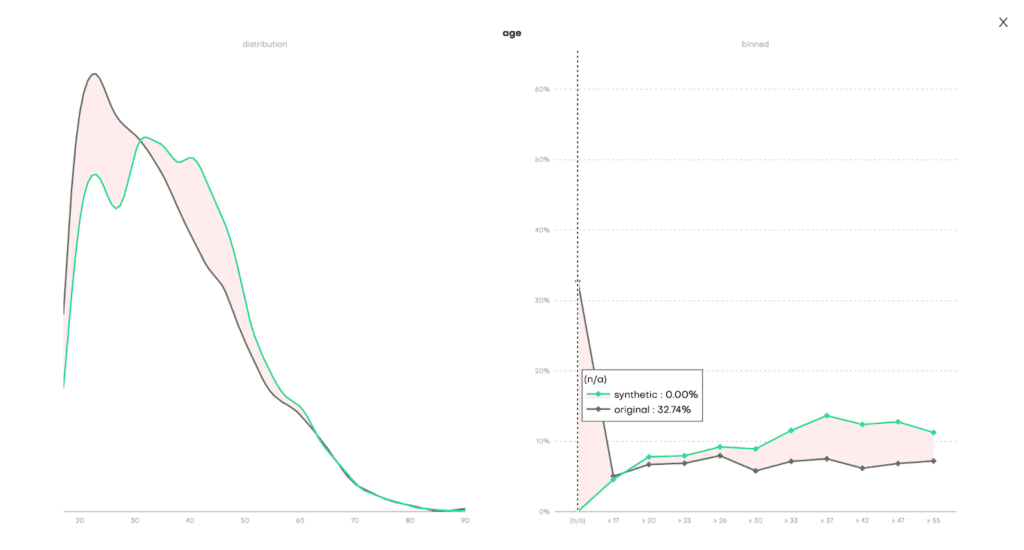
Fig 5 - Data QA report for the univariate distribution of the age column.
The QA reports give us a first indication of the quality of our generated synthetic data. But the ultimate test of our synthetic data quality will be to see how well the synthetic distribution of the age column compares to the actual population: the ground truth UCI Adult Income dataset without any missing values.
Let’s plot side-by-side the distributions of the age column for:
- The original training dataset (incl. ~33% missing values),
- The smartly imputed synthetic dataset, and
- The ground truth dataset (before the values were removed).
Use the code below to create this visualization:
raw = pd.read_csv(f"{repo}/census-ground-truth.csv")


# plot side-by-side
import matplotlib.pyplot as plt

tgt.age.plot(kind="kde", label="Original Data (with missings)", color="black")
raw.age.plot(kind="kde", label="Original Data (ground truth)", color="red")
syn.age.plot(kind="kde", label="Synthetic Data (imputed)", color="green")
_ = plt.title("Age Distribution")
_ = plt.legend(loc="upper right")
_ = plt.xlim(13, 90)
_ = plt.ylim(0, None)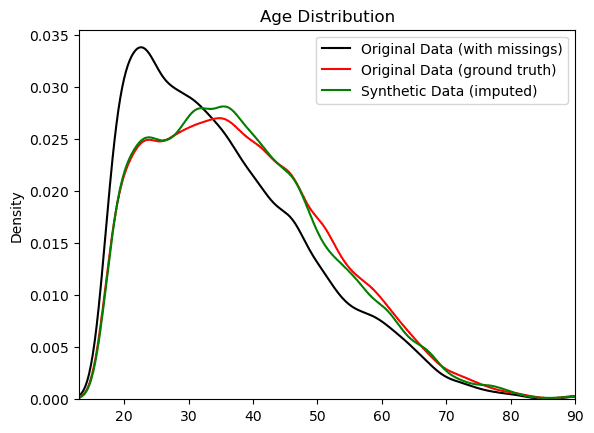
As you can see, the smartly imputed synthetic data is able to recover the original, suppressed distribution of the ground truth dataset. As an analyst, you can now proceed with the exploratory and descriptive analysis as if the values were present in the first place.
Tackling missing data with MOSTLY AI's data imputation feature
In this tutorial, you have learned how to tackle the problem of missing values in your dataset in an efficient and highly accurate way. Using MOSTLY AI’s Smart Imputation feature, you were able to uncover the original distribution of the population. This then allows you to proceed to use your smartly imputed synthetic dataset and analyze and reason about the population with high confidence in the quality of both the data and your conclusions.
If you’re interested in learning more about imputation techniques and how the performance of MOSTLY AI’s Smart Imputation feature compares to other imputation methods, check out our smart data imputation article.
You can also head straight to the other synthetic data tutorials: