
TL;DR We present a reproducible case study on synthesizing large-scale population data to gain granular-level insights without compromising on privacy. Accordingly, MOSTLY AI’s unparalleled accuracy combined with its ease-of-use allows any organization to generate highly realistic synthetic replicas of their own customer base. These allow the privacy-safe utilization of data assets - across teams, across borders, across corporate boundaries. See also here for a slideset version of this blog post.
Intro
The UCI Adult dataset is a widely used resource for machine learning and data analysis. It contains detailed information on over 48,000 individuals, including their age, education, income, and other demographic characteristics. The dataset is often used to test and develop algorithms for predicting income levels based on these various factors. Over the past years it has also become the go-to standard to test-drive, showcase and benchmark synthetic data solutions. And any new user of our highly popular free version is guided through the synthetization of that very same dataset as part of their onboarding tutorial. With just a few clicks, and within less than a minute, a highly realistic, statistically representative, and yet truly novel synthetic replica is being generated [Make sure to give it a try!].
But just as AI advances, we also need to advance the datasets it’s being tested on. For years MNIST, a collection of hand-written digits, served as the go-to dataset to test-drive image recognition algorithms, but by now has become “too easy” of a task. Accordingly, it’s also high time to level up the game for structured data synthesis, and publicly showcase its capabilities on bigger, wider and more complex datasets. This shall allow for a more realistic demonstration of capabilities, as any of the real-word datasets of our customers, is orders of magnitudes richer than the commonly demo-ed “toy datasets”. Thus, let’s use the handy Python package folktables to extract a significantly larger and also more recent version of the UCI Adult dataset directly from the US Census Bureau. For this blog post we pulled records from the 2018 American community survey (ACS) on 1,476,217 working individuals of age 17 or older, together with 4 numerical and 28 categorical attributes.
Synthesize data
No matter whether your dataset is small or large in size, using MOSTLY AI to synthesize it, is always the same easy 3-step process. You first upload or connect to your dataset, you then configure and launch the synthetization, and once the job is completed, you then access and freely use your generated synthetic data. Yes, it's that easy!
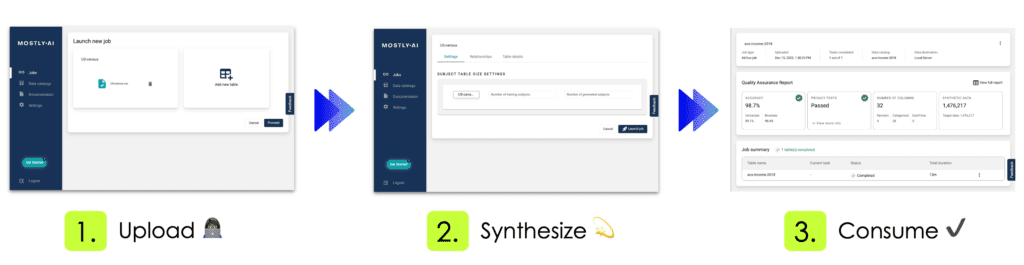
Using our free version, the complete end-to-end process of our introduced dataset takes less than 12 minutes. This includes the fully automated steps of data analysis, data encoding, model training, synthetic data generation as well as the creation of the quality assurance report. The resulting 1,476,217 synthetic records are shown to be statistically representative, highly realistic, truly anonymous, and yet at granular level. These records therefore serve as a safe drop-in alternative to the original data, and allow for any type of data exploration, analysis as well as machine learning task. All without compromising the privacy of any individual.
Explore data
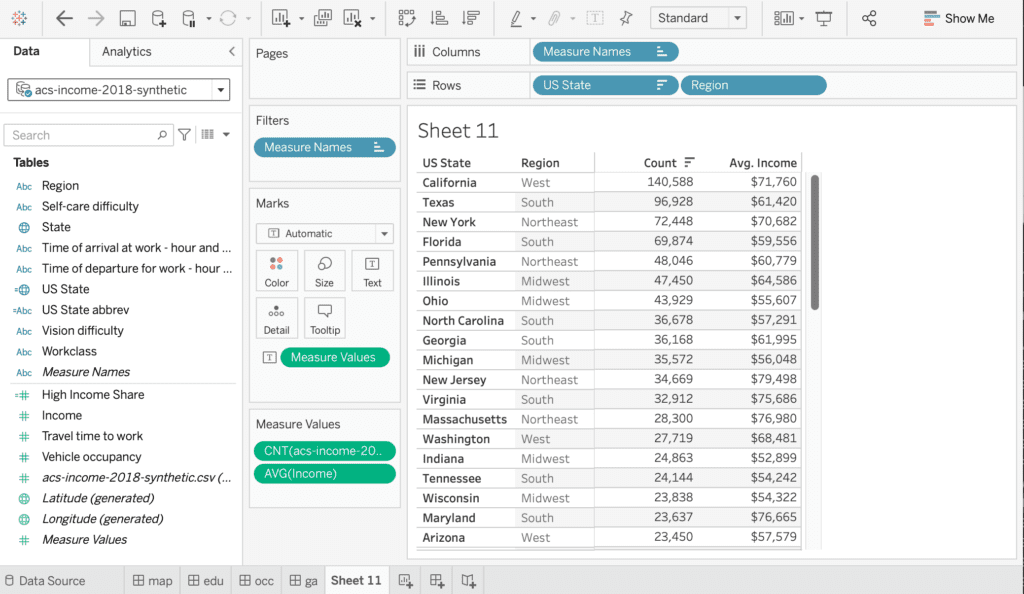
Let’s start out by analyzing MOSTLY AI’s generated synthetic data with Tableau, a popular data visualization platform. Note, that deriving statistical insights should not be understood as an exercise in reporting metrics with excess precision. Deriving statistical insights is much rather the art and science of exploring and spotting relationships and trends within the data, that were previously unknown. And this ability, to explore data in any way needed, is the major benefit of synthetic data when compared to any other privacy-enhancing technology. As a data consumer one is NOT restricted to pre-selected subsets of data attributes, to pre-defined numeric buckets, or to pre-calculated data aggregates, that all severely limit the scope of an analysis. As a data consumer one can freely combine, transform and tabulate any dimension and any measure.
One of the 32 captured attributes within the dataset is information about the surveyed state, representing geographical information, that can be nicely visualized on a map. Figure 3 shows the share of respondents, with an annual income of $50,000 or more, displayed as a choropleth map. The darker the color, the higher the share of high income earners. And one can immediately see, side-by-side, that the very same patterns emerge. States on the west, respectively on the north east coast exhibit significantly higher incomes than other states.
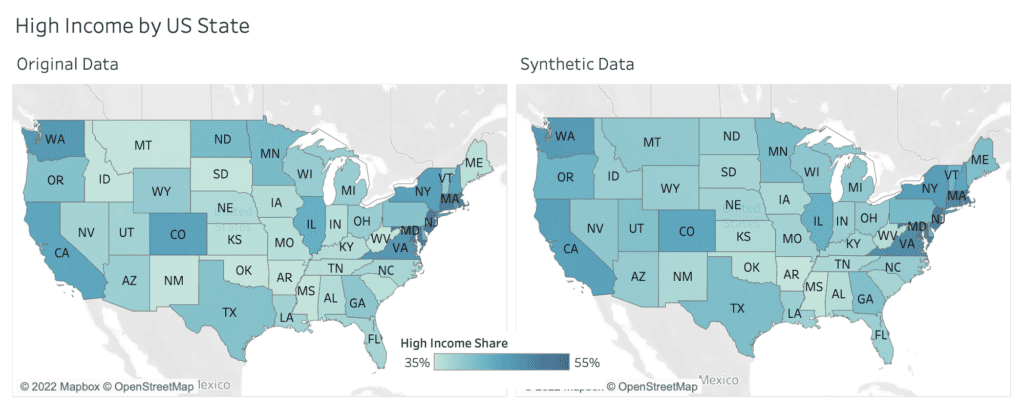
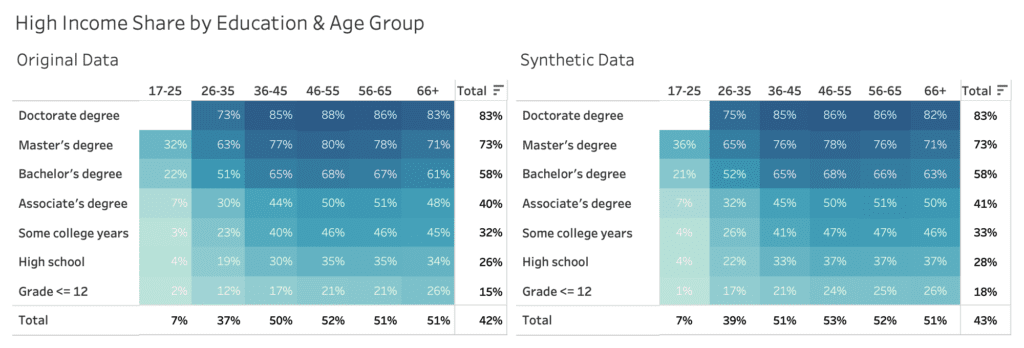
Figure 4 exhibits the share of high income earners across education level and age group, and displays similarly strong, yet consistent patterns. The higher the educational level, the higher the likelihood to earn more than $50k per year. And in addition, there is a significant difference between people below 25 years, people between 26 and 35 years, as well as people of 36 years of age and older.
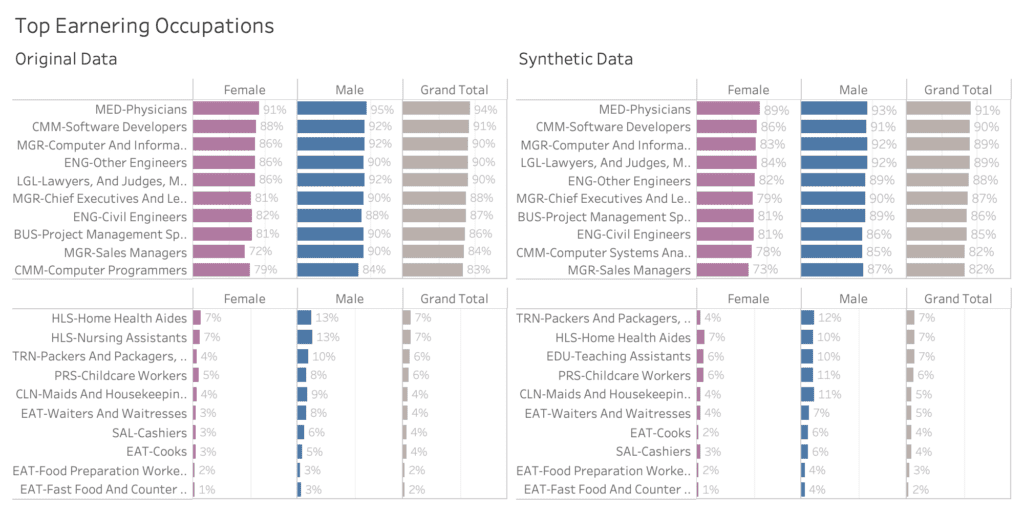
Let’s next explore income across genders, and across occupation, which is an attribute consisting of over 500 (!) distinct values. Most other synthesization solutions struggle with capturing the signals for high cardinality features like these. Figure 5 shows side-by-side the large income gap across occupation, discriminating between high income jobs like physicians and software developers on the one end of the spectrum, and cashiers and fast food workers on the other end. Plus, it also shows a consistent gender pay gap across all occupation. Thus, the analysis shows that men are consistently more likely to earn a high income than women, even when controlling for the type of occupation. Synthetic data can play a pivotal role in uncovering such types of systematic injustices, that are currently locked up due to the private nature of the underlying datasets.
The complete analytical workbook, and each of the presented interactive visualizations, can be accessed through this link hosted on Tableau Public.
Build models
Visual analytics, as shown in the previous section, is an excellent and essential mean to quickly gain a deeper understanding of a dataset and its inherent patterns. However, at the same time it also requires some level of caution, in order to avoid misinterpreting spurious relations by overlooking confounding factors. Machine learning models, that are trained to predict a specific target attribute of interest based on a wide range of other variables, help to mitigate this problem. These models can account for the combined effect of attributes, and with that can report the net impact of individual attributes.
Let’s therefore train a state-of-the-art ML model on top of the synthetic data 1) to benchmark its overall predictive performance with respect to real data, and 2) to identify the key drivers, and their net effect on the attribute of interest, in our case the likelihood of a respondent earning a high income salary. The model of our choice is LightGBM, a gradient boosting machine learning algorithm, that is fast to train and evaluate, even for larger datasets. In our case, training the model on over 1 million records for 31 attributes to predict high income takes less than 1 minute on a commodity laptop.
In order to assess the model’s predictive accuracy on a true holdout dataset, we need to split the original dataset into a training and a holdout set. We randomly assign 80% of the original records to the former, and the remaining 20% to the latter. The synthetic dataset is generated based on the 80% training set. The LightGBM model is then trained on the synthetic data, and finally evaluated on the 20% holdout data, that wasn’t being accessed before. Similarly, the same model is being trained on the original training data, and evaluated on the same holdout as well. This serves us as a very strong benchmark for the ML performance of synthetic data. See figure 6 for a schematic representation of the setup. The holdout, the training as well as a synthetic dataset can be accessed via our Github repository for popular public datasets. There you will also find a corresponding Jupyter notebook that, in combination with our free version, allows anyone to easily reproduce all results from this blog post.
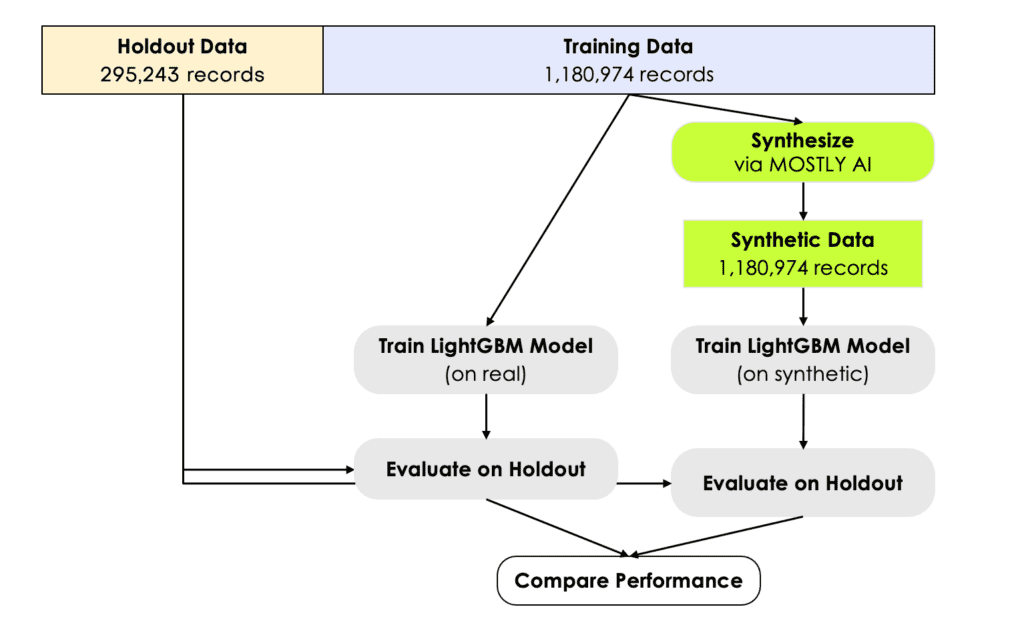
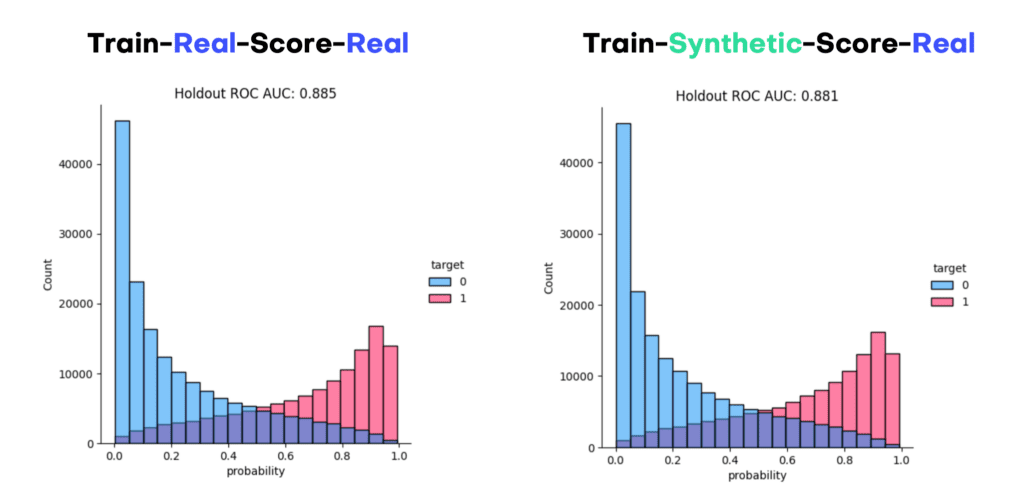
Figure 7 visualizes the distribution of the predicted scores for each of the models, split by income group. We can see that the model can discriminate well between these two groups, and assigns higher probabilities to high income earners, and vice versa. This can be also quantified via the ROC Area-Under-Curve measure, which reflects the probability of the model to correctly recognize the high income earner among a pair of two subjects. We can see that training a state-of-the-art ML model on synthetic data yields identical results, both in terms of scores as well as accuracy. The model trained on synthetic data, with an AUC of 0.881, is on-par with the model trained on real data (AUC: 0.885). This is a particularly strong and robust result, considering that we’ve used nearly 300,000 holdout records for the evaluation.
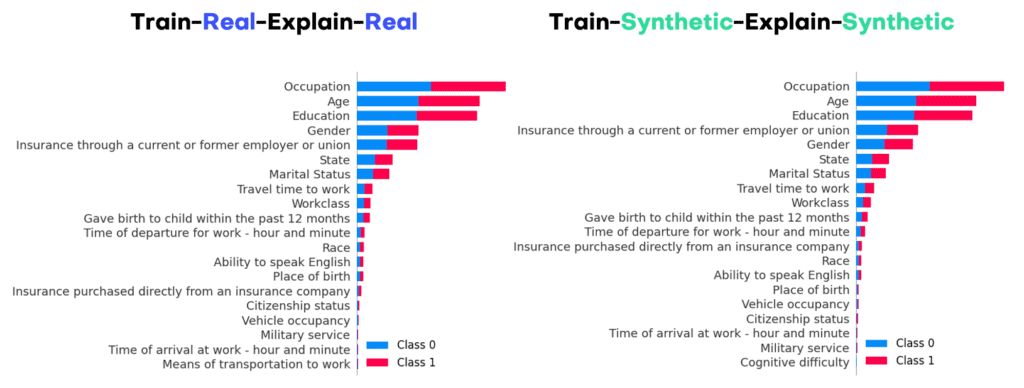
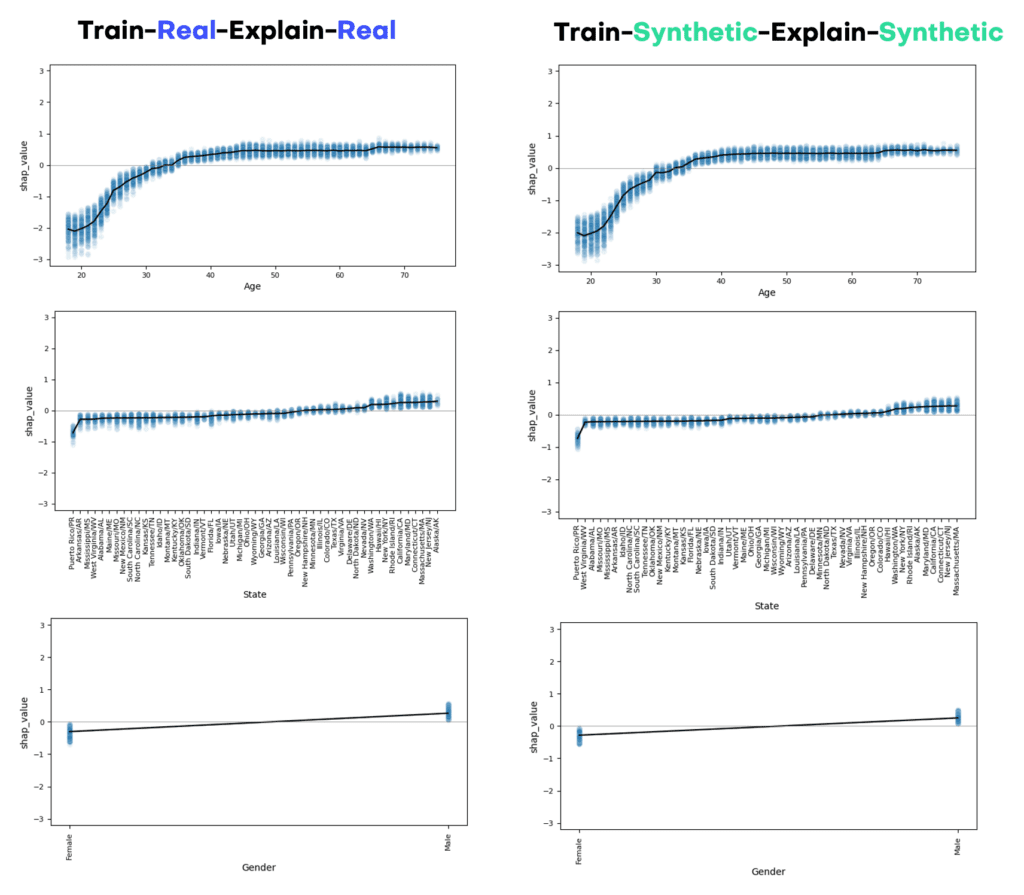
In order to explore the trained models further, we turn towards SHAP, a highly popular framework to explain ML models. Below we show the SHAP summary plot side-by-side, which already reveals the key attributes for predicting income. As one can see, occupation, age, and education are the top 3 drivers that allow to determine whether a person earns a high income or not. After that it is the information on insurance, gender, state and marital status. Further features contribute less to the model predictions. And note again, that these findings are identical for real and for synthetic data, with the key advantage that none of the private information is getting exposed while using the latter.
Aside from the overall impact of an attribute with respect to the predicted target, it is of great interest to study the value-dependent net effect of each of those attributes in details. These can be visualized via SHAP dependency plots, and show for each attribute the shift in predictions given their attribute value. Figure 9 displays the corresponding plots for age, state as well as gender. The x-axes show attribute values, and the y-axes the shift in predicted score. Thus, it is for example very unlikely for a young person below 25 years to be in the high income class, no matter what occupation, education or other features that person has. But once a person has reached 40 years, any further age increase does not change his or her likelihood to earn more. On the other hand, we can also see that, all other things being equal, male respondents are significantly more likely to earn a high income than their female counterparts. I.e., even for the same job, the same location, the same age, the same education, etc., women systematically earn less than men.
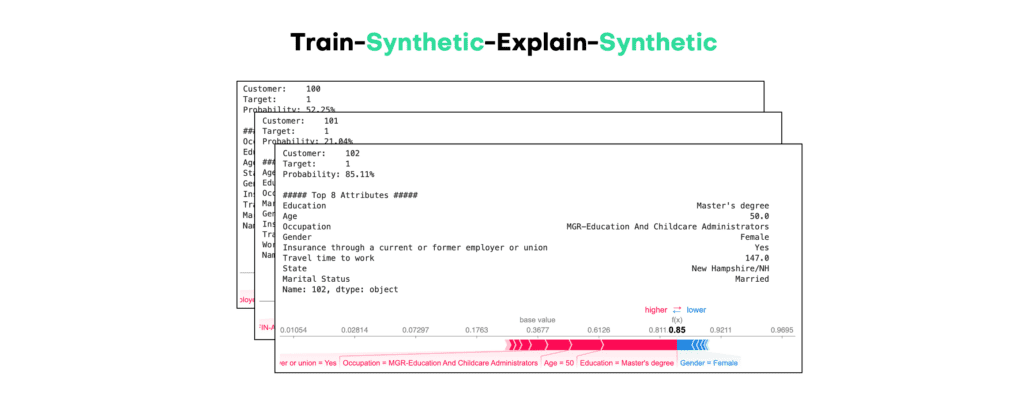
The power (and beauty) of synthetic data is the ability to drill down to granular level at any time. So, even though the generated subjects do not exist in real life, but “merely” are statistically representative, they do allow to reason about machine learning models by studying their impact on individual samples. This is a key enabler for involving a broader community of stakeholders (within and across organizations) in a much needed debate on machine learning models. Everyone - engineers, designers, lawyers, managers, customers all alike - is capable to argue a case based on representative samples. Yet, without access to samples, any discussion remains abstract. Figure 10 shows the SHAP values for our predictive income model, that has been trained on synthetic data, then evaluated and explained on synthetic, yet realistic samples. The randomly sampled case is for a 50-year old married woman from New Hampshire, who has a Master’s Degree and works in Education. The model assesses her to have an annual income of more than $50k with 85% likelihood, with her combination of education, occupation and age contribute the most for this assessment. The same type of analysis can be easily done not just for one sample, but for any of the millions of generated synthetic samples, and thus allows to test in detail the behavior as well as the robustness of the developed model, without exposing the privacy of any individuals.
Summary
It’s the dawn of a new era. Generative AI is being recognized for its immense power to inform us all, humans and algorithms alike. And high-quality structured synthetic data, as delivered by MOSTLY AI, is key to overcome the privacy hurdles of data access. It’s key to help us see and understand the world as it is, as well as it could be.
In this blog post we’ve provided a new, publicly reproducible benchmark for state-of-the-art structured synthetic data at scale. We’ve shown how MOSTLY AI allows to easily synthesize large-scale population data, and how the generated data reliably yields identical statistical insights without compromising on privacy. It’s this level of accuracy, its reliability, and last but not least its ease of use, that makes MOSTLY AI stand out on the market. But don’t take our word for it. Go ahead, and start generating synthetic data today!