
Synthetic data holds the promise of addressing the underrepresentation of minority classes in tabular data sets by adding new, diverse, and highly realistic synthetic samples. In this post, we'll benchmark AI-generated synthetic data for upsampling highly unbalanced tabular data sets. Specifically, we compare the performance of predictive models trained on data sets upsampled with synthetic records to that of well-known upsampling methods, such as naive oversampling or SMOTE-NC.
Our experiments are conducted on multiple data sets and different predictive models. We demonstrate that synthetic data can improve predictive accuracy for minority groups as it creates diverse data points that fill gaps in sparse regions in feature space.
Our results highlight the potential of synthetic data upsampling as a viable method for improving predictive accuracy on highly unbalanced data sets. We show that upsampled synthetic training data consistently results in top-performing predictive models, in particular for mixed-type data sets containing a very low number of minority samples, where it outperforms all other upsampling techniques.
Try upsampling on MOSTLY AI's synthetic data platform!
The definition of synthetic data
AI-generated synthetic data, which we refer to as synthetic data throughout, is created by training a generative model on the original data set. In the inference phase, the generative model creates statistically representative, synthetic records from scratch.
The use of synthetic data has gained increasing importance in various industries, particularly due to its primary use case of enhancing data privacy. Beyond privacy, synthetic data offers the possibility to modify and tailor data sets to our specific needs. In this blog post, we investigate the potential of synthetic data to improve the performance of machine learning algorithms on data sets with unbalanced class distributions, specifically through the synthetic upsampling of minority classes.
Upsampling for class imbalance
Class imbalance is a common problem in many real-world tabular data sets where the number of samples in one or more classes is significantly lower than the others. Such imbalances can lead to poor prediction performance for the minority classes, often of greatest interest in many applications, such as detecting fraud or extreme insurance claims.
Traditional upsampling methods, such as naive oversampling or SMOTE, have shown some success in mitigating this issue. However, the effectiveness of these methods is often limited, and they may introduce biases in the data, leading to poor model performance. In recent years, synthetic data has emerged as a promising alternative to traditional upsampling methods. By creating highly realistic samples for minority classes, synthetic data can significantly improve the accuracy of predictive models.
While upsampling methods like naive oversampling and SMOTE are effective in addressing unbalanced data sets, they also have their limitations. Naive oversampling mitigates class imbalance effects by simply duplicating minority class examples. Due to this strategy, they bear the risk of overfitting the model to the training data, resulting in poor generalization in the inference phase.
SMOTE, on the other hand, generates new records by interpolating between existing minority-class samples, leading to higher diversity. However, SMOTE’s ability to increase diversity is limited when the absolute number of minority records is very low. This is especially true when generating samples for mixed-type data sets containing categorical columns. For mixed-type data sets, SMOTE-NC is commonly used as an extension for handling categorical columns.
SMOTE-NC may not work well with non-linear decision boundaries, as it only linearly interpolates between minority records. This can lead to SMOTE-NC examples being generated in an “unfavorable” region of feature space, far from where additional samples would help the predictive model place a decision boundary.
All these limitations highlight the need for exploring alternative upsampling methods, such as synthetic data upsampling, that can overcome these challenges and improve the accuracy of minority group predictions.
The strength of upsampling minority classes with AI-generated synthetic data is that the generative model is not limited to upsampling or interpolating between existing minority classes. Most AI-based generators can create realistic synthetic data examples in any region of feature space and, thus, considerably increase diversity. Because they are not tied to existing minority samples, AI-based generators can also leverage and learn from the properties of (parts of) the majority samples that are transferable to minority examples.
An additional strength of using AI-based upsampling is that it can be easily extended to more complex data structures, such as sequential data, where not only one but many rows in a data set belong to a single data subject. This aspect of synthetic data upsampling is, however, out of the scope of this study.
In this post, we present a comprehensive benchmark study comparing the performance of predictive models trained on unbalanced data upsampled with AI-generated synthetic data, naive upsampling, and SMOTE-NC upsampling. Our experiments are carried out on various data sets and using different predictive models.
The upsampling experiment
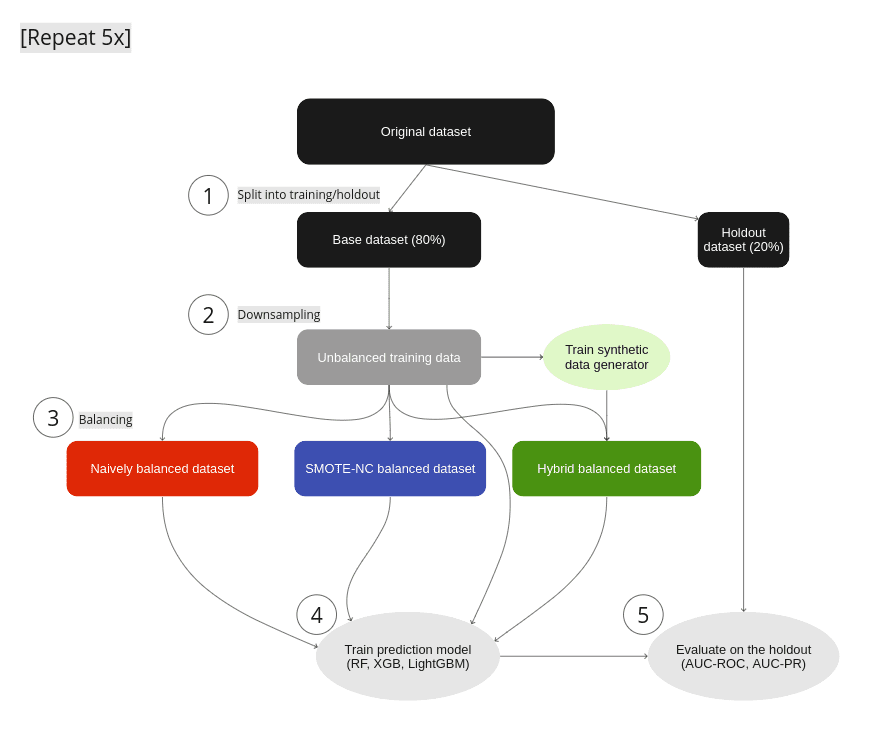
Figure 1: Experimental Setup: (1) We split the original data set into a base data set and a holdout. (2) Strong imbalances are introduced in the base data set by downsampling the minority classes to fractions as low as 0.05% to yield the unbalanced training data. (3) We test different mitigation strategies: balancing through naive upsampling, SMOTE-NC upsampling, and upsampling with AI-generated synthetic records (the hybrid data set). (4) We train LGBM, RandomForest, and XGB classifiers on the balanced and unbalanced training data. (5) We evaluate the properties of the upsampling techniques by measuring the performance of the trained classifier on the holdout set. Steps 1–5 are repeated five times, and we report the mean AUC-ROC as well as the AUC-PR.
For every data set we use in our experiments, we run through the following steps (see Fig. 1):
- We split the original data set into a base and a holdout set by using a five-fold stratified sampling approach to ensure that each class is represented proportionally.
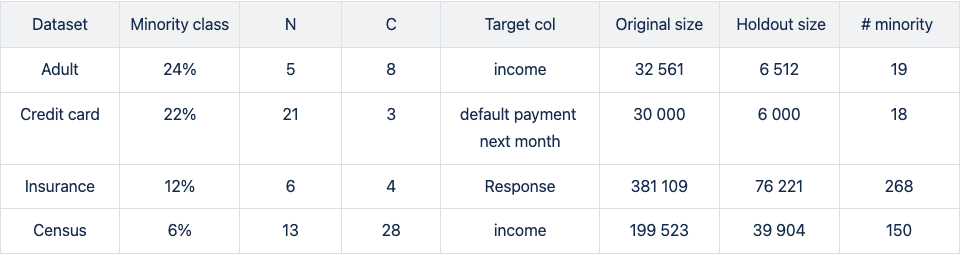
- All of the original data sets have a binary target column and only a rather moderate imbalance with the fraction of the minority class ranging from 6% to 24% (see table 1 for data set details). We artificially induce different levels of strong imbalances to the base set by randomly down-sampling the minority class, resulting in unbalanced training data sets with minority fractions of 0.05%, 0.1%, 0.2%, 0.5%, 1%, 2%, and 5%.
- To mitigate the strong imbalances in the training data sets, we apply three different upsampling techniques:
- naive oversampling (red box in fig. 1) duplicating existing examples of the minority classes (scikit-learn, RandomOverSampler)
- SMOTE-NC (blue box in fig. 1): applying the SMOTE-NC upsampling technique (scikit-learn, SMOTENC)
- Hybrid (green box in fig. 1): The hybrid data set represents the concept of enriching unbalanced training data with AI-generated synthetic data. It is composed of the training data (including majority samples and a limited number of minority samples) along with additional synthetic minority samples that are created using an AI-based synthetic data generator. This generator is trained on the highly unbalanced training data set. In this study, we use the MOSTLY AI synthetic data platform. It is freely accessible for generating highly realistic AI-based synthetic data.
In all cases, we upsample the minority class to achieve a 50:50 balance between the majority and minority classes, resulting in the naively balanced, the SMOTE-NC balanced, and the balanced hybrid data set.
- We assess the benefits of the different upsampling techniques by training three popular classifiers: RandomForest, XGB, and LightGBM, on the balanced data sets. Additionally, we train the classifiers on the heavily unbalanced training data sets as a baseline in the evaluation of the predictive model performance.
- The classifiers are scored on the holdout set, and we calculate the AUC-ROC score and AUC-PR score across all upsampling techniques and initial imbalance ratios for all 5 folds. We report the average scores over five different samplings and model predictions. We opt for AUC metrics to eliminate dependencies on thresholds, as seen in, e.g., F1 scores.
The results of upsampling
We run four publicly available data sets (Figure 1) of varying sizes through steps 1–5: Adult, Credit Card, Insurance, and Census (Kohavi and Becker). All data sets tested are of mixed type (categorical and numerical features) with a binary, that is, a categorical target column.
In step 2 (Fig. 1), we downsample minority classes to induce strong imbalances. For the smaller data sets with ~30k records, downsampling to minority-class fractions of 0.1% results in extremely low numbers of minority records.
The downsampled Adult and Credit Card unbalanced training data sets contain as little as 19 and 18 minority records, respectively. This scenario mimics situations where data is limited and extreme cases occur rarely. Such setups create significant challenges for predictive models, as they may encounter difficulty making accurate predictions and generalizing well on unseen data.
Please note that the holdout sets on which the trained predictive models are scored are not subject to extreme imbalances as they are sampled from the original data before downsampling is applied. The imbalance ratios of the holdout set are moderate and vary from 6 to 24%.
In the evaluation, we report both the AUC-ROC and the AUC-PR due to the moderate but inhomogeneous distribution of minority fractions in the holdout set. The AUC-ROC is a very popular and expressive metric, but it is known to be overly optimistic on unbalanced optimization problems. While the AUC-ROC considers both classes, making it susceptible to neglecting the minority class, the AUC-PR focuses on the minority class as it is built up by precision and recall.
Upsampling the Adult income dataset
The largest differences between upsampling techniques are observed in the AUC-ROC when balancing training sets with a substantial class imbalance of 0.05% to 0.5%. This scenario involves a very limited number of minority samples, down to 19 for the Adult unbalanced training data set.
For the RF and the LGBM classifiers trained on the balanced hybrid data set, the AUC-ROC is larger than the ones obtained with other upsampling techniques. Differences can go up to 0.2 (RF classifier, minority fraction of 0.05%) between the AI-based synthetic upsampling and the second-best method.
The AUC-PR shows similar yet less pronounced differences. LGBM and XGB classifiers trained on the balanced hybrid data set perform best throughout almost all minority fractions. Interestingly, results for the RF classifier are mixed. Upsampling with synthetic data does not always lead to better performance, but it is always among the best-performing methods.
While synthetic data upsampling improves results through most of the minority fractions for the XGB classifier, too, the differences in performance are less pronounced. Especially the XGB classifier trained on the highly unbalanced training data performs surprisingly well. This suggests that the XGB classifier is better suited for handling unbalanced data.
The reason for the performance differences in the AUC-ROC and AUC-PR is due to the low diversity and, consequently, overfitting when using naive or SMOTE-NC upsampling. These effects are visible in, e.g., the ROC and PR curves of the LGBM classifier for a minority fraction of 0.1% (fig. 3).
Every point on these curves corresponds to a specific prediction threshold for the classifier. The set of threshold values is defined by the variance of probabilities predicted by the models when scored on the holdout set. For both the highly unbalanced training data and the naively upsampled one, we observe very low diversity, with more than 80% of the holdout samples predicted to have an identical, very low probability of belonging to the minority class.
In the plot of the PR curve, this leads to an accumulation of points in the area with high precision and low recall, which means that the model is very conservative in making positive predictions and only makes a positive prediction when it is very confident that the data point belongs to the positive, that is, the minority class. This demonstrates the effect of overfitting on a few samples in the minority group.
SMOTE-NC has a much higher but still limited diversity, resulting in a smoother PR curve which, however, still contains discontinuities and has a large segment where precision and recall change rapidly with small changes in the prediction threshold.
The hybrid data set offers high diversity during model training, resulting in almost every holdout sample being assigned an unique probability of belonging to the minority class. Both ROC and PR curves are smooth and have a threshold of ~0.5 at the center, the point that is closest to the perfect classifier.
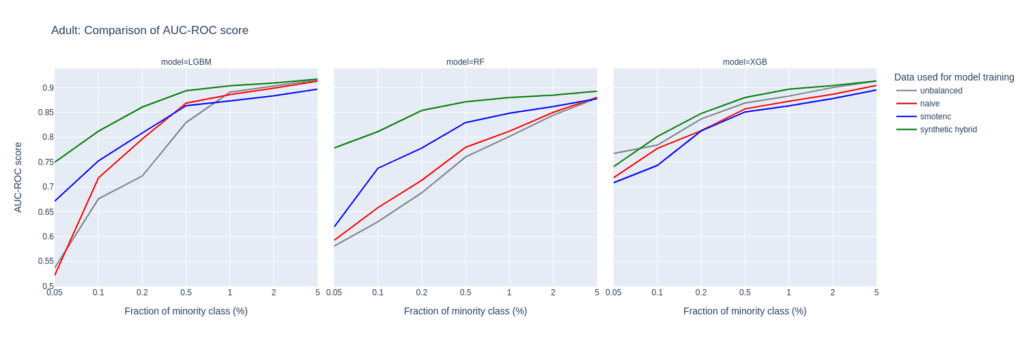
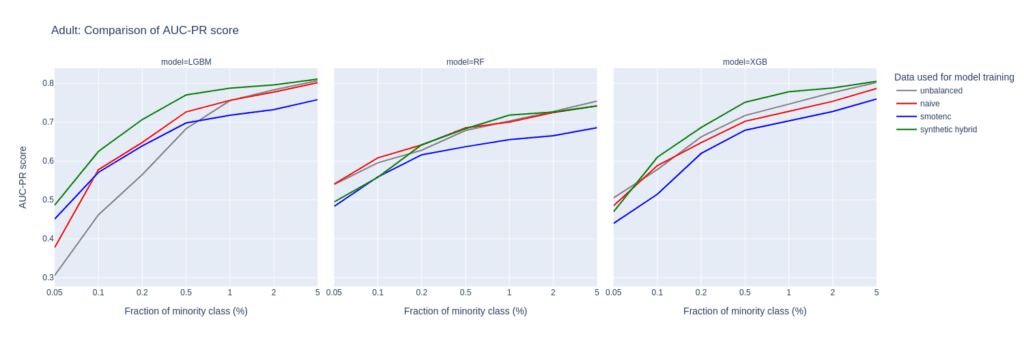
Figure 2: AUC-ROC (top) and AUC-PR (bottom) of classifiers LGBM, RandomForest (RF), and XGB trained on the Adult data set to predict the target feature income. The classifiers are trained on unbalanced data sets (grey) and data sets that are upsampled naively (red), with the SMOTE-NC algorithm (blue), and with AI-generated synthetic records (green). AUC values are reported for different fractions of the minority class in the unbalanced training data (x-axis).
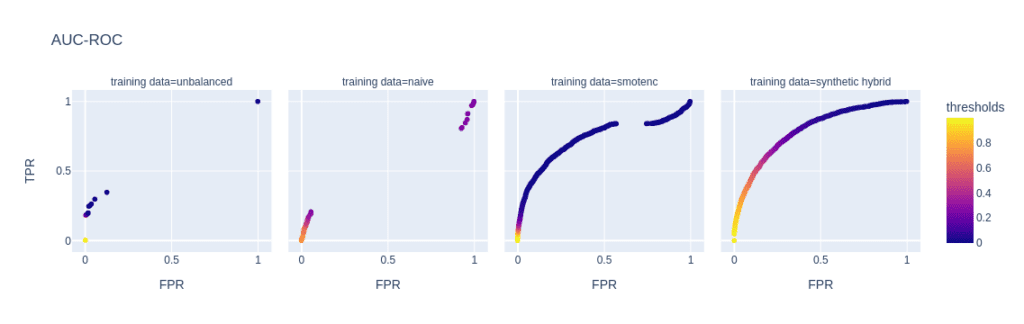
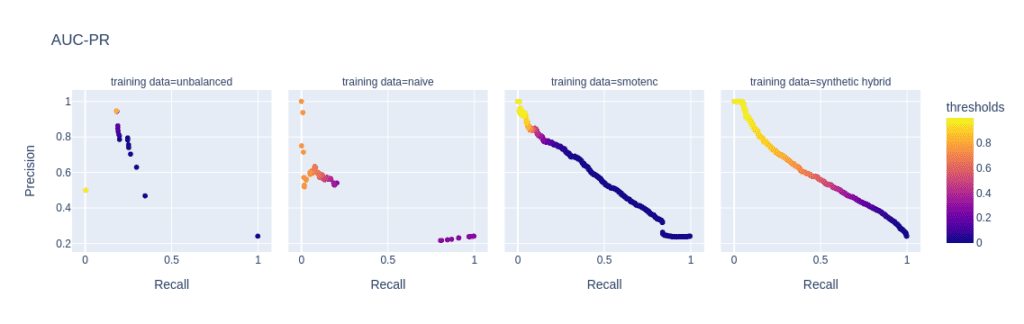
Figure 3: ROC (top) and PR (bottom) curves of the Light GBM classifier trained on different versions of the adult data set (from left to right): unbalanced training data (minority class fraction 0.1%), naively upsampled training data, training data upsampled with SMOTE-NC, and training data enriched with AI-generated synthetic records (synthetic hybrid). Every point on the plots corresponds to a specific prediction threshold for the classifier.
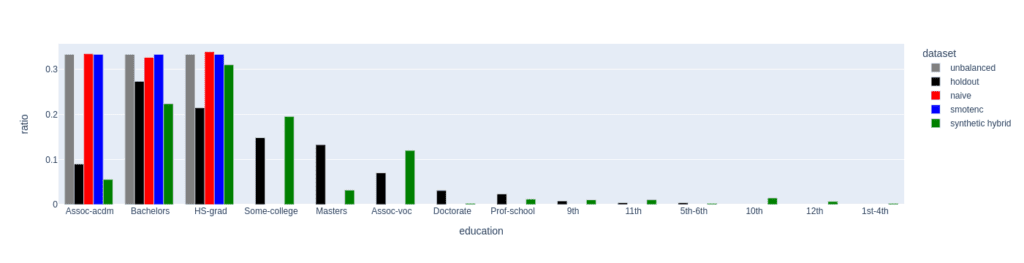
Figure 4: Distribution of the feature education for the female subgroup (sex equals female) of the minority class (income equals high). The distributions of the unbalanced (grey, minority class fraction of 0.1%), the naively upsampled (red), and the SMOTE-NC upsampled (blue) considerably differ from the holdout distribution. Only the data set upsampled with AI-generated synthetic records (synthetic hybrid) recovers the holdout distribution to a satisfactory degree and captures its diversity.
The limited power in creating diverse samples in situations where the minority class is severely underrepresented stems from naive upsampling and SMOTE-NC being limited to duplicating and interpolating between existing minority samples. Both methods are bound to a limited region in feature space.
Upsampling with AI-based synthetic minority samples, on the other hand, can, in principle, populate any region in feature space and can leverage and learn from properties of the majority samples which are transferable to minority examples, resulting in more diverse and realistic synthetic minority samples.
We analyze the difference in diversity by further “drilling down” the minority class (feature “income” equals “high”) and comparing the distribution of the feature “education” for the female subgroup (feature “sex” equals “female”) in the upsampled data sets (fig. 4).
For a minority fraction of 0.1%, this results in only three female minority records. Naive upsampling and SMOTE-NC have a very hard time generating diversity in such settings. Both just duplicate the existing categories “Bachelors”, “HS-grade”, and "Assoc-acdm,” resulting in a strong distortion of the distribution of the “education” feature as compared to the distribution in the holdout data set.
The distribution of the hybrid data has some imperfections, too, but it recovers the holdout distribution to a much better degree. Many more “education” categories are populated, and, with a few exceptions, the frequencies of the holdout data set are recovered to a satisfactory level. This ultimately leads to a larger diversity in the hybrid data set than in the naively balanced or SMOTE-NC balanced one.
Diversity assessment with the Shannon entropy
We quantitatively assess diversity with the Shannon entropy, which measures the variability within a data set particularly for categorical data. It provides a measure of how uniformly the different categories of a specific feature are distributed within the data set.
The Shannon Entropy (SE) of a specific feature is defined as
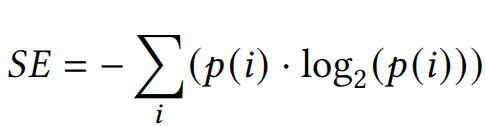
where p(i) represents the probability of occurrence, i.e. the relative frequency of category i. SE ranges from 0 to log2(N), where N is the total number of categories. A value of 0 indicates maximum certainty with only one category, while higher entropy implies greater diversity and uncertainty, indicating comparable probabilities p(i) across categories.
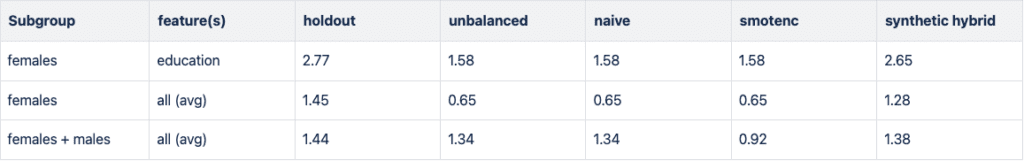
In Figure 5, we report the Shannon entropy for different features and subgroups of the high-income population. In all cases, data diversity is the largest for the holdout data set. The downsampled training data set (unbalanced) has a strongly reduced SE, especially when focusing on the small group of high-income women. Naive and SMOTE-NC upsampling cannot recover any of the diversity in the holdout as both are limited to the categories present in the minority class. In line with the results presented in the paragraph above, synthetic data recovers the SE, i.e., the diversity of the holdout data set, to a large degree.
Upsampling the Credit Card data set
The Credit Card data set has similar properties as the Adult data set. The number of records, features, and the original, moderate imbalance are comparable. This again results in a very small number of minority records (18) after downsampling to a 0.1% minority fraction.
The main difference between them is the fact that Credit Card consists of more numeric features. The performance of different upsampling techniques on the unbalanced Credit Card training data set shows similar results to the Adult Data set, too. AUC-ROC and AUC-PR for both LGBM and RF classifiers improve over naive upsampling and SMOTE-NC when using the hybrid data set.
Again, the performance of the XGB model is more comparable between the different balanced data sets and we find very good performance for the highly-unbalanced training data set. Here, too, the hybrid data set is always among the best-performing upsampling techniques.
Interestingly, SMOTE-NC performs worst almost throughout all the metrics. This is surprising because we expect this data set, consisting mainly of numerical features, to be favorable for the SMOTE-NC upsampling technique.
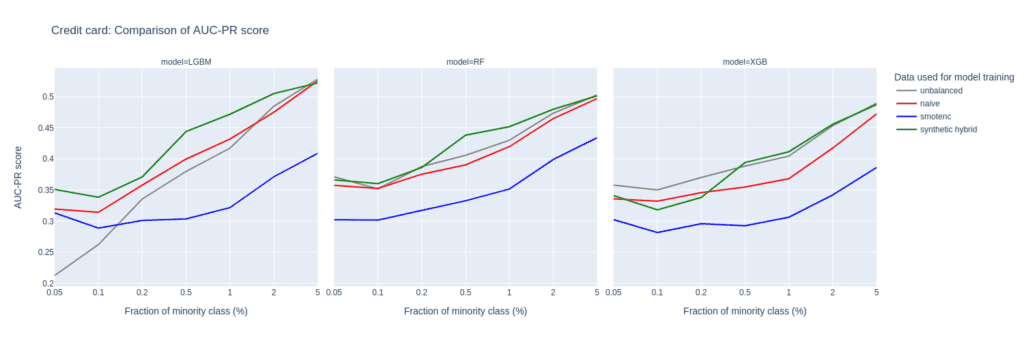
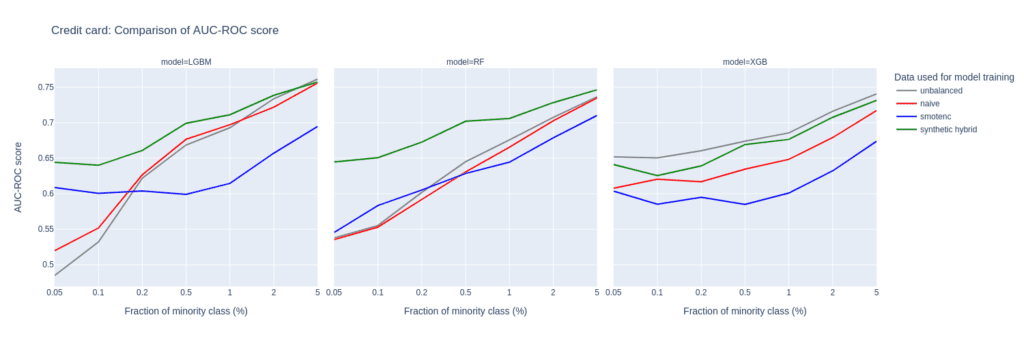
Figure 6: AUC-ROC (top) and AUC-PR (bottom) of classifiers LGBM, RandomForest (RF), and XGB trained on the Credit Card data set to predict the target feature default payment. The classifiers are trained on unbalanced data sets (grey) and data sets that are upsampled naively (red), with the SMOTE-NC algorithm (blue), and with AI-generated synthetic records (green). AUC values are reported for different fractions of the minority class in the unbalanced training data (x-axis).
Upsampling the Insurance data set
The Insurance data set is larger than Adult and Census resulting in a larger number of minority records (268) when downsampling to the 0.1% minority fraction. This leads to a much more balanced performance between different upsampling techniques.
A notable difference in performance only appears for very small minority fractions. For minority fractions below 0.5%, both the AUC-ROC and AUC-PR of LGBM and XGB classifiers trained on the hybrid data set are consistently larger than for classifiers trained on other balanced data sets. The maximum performance gains, however, are smaller than those observed for “Adult” and “Credit Card”.
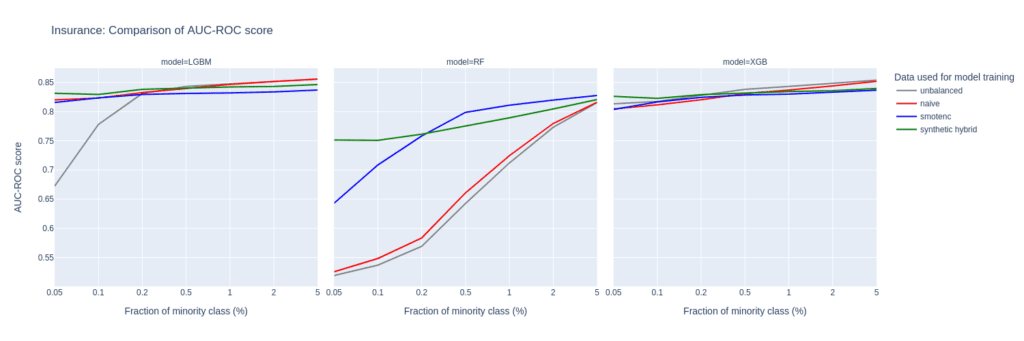
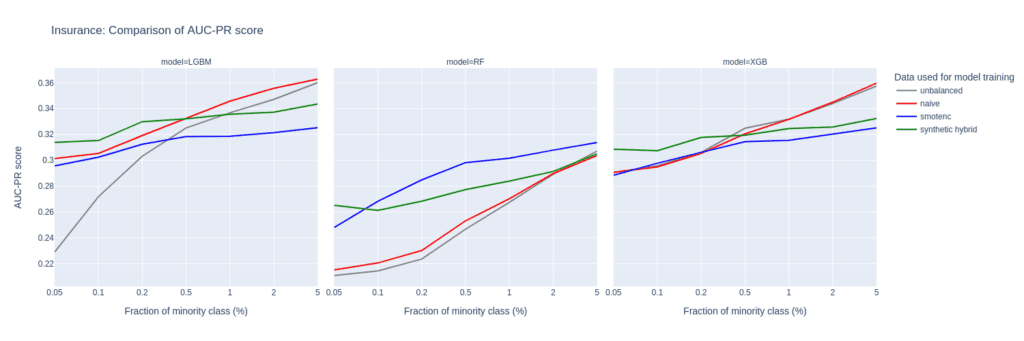
Figure 7: AUC-ROC (top) and AUC-PR (bottom) of classifiers LGBM, RandomForest (RF), and XGB trained on the Insurance data set to predict the target feature Response. The classifiers are trained on unbalanced data sets (grey) and data sets that are upsampled naively (red), with the SMOTE-NC algorithm (blue), and with AI-generated synthetic records (green). AUC values are reported for different fractions of the minority class in the unbalanced training data (x-axis).
Upsampling the Census data set
The Census data set has the largest number of features of all the data sets tested in this study. Especially, the 28 categorical features pose a challenge for SMOTE-NC, leading to poor performance in terms of AUC-PR.
Comparably to the Insurance data set, the performance of the LGBM classifier severely deteriorates when trained on highly unbalanced data sets. On the other hand, the XGB model excels and performs very well even on unbalanced training sets.
The Census data set highlights the importance of carefully selecting the appropriate model and upsampling technique when working with data sets that have high dimensionality and unbalanced class distributions, as performances can vary a lot.
Upsampling with synthetic data mitigates this variance, as all models trained on the hybrid data set are among the best performers across all classifiers and ranges of minority fractions.
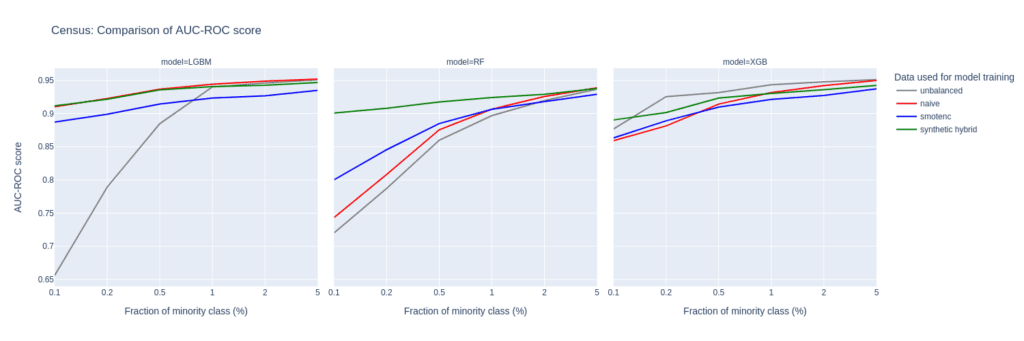
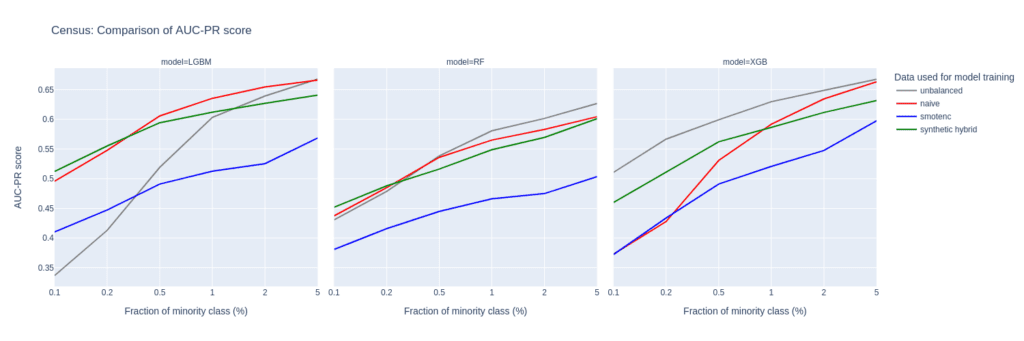
Figure 8: AUC-ROC (top) and AUC-PR (bottom) of classifiers LGBM, RandomForest (RF), and XGB trained on the Census data set to predict the target feature income. The classifiers are trained on unbalanced data sets (grey) and data sets that are upsampled naively (red), with the SMOTE-NC algorithm (blue), and with AI-generated synthetic records (green). AUC values are reported for different fractions of the minority class in the unbalanced training data (x-axis).
Synthetic data for upsampling
AI-based synthetic data generation can provide an effective solution to the problem of highly unbalanced data sets in machine learning. By creating diverse and realistic samples, upsampling with synthetic data generation can improve the performance of predictive models. This is especially true for cases where not only the minority fraction is low but also the absolute number of minority records is at a bare minimum. In such extreme settings, training on data upsampled with AI-generated synthetic records leads to better performance of prediction models than upsampling with SMOTE-NC or naive upsampling. Across all parameter settings explored in this study, synthetic upsampling resulted in predictive models which rank among the top-performing ones.