Evaluate synthetic dataset quality
While the Model report helps to gauge the quality of a trained generator, the Data report helps to examine any variations in the synthetic dataset when compared to the original data. The goal of the Data report is to highlight how any modifications in the generation settings (such as, Temperature & Top P, Rebalancing, Imputation, Fairness, Conditional simulation) have an impact on the distributions of the synthetic dataset.
Data insights
For each synthetic dataset, the Data insights section provides an overview of the generation settings used to generate the synthetic dataset. You can quickly scan if the generation settings are default or if they were modified. If modified, you can expect that your synthetic dataset will have distributions that differ from the original data.
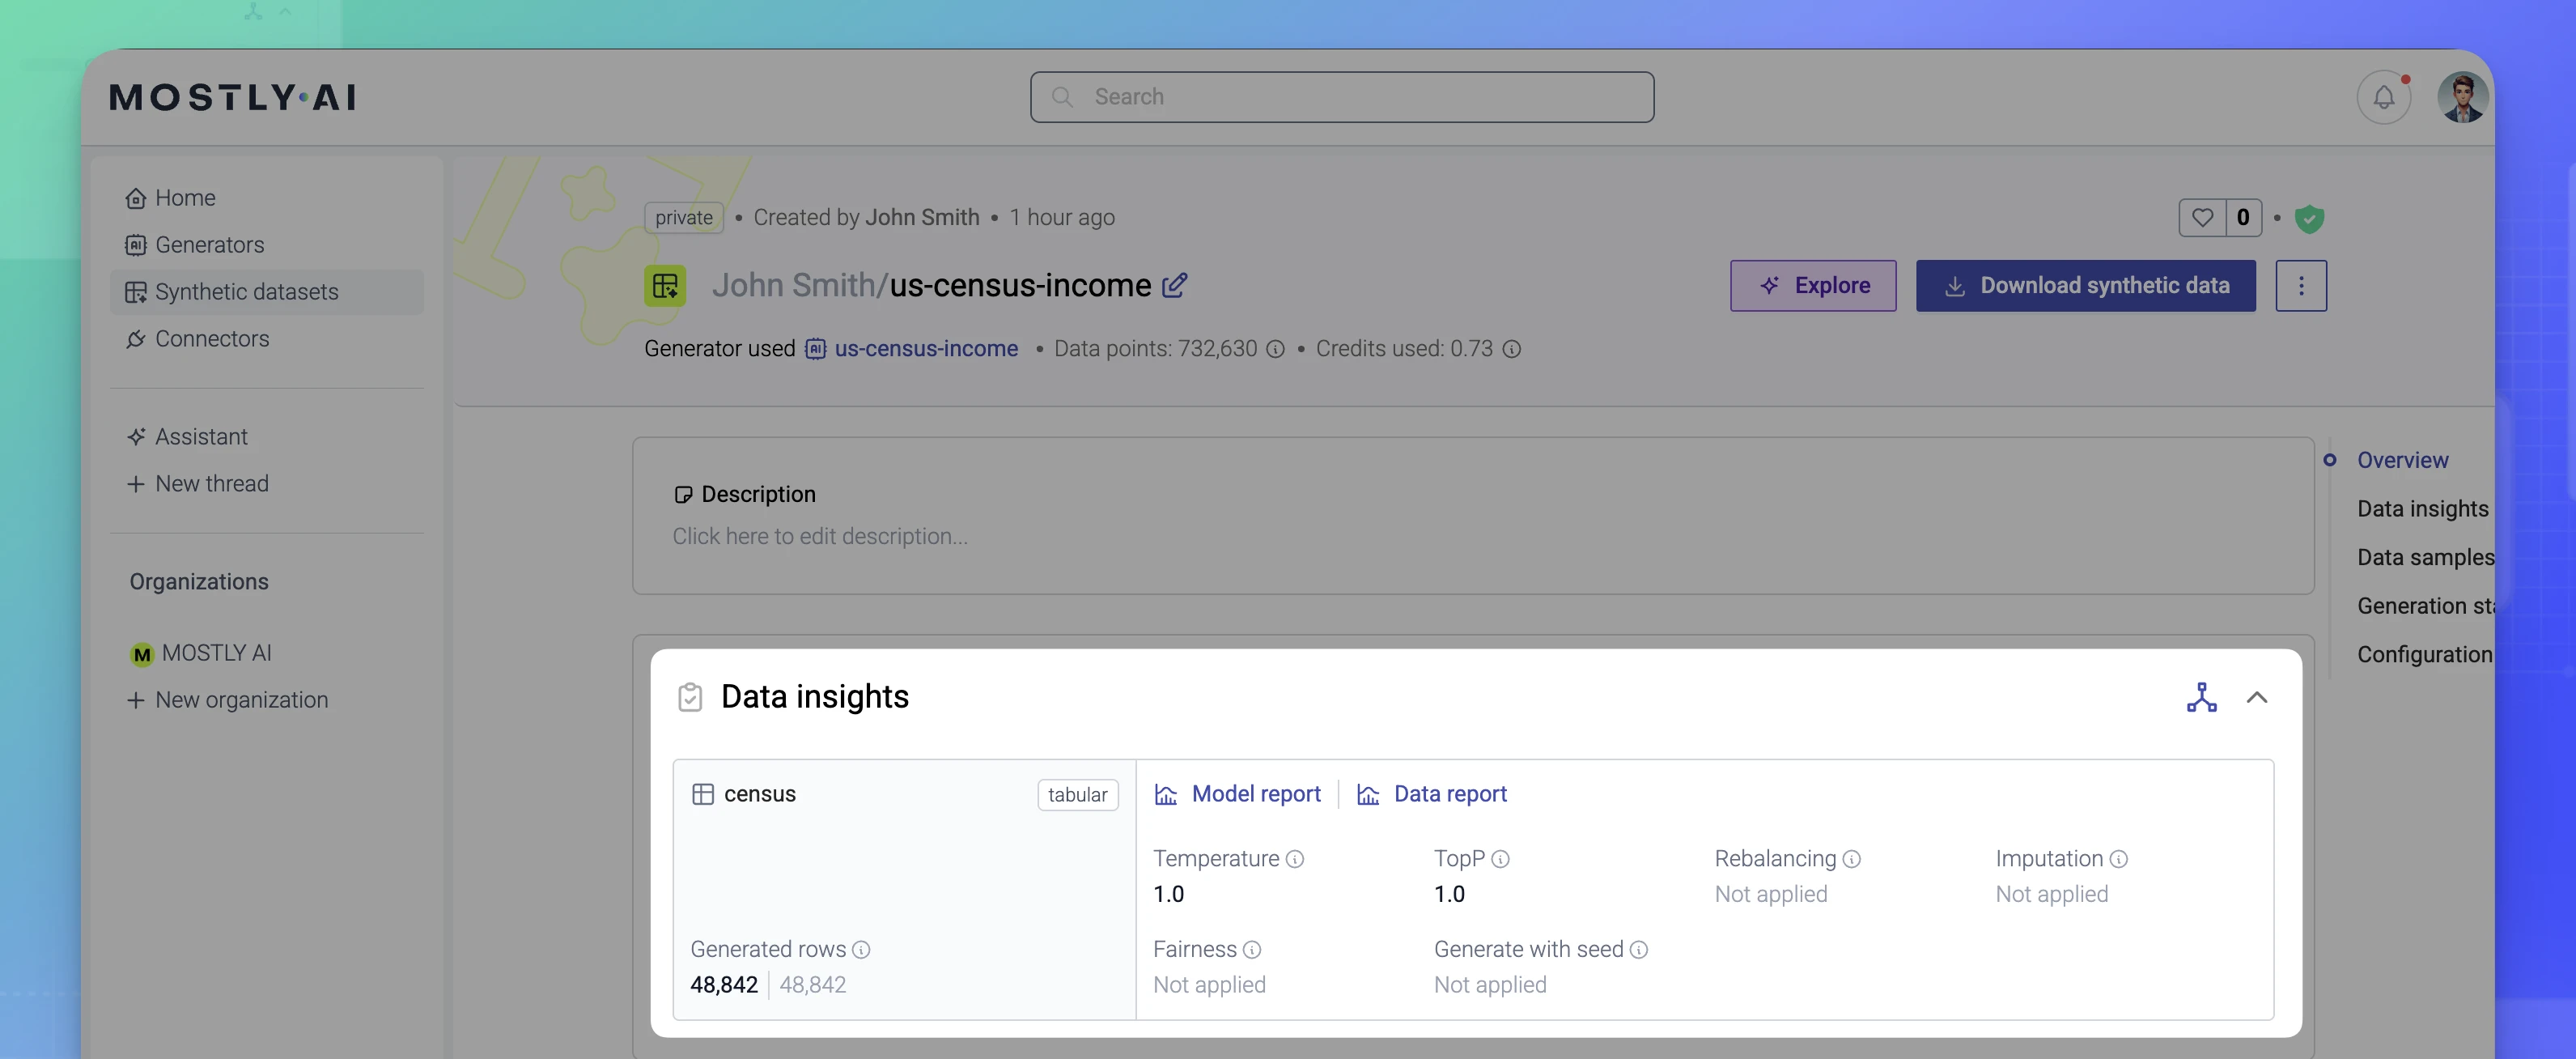
The Data insights section for synthetic datasets includes the data points:
| Generation setting | Description |
|---|---|
| Generated rows | The number of generated rows in the synthetic dataset. For reference, the number of rows in the original data appears in light grey. |
| Temperature | Default is 1.0.When you use a non-default sampling temperature, it trades off statistical representativeness for increased diversity (when >1) or increased coherence (when >1). This impacts the original distributions of all columns. |
| Top P | Default is 1.0When using a reduced Top P, you are sampling from a wider range of the most likely values. This can impact the original distributions of columns. |
| Rebalancing | If used, the rebalanced column has its distribution shifted as defined. This also impacts the distributions of the rest of columns in the table. |
| Imputation | If used, imputation replaces null or missing values with meaningful values in a column and this can impact its original distribution. |
| Fairness | If used, the target column is generated with statistical parity to remove biases based on the selected sensitive columns. For example, in income ~ sex, country, income is the target and sex, country are the sensitive columns. This impacts the original distributions. |
| Generate with seed | If used, the seed dataset can include changes to the original distributions of the columns it defines as context. All other columns will have their distributions shifted as a result. |
Data report
After a synthetic dataset is generated, the model and data reports are available under Data insights for each model in the used generator. The Model report is the same report that is generated for a generator and is simply attached to any synthetic datasets created with that generator.
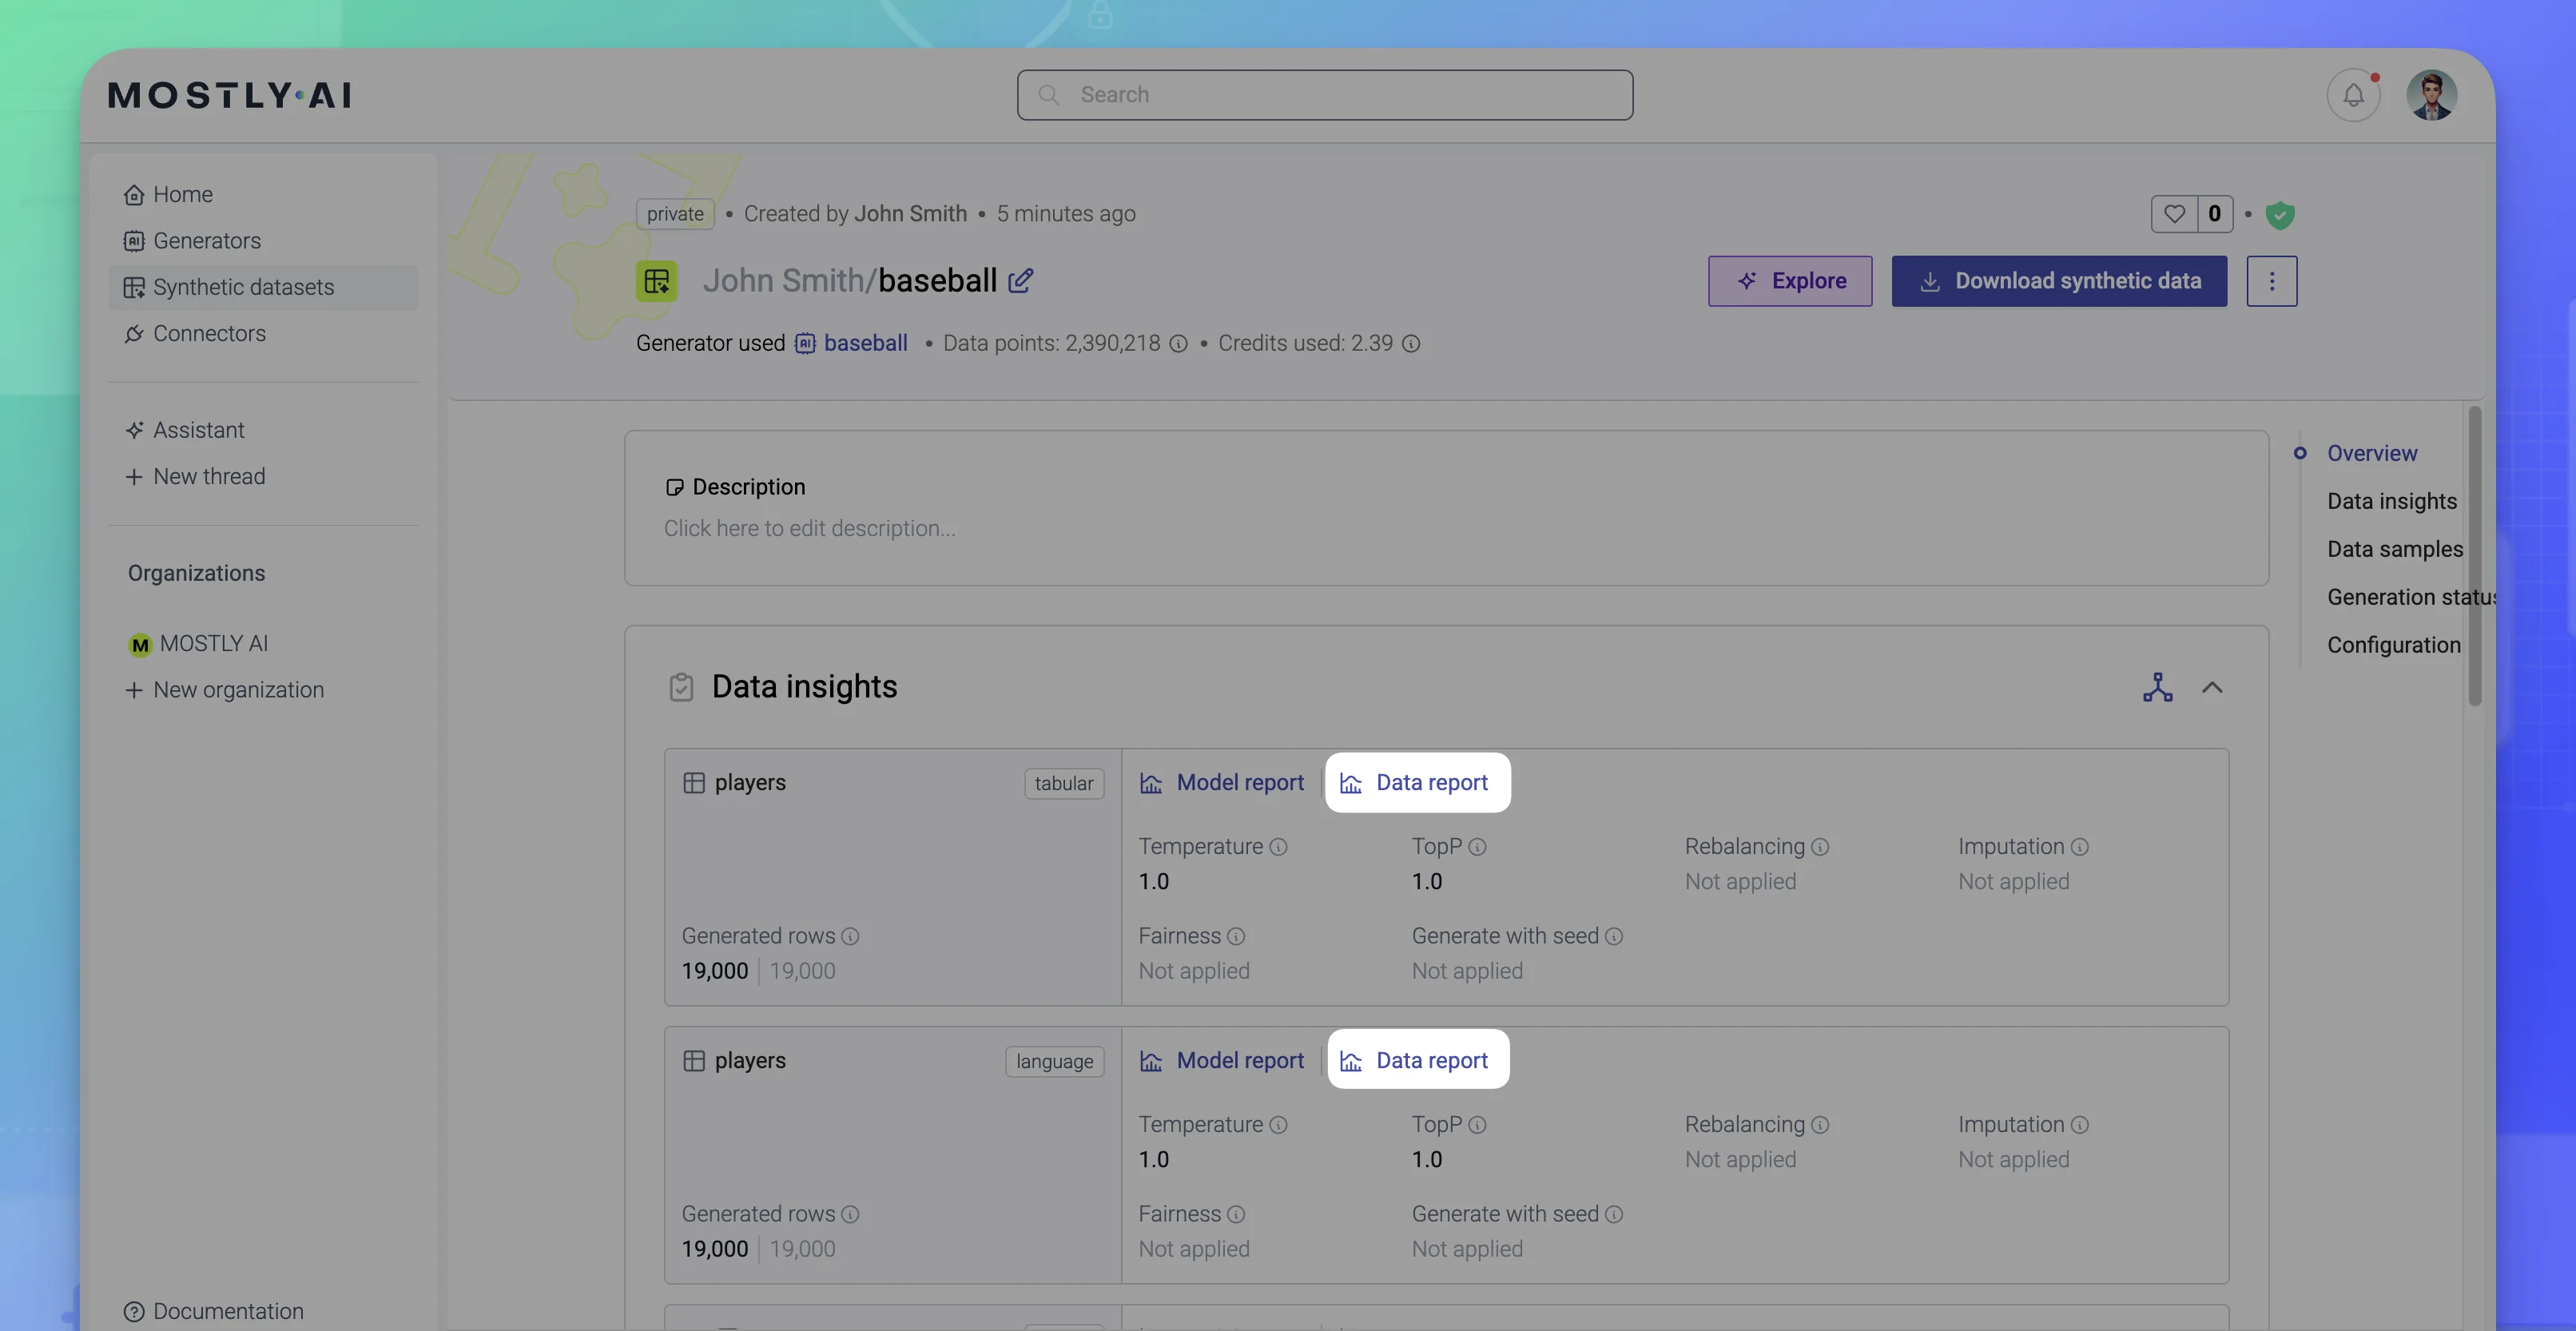
The Data report for synthetic datasets contains the sections listed below. These are identical to the same-named sections in the Model report (excluding the Accuracy and Distances sections).
- Correlations
- Univariate distributions
- Bivariate distributions
- Coherence / Auto-correlations (linked tables only)
- Similarity
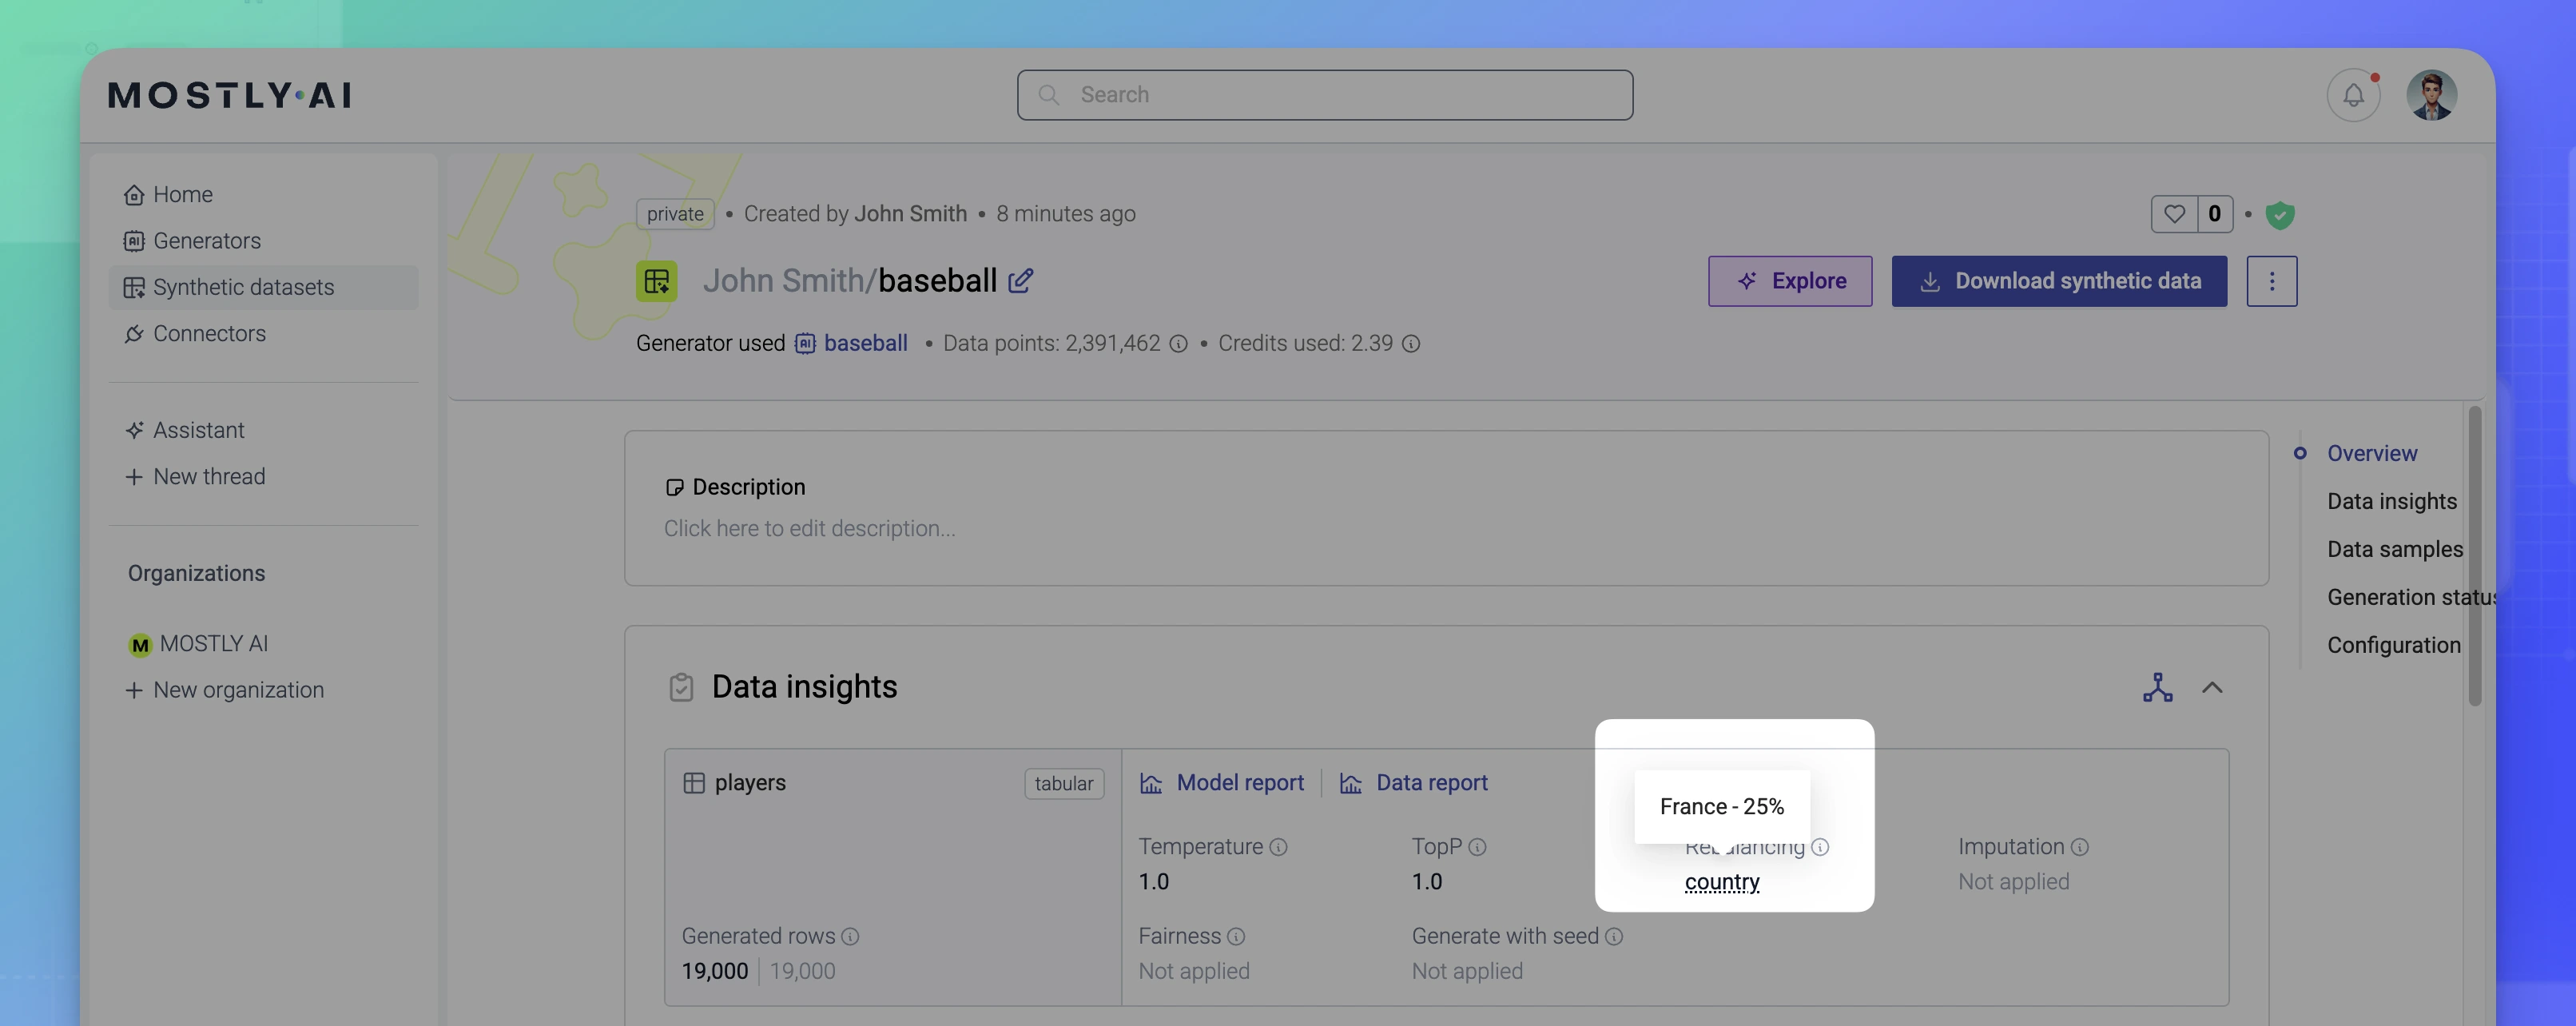
Data insights on modified generation
If you generated your synthetic dataset with one of the features that modifies generation, you can observe any impact on the distributions in the Data report. Any generation settings that are non-default are highlighted in the Data insights section.
For example, the screenshot below is of the Data insights section for the Baseball dataset which was generated with a rebalancing of the country column to contain 25% players with country France. The Rebalancing setting includes a listing of the rebalanced column. When you hover, a tooltip shows how the column was rebalanced.
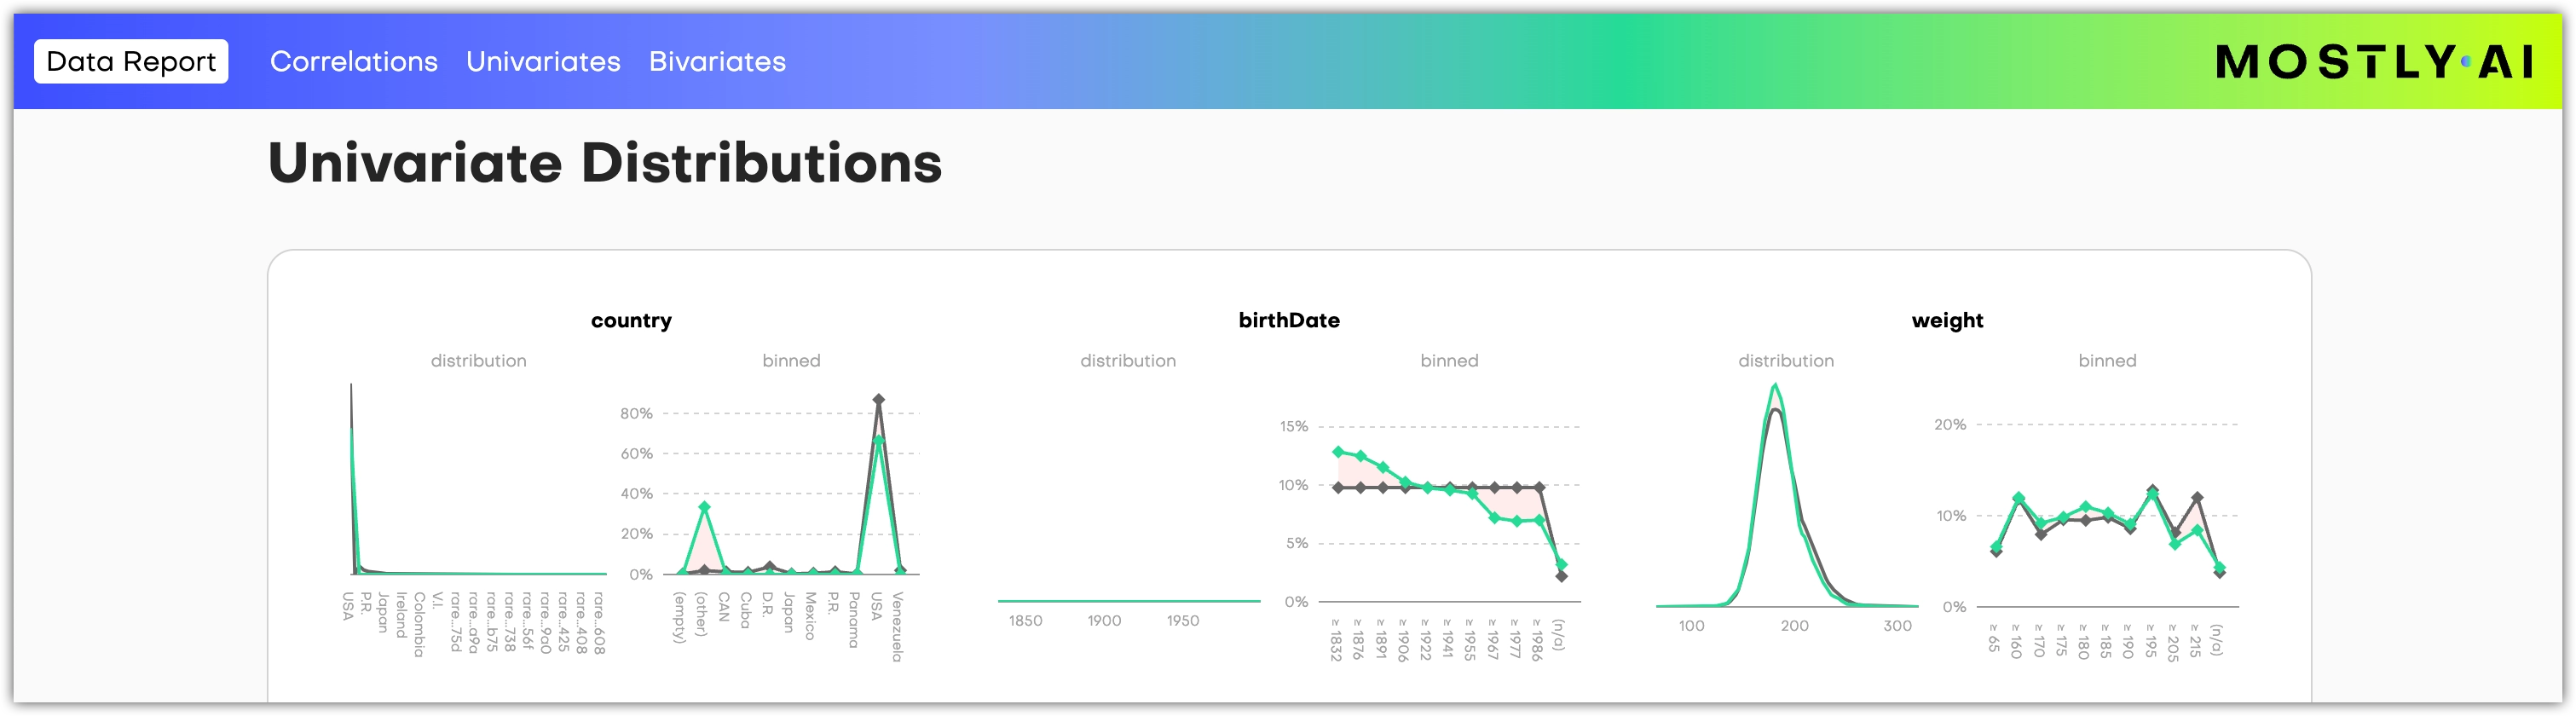
Rebalancing impacts the entire dataset and the distributions in the remaining columns. If you open the Data report, you can observe how the rebalanced column causes a spike in the binned chart of the country column in the Univariate distributions section. Any related changes then become apparent in the remaining charts in the Data report.
Note: The synthetic dataset distribution appears in green, and the original distribution appears in black.
Disable Data reports
If you do not need to generate a Data report for a table in the synthetic dataset, you can disable it.
By default, a Data report is enabled and generated for each table added to the generator..
Steps
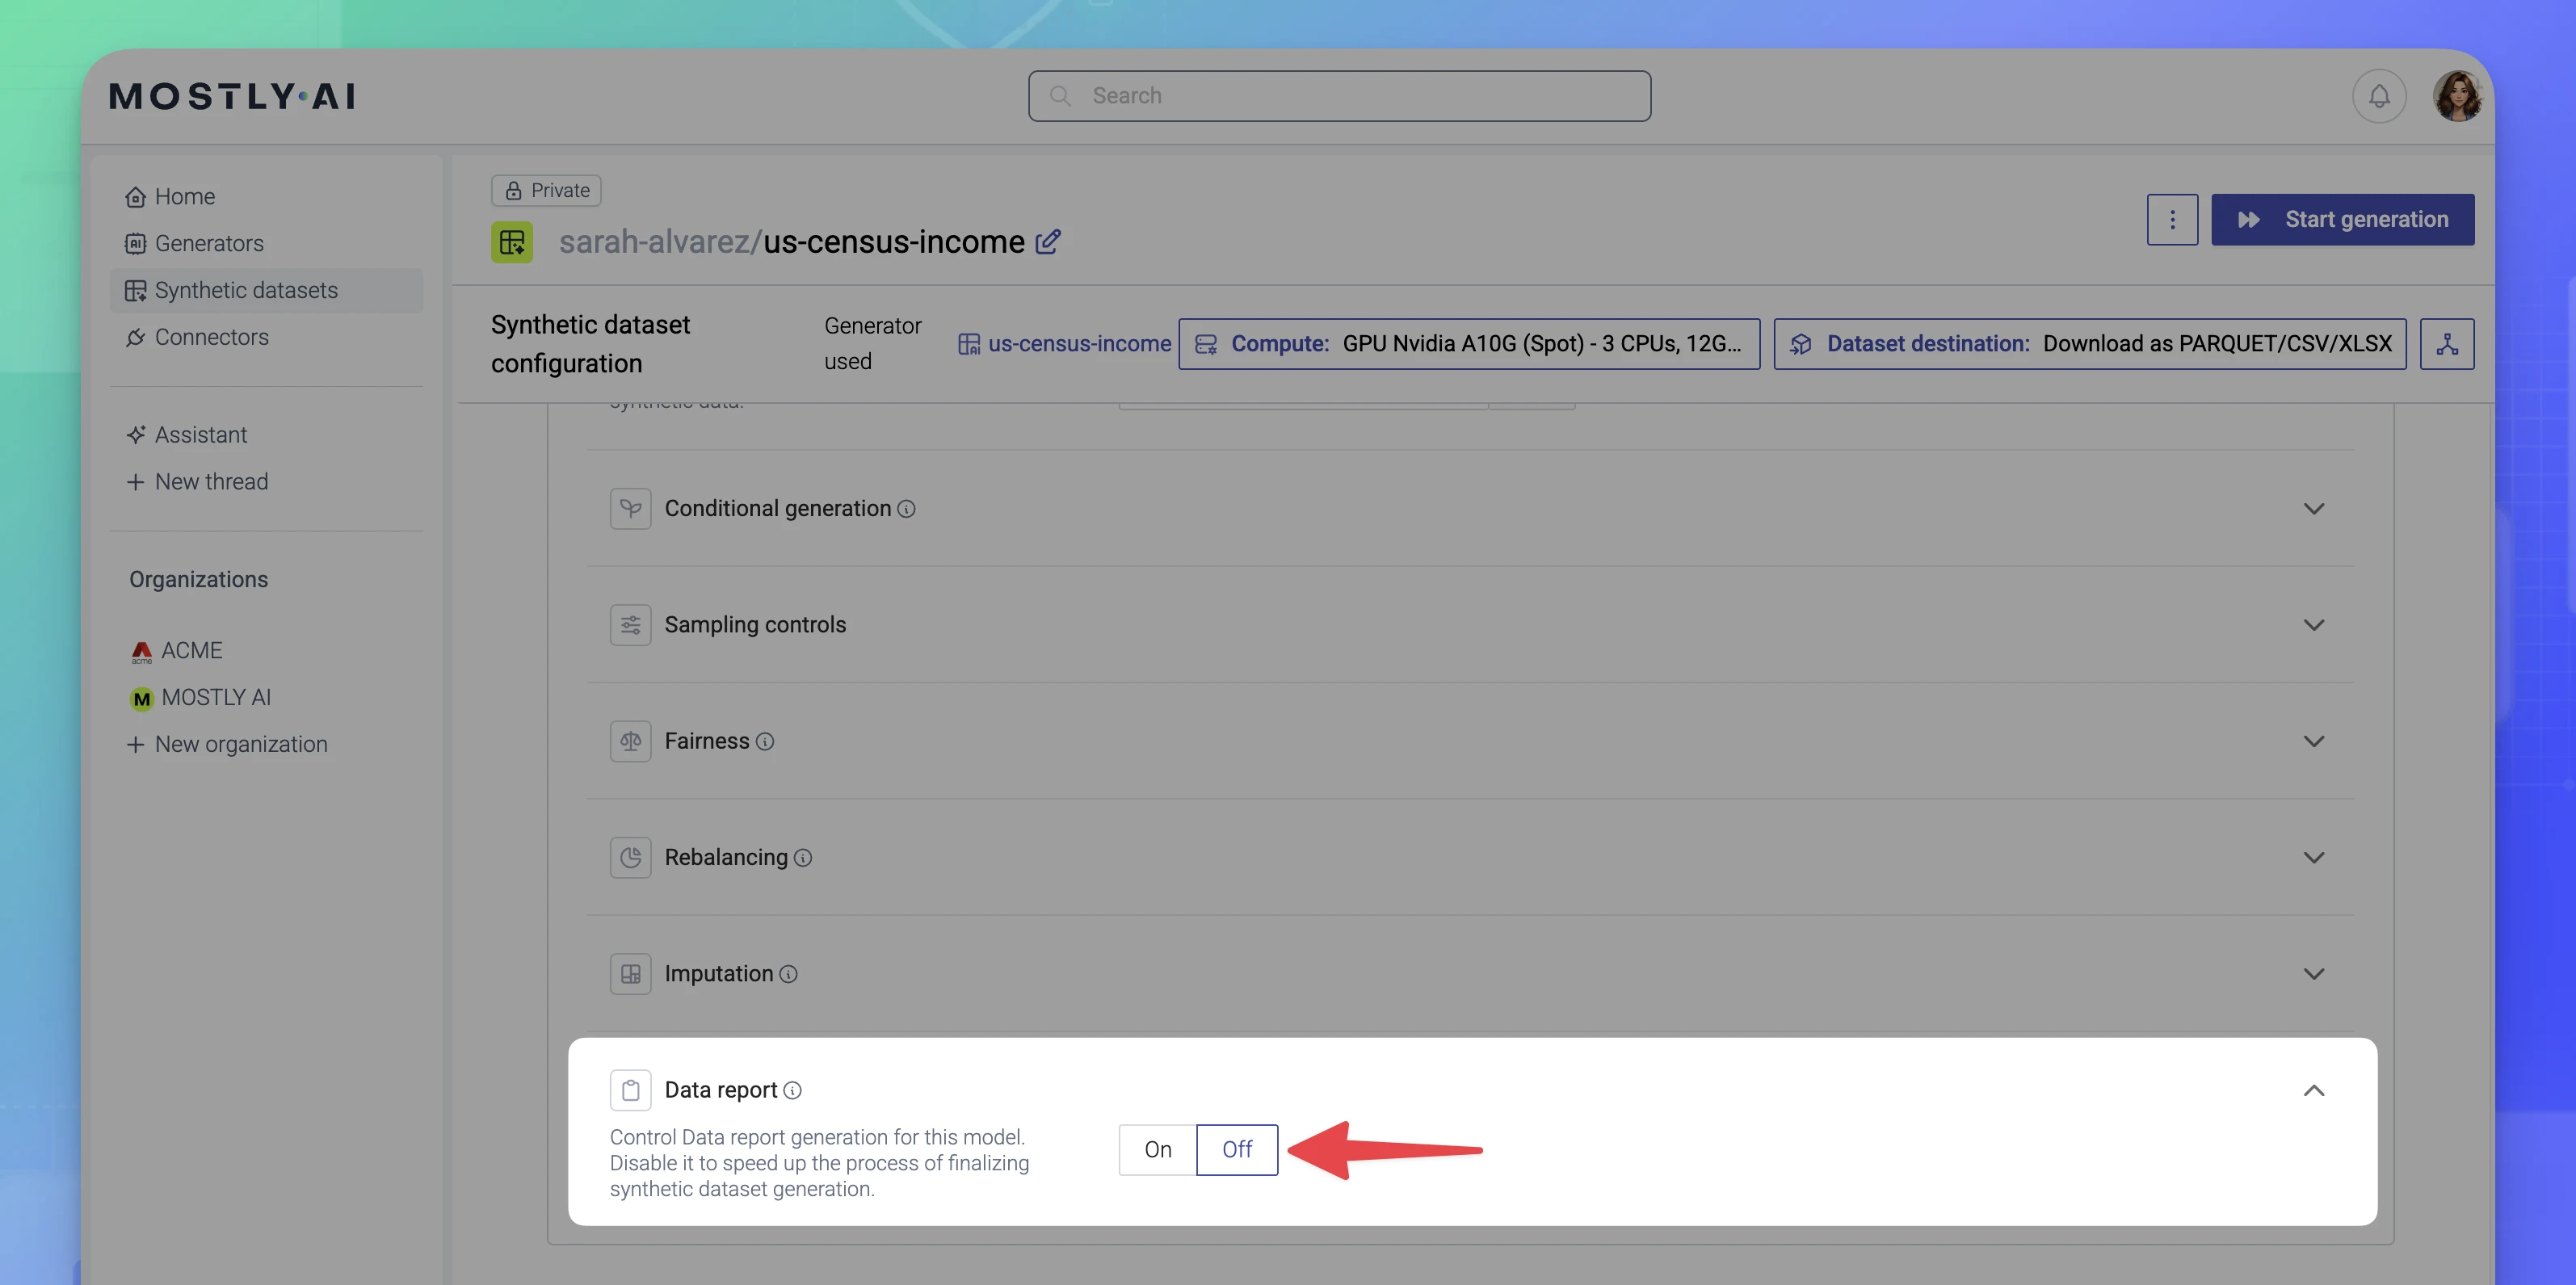
To disable the Data report for a table, select Off from the model’s Data report section.
Result
After the generation of the table completes, come the steps to finalize each table and finalize the synthetic dataset. During those steps, the Data reports will not be generated and the finalization is, therefore, faster.
Any disabled Data reports will not be available for their respective tables.