Rebalance columns
With MOSTLY AI, you can generate synthetic datasets that rebalance column distributions from your original data. You can use rebalancing for fairer distributions and bias mitigation in your synthetic datasets..
Rebalancing does not just impact the single variable you select to rebalance. All other variables in the dataset are also impacted based on the correlations they have with that variable. For example, you can use rebalancing to create a large number of relevant business scenarios out of the few that are present in your original data. Or you can use it to simulate “what-if” scenarios based on your existing, historical data, or upsample minority classes to help downstream machine learning algorithms pick up their patterns.
Note
Rebalancing is only available for subject tables and can only be applied to columns with the Categorical column type.
Prerequisites
To rebalance columns in generated synthetic datasets, the model you use for rebalancing must have flexible generation enabled.
Specify columns and values to rebalance
When you configure a new synthetic dataset, you can specify the columns you want to rebalance.
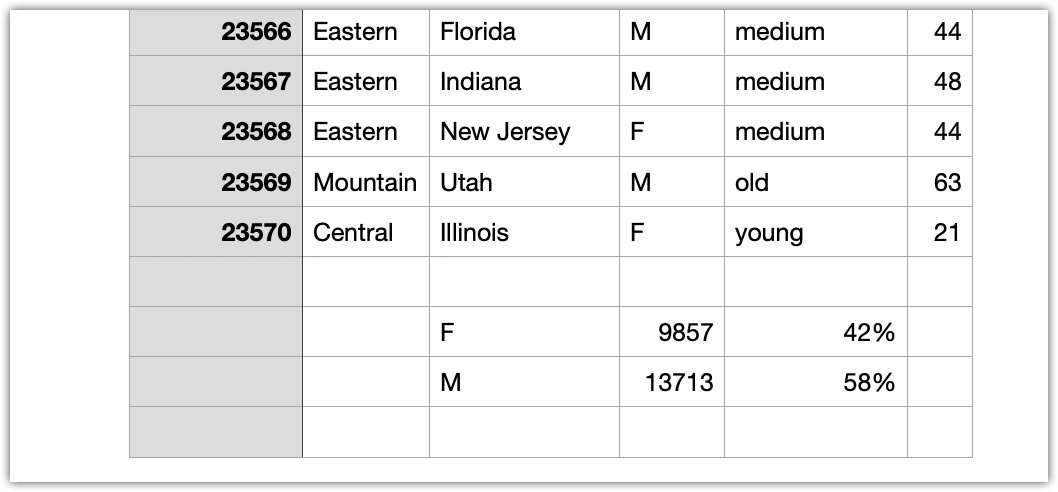
You can examine the CDNOW dataset where the distributions in the gender column of the customers table is 58% males and 42% females.

The examples below show how to rebalance the customers column and achieve a 50% - 50% distribution of males and females in the generated synthetic data.
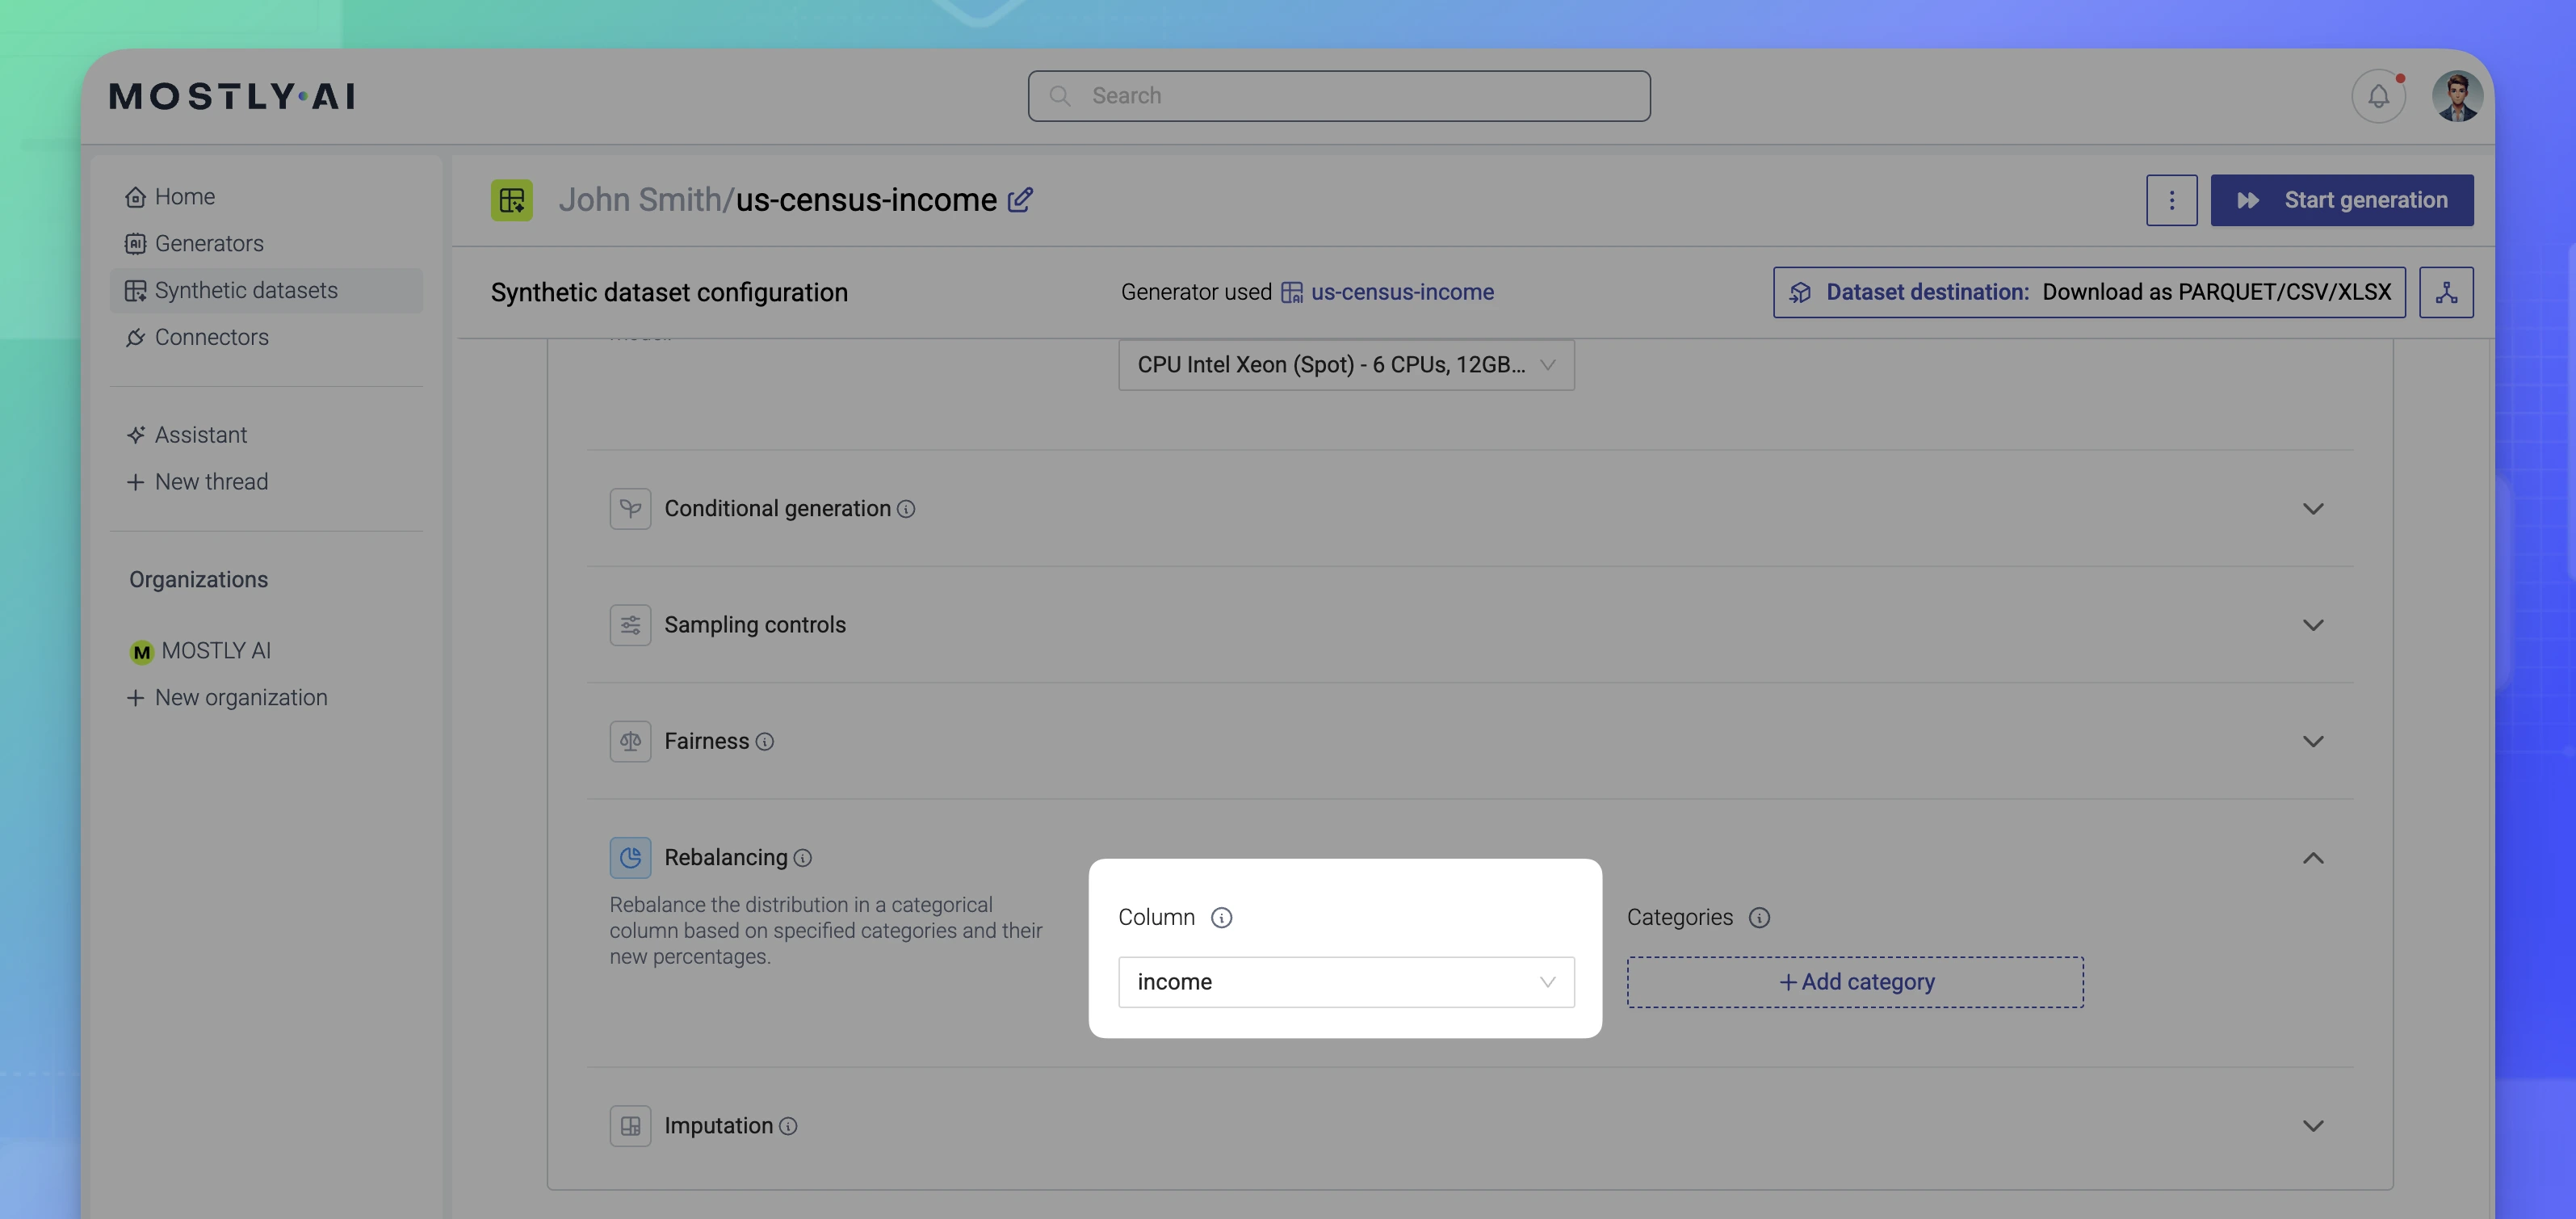
If you use the web application, you can select which column to rebalance from the Rebalancing column drop-down on the Synthetic dataset configuration page.
Steps
- Open the generator you want to use.
- Click Generate data in the upper right.
- Expand the generation settings for a table.
- Expand Rebalancing
- For Column, click and select the column to rebalance. In this case, select income.

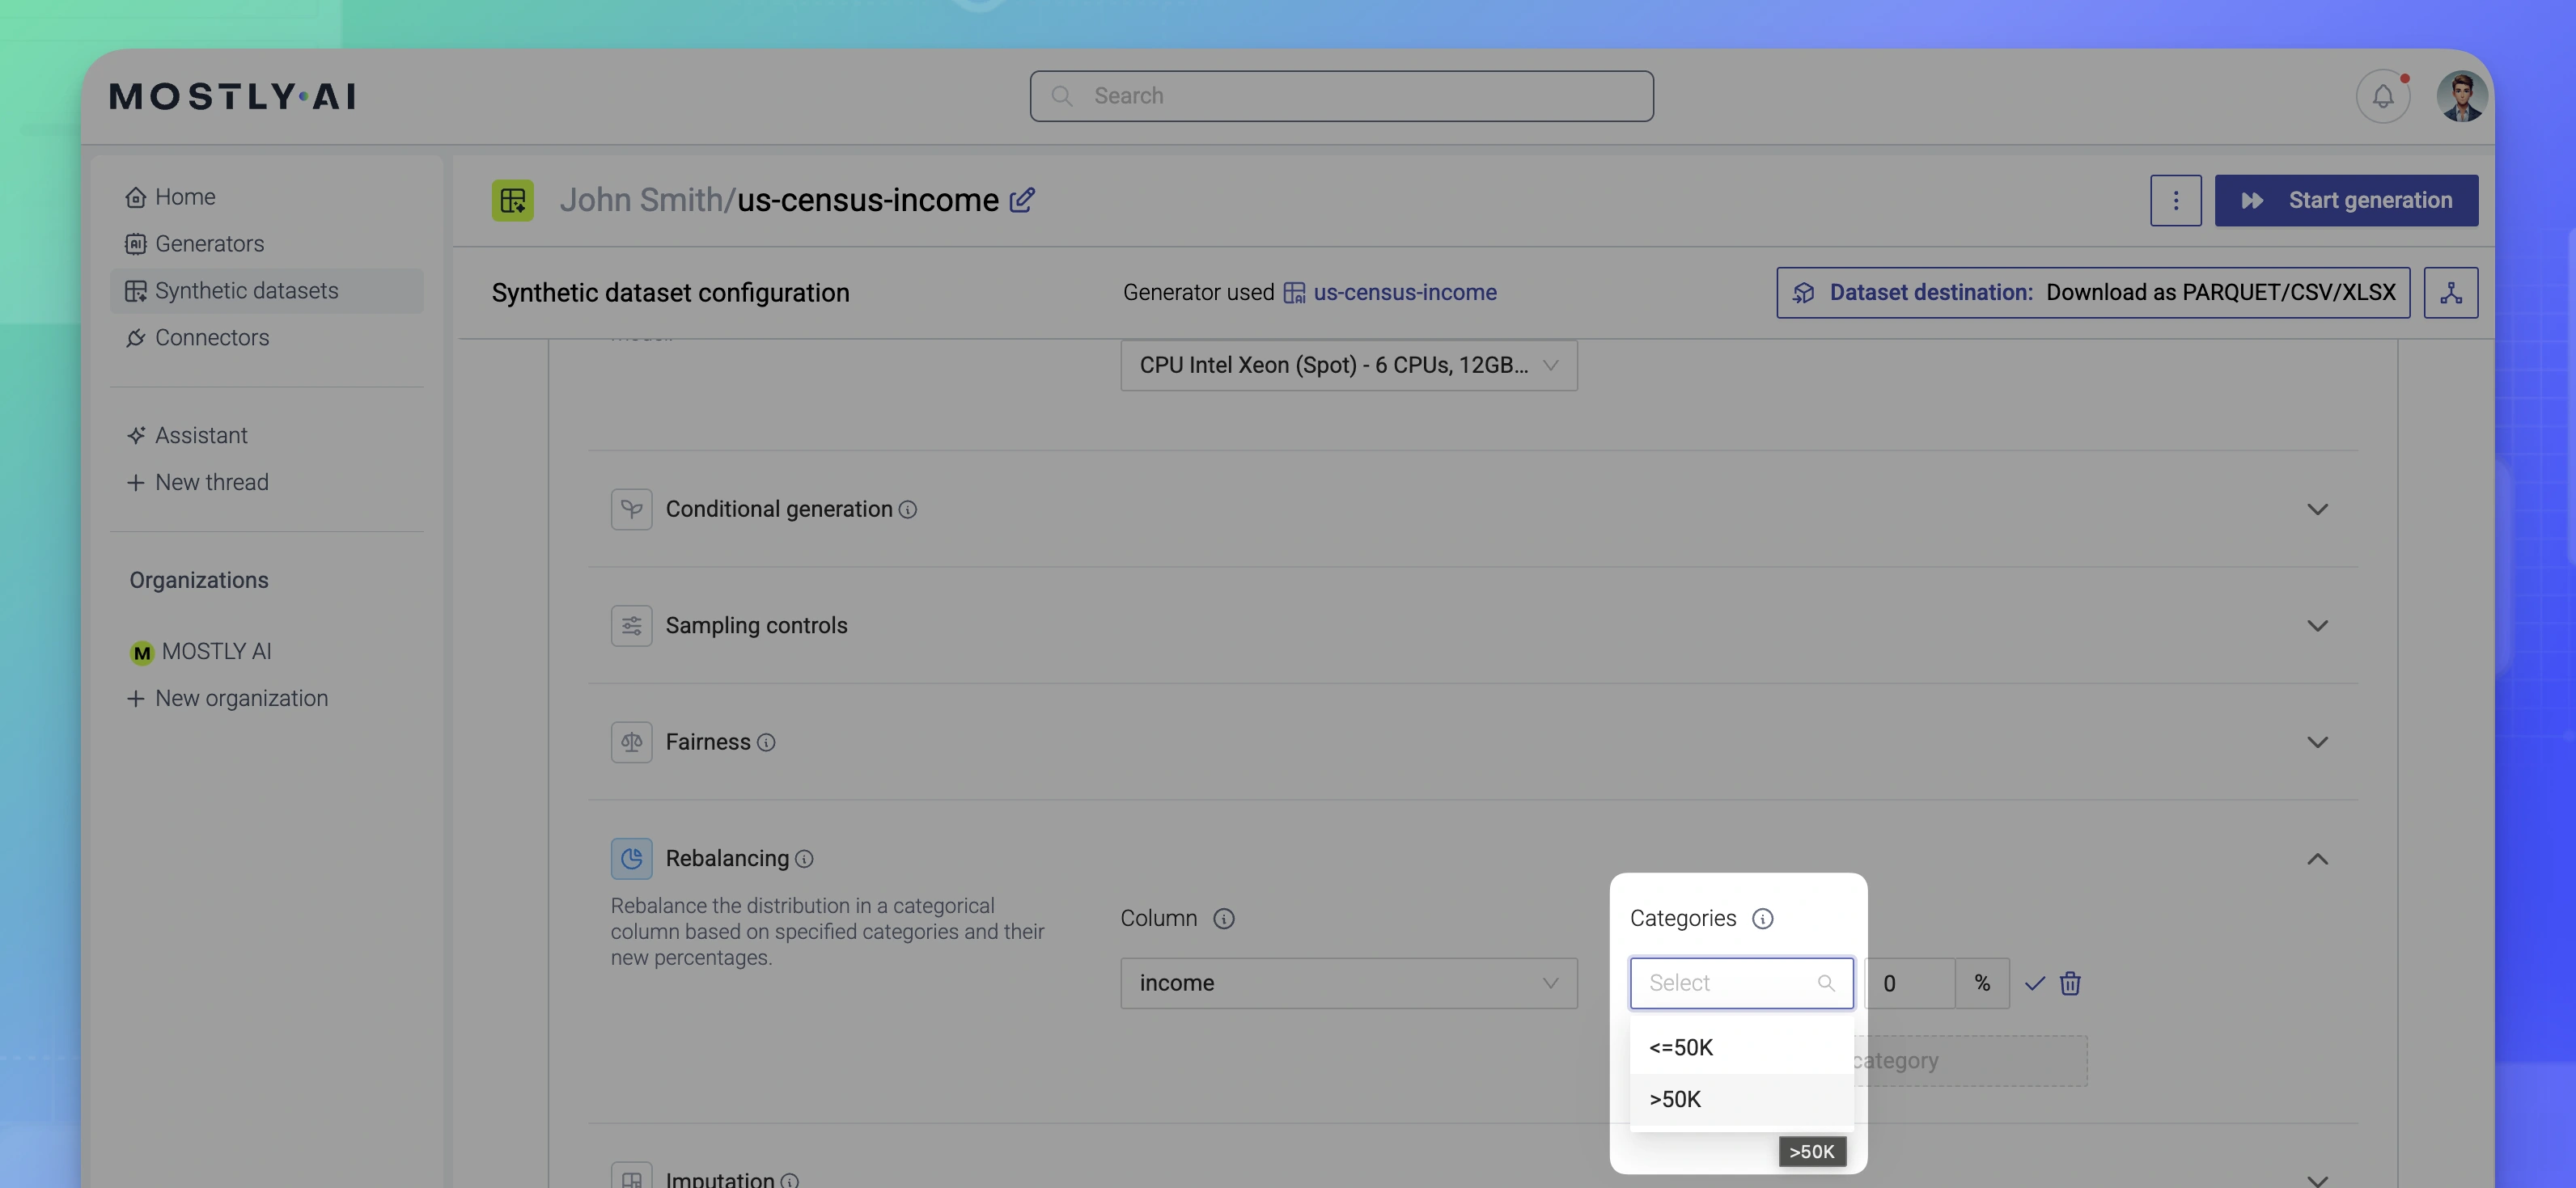
- Under Categories, click + Add category.
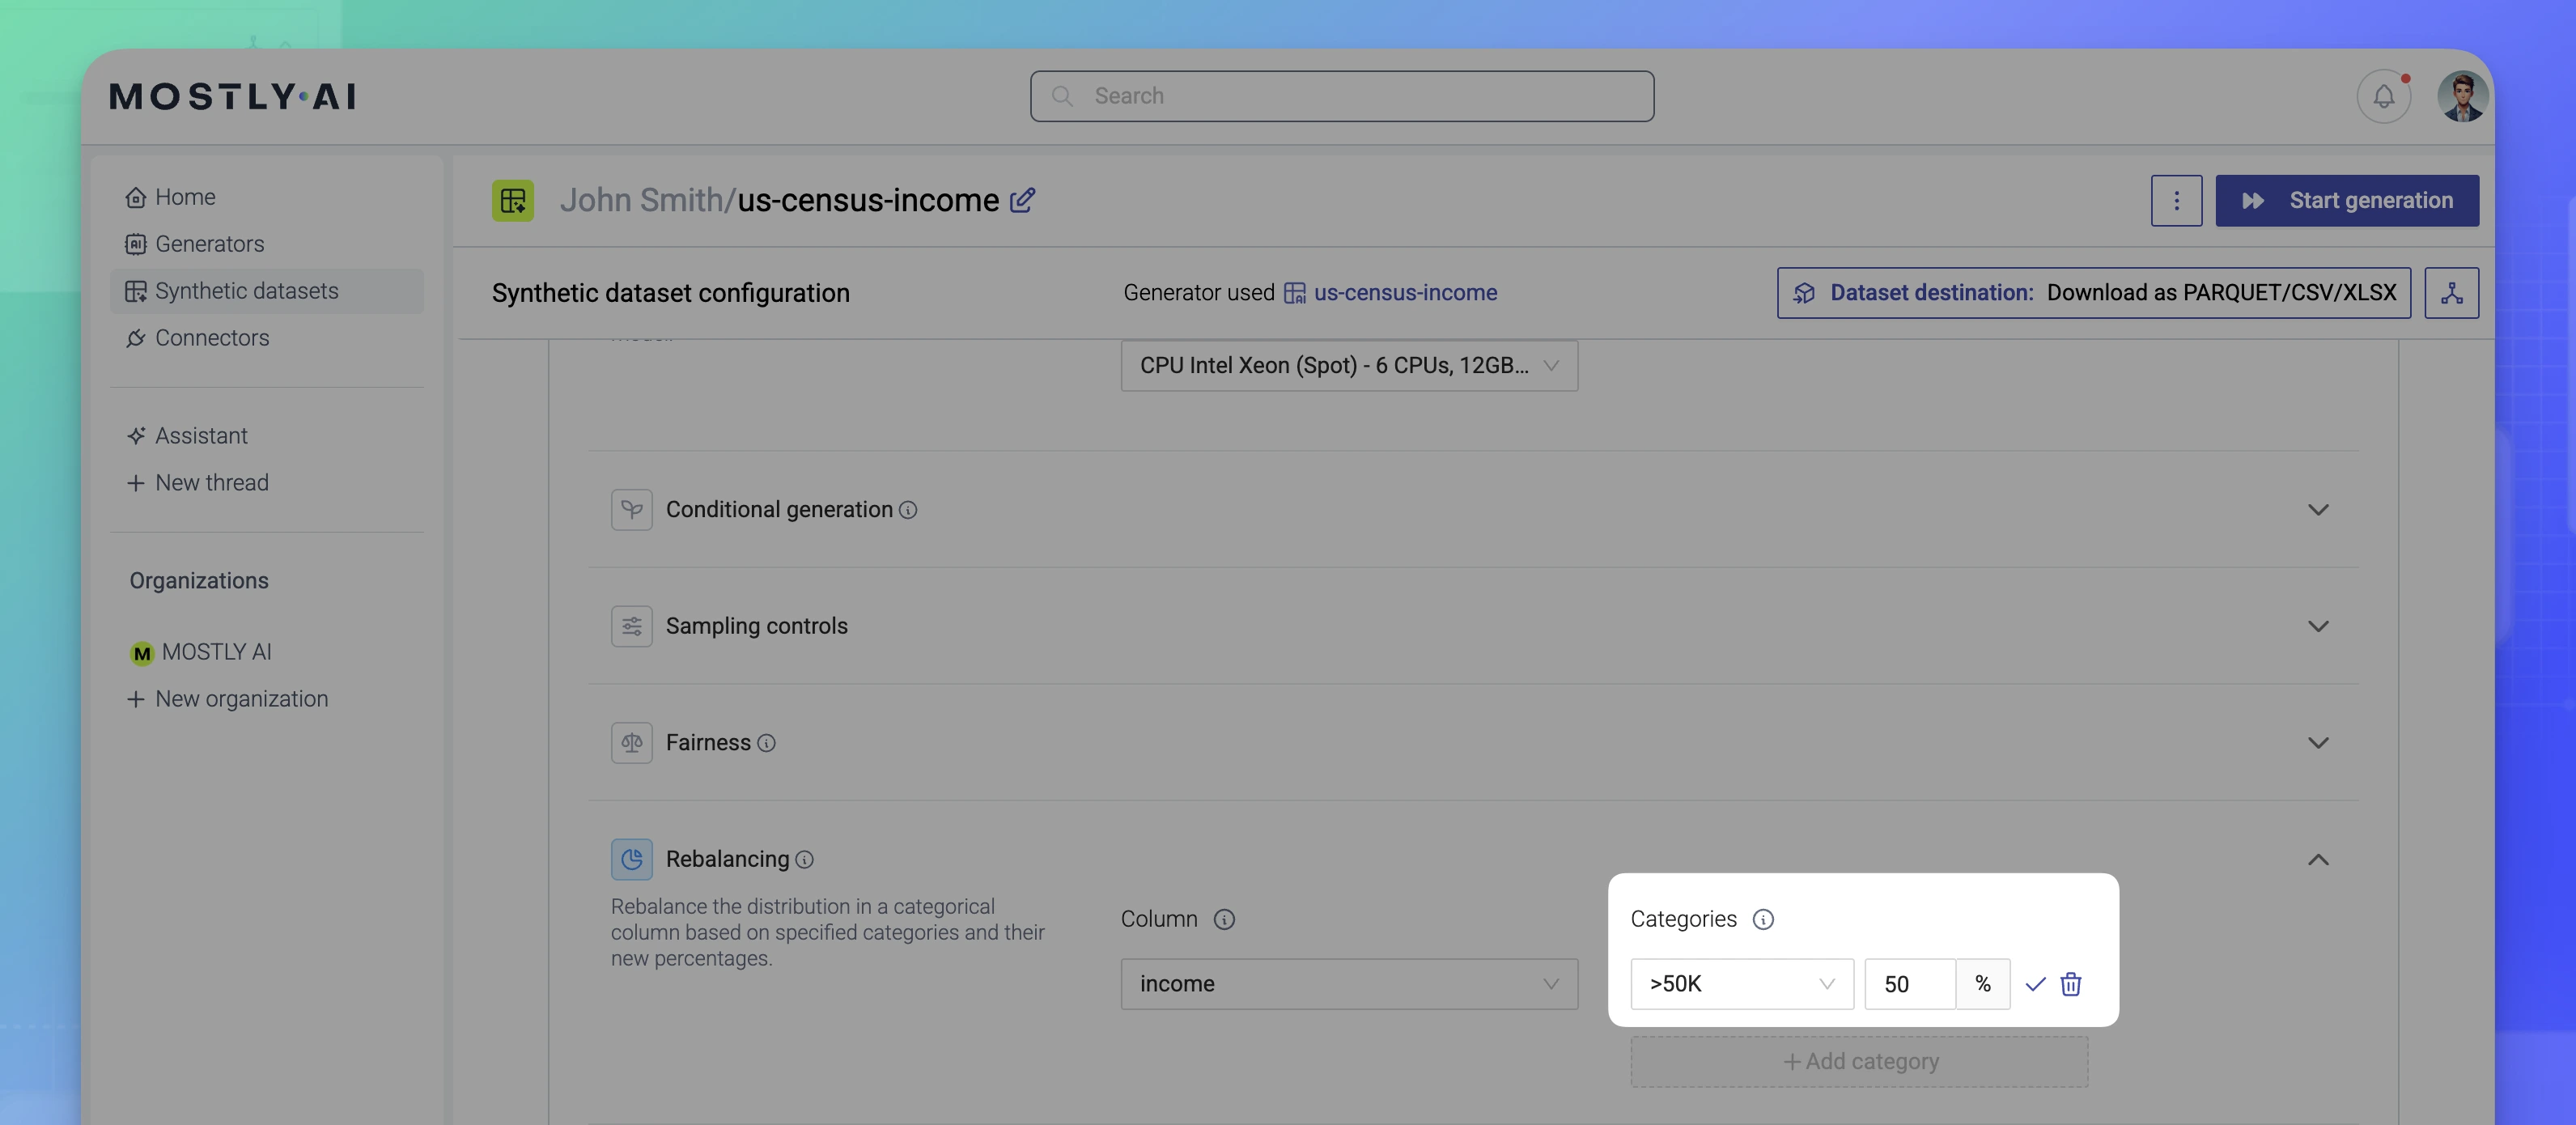
- Select the category to rebalance.

- Specify its new percentage and confirm.

- (Optional) Add more categories to rebalance.
- Click Start generation in the upper right.
Result
In the generated Data report for the synthetic dataset, you can navigate to the Univariate distributions and check the gender column distribution which now contains an equal split of F (female) and M (male) values.