Table of Contents
What is data bias?
Data bias is the systematic error introduced into data workflows and machine learning (ML) models due to inaccurate, missing, or incorrect data points which fail to accurately represent the population. Data bias in AI systems can lead to poor decision-making, costly compliance issues as well as drastic societal consequences. Amazon’s gender-biased HR model and Google’s racially-biased hate speech detector are some well-known examples of data bias with significant repercussions in the real world. It is no surprise, then, that 54% of top-level business leaders in the AI industry say they are “very to extremely concerned about data bias”.
With the massive new wave of interest and investment in Large Language Models (LLMs) and Generative AI, it is crucial to understand how data bias can affect the quality of these applications and the strategies you can use to mitigate this problem.
In this article, we will dive into the nuances of data bias. You will learn all about the different types of data bias, explore real-world examples involving LLMs and Generative AI applications, and learn about effective strategies for mitigation and the crucial role of synthetic data.
Data bias types and examples
There are many different types of data bias that you will want to watch out for in your LLM or Generative AI projects. This comprehensive Wikipedia list contains over 100 different types, each covering a very particular instance of biased data. For this discussion, we will focus on 5 types of data bias that are highly relevant to LLMs and Generative AI applications.
- Selection bias
- Automation bias
- Temporal bias
- Implicit bias
- Social bias
Selection bias
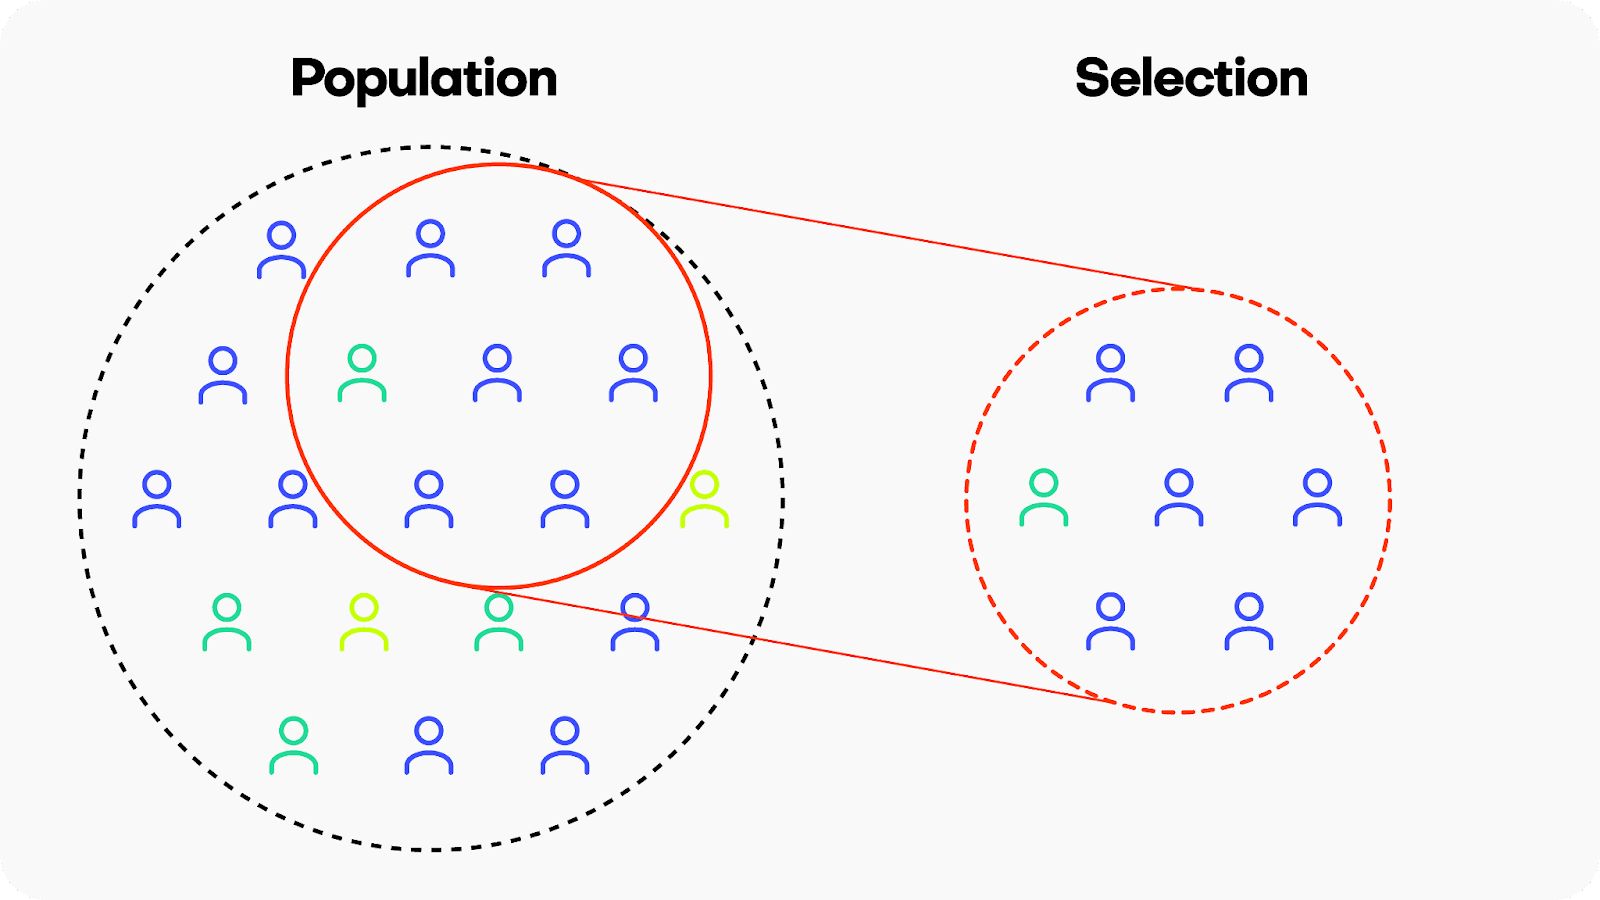
Selection bias occurs when the data used for training a machine learning model is not representative of the population it is intended to generalize to. This means that certain groups or types of data are either overrepresented or underrepresented, leading the model to learn patterns that may not accurately reflect the broader population. There are many different kinds of selection bias, such as sampling bias, participation bias and coverage bias.
Example: Google’s hate-speech detection algorithm Perspective is reported to exhibit bias against black American speech patterns, among other groups. Because the training data did not include sufficient examples of the linguistic patterns typical of the black American community, the model ended up flagging common slang used by black Americans as toxic. Leading generative AI companies like OpenAI, Anthropic and others are using Perspective daily at massive scale to determine the toxicity of their LLMs, potentially perpetuating these biased predictions.
Solution: Invest in high-quality, diverse data sources. When your data still has missing values or imbalanced categories, consider using synthetic data with rebalancing and smart imputation methods.
Automation bias
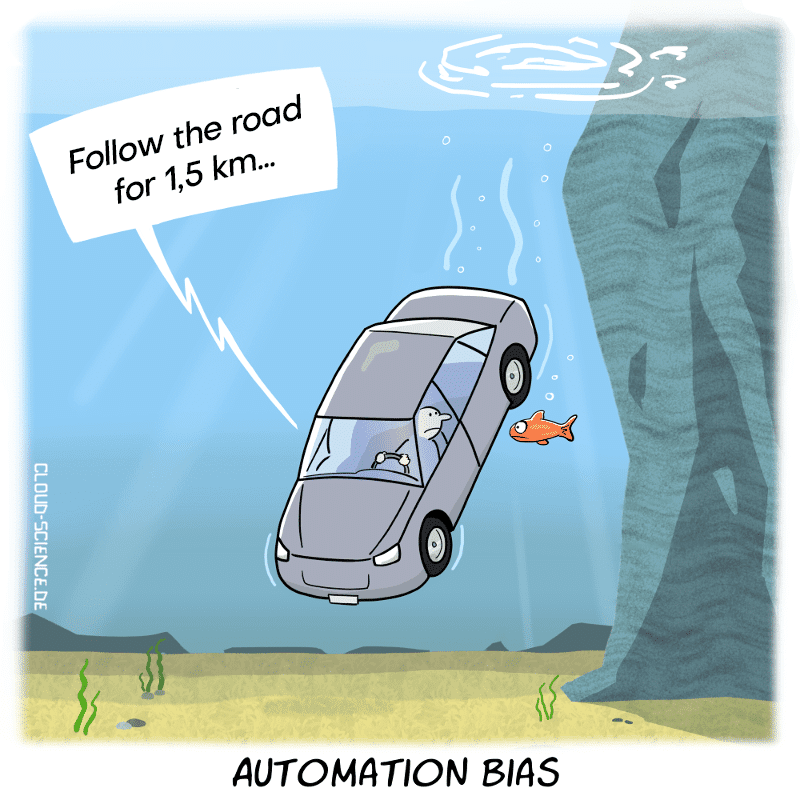
Automation bias is the tendency to favor results generated by automated systems over those generated by non-automated systems, irrespective of the relative quality of their outputs. This is becoming an increasingly relevant type of bias to watch out for as people, including top-level business leaders, may rush to implement automatically generated AI applications with the underlying assumption that simply because these applications use the latest, most popular tech their output will be inherently more trustworthy or performant.
Example: In a somewhat ironic overlap of generative technologies, a 2023 study found that some Mechanical Turk workers were using LLMs to generate the data which they were being paid to generate themselves. Later studies have since shown that training generative models on generated data can create a negative loop, also called “the curse of recursion”, which can significantly reduce output quality.
Solution: Include human supervision safeguards in any mission-critical AI application.
Temporal or historical bias
Temporal or historical bias arises when the training data is not representative of the current context in terms of time. Imagine a language model trained on a dataset from a specific time period, adopting outdated language or perspectives. This temporal bias can limit the model's ability to generate content that aligns with current information.

Example: ChatGPT’s long-standing September 2021 cut-off date is a clear example of a temporal bias that we have probably all encountered. Until recently, the LLM could not access training data after this date, severely limiting its applicability for use cases that required up-to-date data. Fortunately, in most cases the LLM was aware of its own bias and communicated it clearly with responses like "'I'm sorry, but I cannot provide real-time information".
Solution: Invest in high-quality data, up-to-date data sources. If you are still lacking data records, it may be possible to simulate them using synthetic data’s conditional generation feature.
Implicit bias
Implicit bias can happen when the humans involved in ML building or testing operate based on unconscious assumptions or preexisting judgments that do not accurately match the real world. Implicit biases are typically ingrained in individuals based on societal and cultural influences and can impact perceptions and behaviors without conscious awareness. Implicit biases operate involuntarily and can influence judgments and actions even when an individual consciously holds no biased beliefs. Because of the implied nature of this bias, it is a particularly challenging type of bias to address.

Example: LLMs and generative AI applications require huge amounts of labeled data. This labeling or annotation is largely done by human workers. These workers may operate with implicit biases. For example, in assigning a toxicity score for specific language prompts, a human annotation worker may assign an overly cautious or liberal score depending on personal experiences related to that specific word or phrase.
Solution: Invest in fairness and data bias training for your team. Whenever possible, involve multiple, diverse individuals in important data processing tasks to balance possible implicit biases.
Social bias
Social bias occurs when machine learning models reinforce existing social stereotypes present in the training data, such as negative racial, gender or age-dependent biases. Generative AI applications can inadvertently perpetuate biased views if their training data includes data that reflects societal prejudices. This can result in responses that reinforce harmful societal narratives. As ex-Google researcher Timit Gebru and colleagues cautioned in their 2021 paper: “In accepting large amounts of web text as ‘representative’ of ‘all’ of humanity [LLMs] risk perpetuating dominant viewpoints, increasing power imbalances and further reifying inequality.”
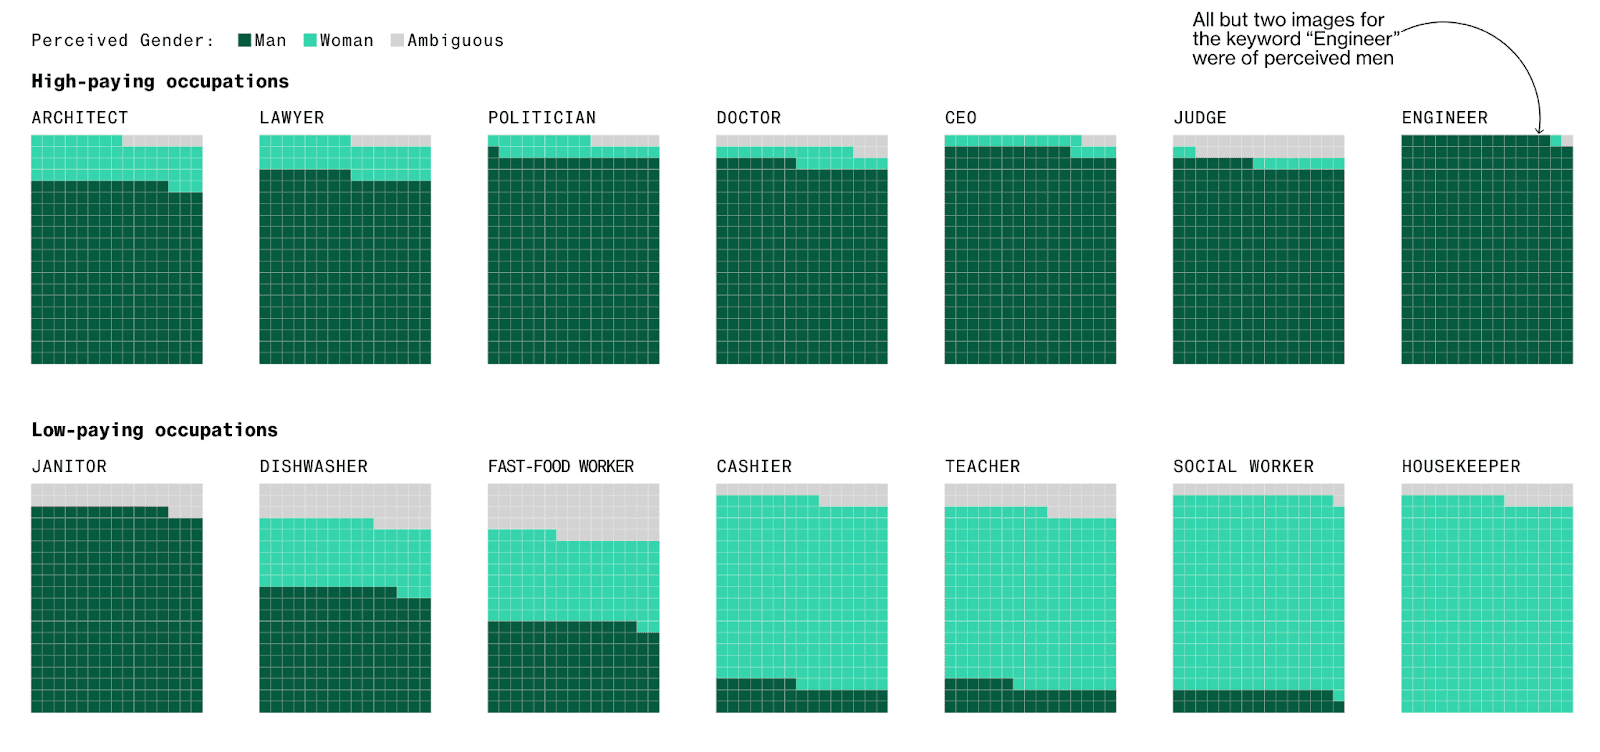
Example: Stable Diffusion and other generative AI models have been reported to exhibit socially biased behavior due to the quality of their training datasets. One study reported that the platform tends to underrepresent women in images of high-performing occupations and overrepresent darker-skinned people in images of low-wage workers and criminals. Part of the problem here seems to be the size of the training data. Generative AI models require massive amounts of training data and in order to achieve this data volume, the selection controls are often relaxed leading to poorer quality (i.e. more biased) input data.
Solution: Invest in high-quality, diverse data sources as well as data bias training for your team. It may also be possible to build automated safeguarding checks that will spot social bias in model outputs.
Perhaps more than any other type of data bias, social bias shows us the importance of the quality of the data you start with. You may build the perfect generative AI model but if your training data contains implicit social biases (simply because these biases existed in the subjects who generated the data) then your final model will most likely reproduce or even amplify these biases. For this reason, it’s crucial to invest in high-quality training data that is fair and unbiased.
Strategies for reducing data bias
Recognizing and acknowledging data bias is of course just the first step. Once you have identified data bias in your project you will also want to take concrete action to mitigate it. Sometimes, identifying data bias while your project is ongoing is already too late; for this reason it’s important to consider preventive strategies as well.
To mitigate data bias in the complex landscape of AI applications, consider:
- Investing in dataset diversity and data collection quality assurances.
- Performing regular algorithmic auditing to identify and rectify bias.
- Including humans in the loop for supervision.
- Investing in model explainability and transparency.
Let’s dive into more detail for each strategy.
Diverse dataset curation
There is no way around the old adage: “garbage in, garbage out”. Because of this, the cornerstone of combating bias is curating high-quality, diverse datasets. In the case of LLMs, this involves exposing the model to a wide array of linguistic styles, contexts, and cultural nuances. For Generative AI models more generally, it means ensuring to the best of your ability that training data sets are sourced from as varied a population as possible and actively working to identify and rectify any implicit social biases. If, after this, your data still has missing values or imbalanced categories, consider using synthetic data with rebalancing and smart imputation methods.
Algorithmic auditing
Regular audits of machine learning algorithms are crucial for identifying and rectifying bias. For both LLMs and generative AI applications in general, auditing involves continuous monitoring of model outputs for potential biases and adjusting the training data and/or the model’s architecture accordingly.
Humans in the loop
When combating data bias it is ironically easy to fall into the trap of automation bias by letting programs do all the work and trusting them blindly to recognize bias when it occurs. This is the core of the problem with the widespread use of Google’s Perspective to avoid toxic LLM output. Because the bias-detector in this case is not fool-proof, its application is not straightforward. This is why the builders of Perspective strongly recommend continuing to include human supervision in the loop.
Explainability and transparency
Some degree of data bias is unavoidable. For this reason, it is crucial to invest in the explainability and transparency of your LLMs and Generative AI models. For LLMs, providing explanations and sources for generated text can offer insights into the model's decision-making process. When done right, model explainability and transparency will give users more context on the generated output and allow them to understand and potentially contest biased outputs.
Synthetic data reduces data bias
Synthetic data can help you mitigate data bias. During the data synthesization process, it is possible to introduce different kinds of constraints, such as fairness. The result is fair synthetic data, without any bias. You can also use synthetic data to improve model explainability and transparency by removing privacy concerns and significantly expanding the group of users you can share the training data with.

More specifically, you can mitigate the following types of data bias using synthetic data:
Selection Bias
If you are dealing with imbalanced datasets due to selection bias, you can use synthetic data to rebalance your datasets to include more samples of the minority population. For example, you can use this feature to provide more nuanced responses for polarizing topics (e.g. book reviews, which generally tend to be overly positive or negative) to train your LLM app.
Social Bias
Conditional data generation enables you to take a gender- or racially-biased dataset and simulate what it would look like without the biases included. For example, you can simulate what the UCI Adult Income dataset would look like without a gender income gap. This can be a powerful tool in combating social biases.
Reporting or Participation Bias
If you are dealing with missing data points due to reporting or participation bias, you can use smart imputation to impute the missing values in a high-quality, statistically representative manner. This allows you to avoid data loss by allowing you to use all the records available. Using MOSTLY AI’s Smart Imputation feature it is possible to recover the original population distribution which means you can continue to use the dataset as if there were no missing values to begin with.
Mitigating data bias in LLM and generative AI applications
Data bias is a pervasive and multi-faceted problem that can have significant negative impacts if not dealt with appropriately. The real-world examples you have seen in this article show clearly that even the biggest players in the field of AI struggle to get this right. With tightening government regulations and increasing social pressure to ensure fair and responsible AI applications, the urgency to identify and rectify data bias at all points of the LLM and Generative AI lifecycle is only becoming stronger.
In this article you have learned how to recognise the different kinds of data bias that can affect your LLM or Generative AI applications. You have explored the impact of data bias through real-world examples and learned about some of the most effective strategies for mitigating data bias. You have also seen the role synthetic data can play in addressing this problem.
If you’d like to put this new knowledge to use directly, take a look at our hands-on coding tutorials on conditional data generation, rebalancing, and smart imputation. MOSTLY AI's free, state-of-the-art synthetic data generator allows you to try these advanced data augmentation techniques without the need to code.
For a more in-depth study on the importance of fairness in AI and the role that synthetic data can play, read our series on fair synthetic data.
As we wrap up 2023, the corporate world is abuzz with the next technological wave: Enterprise AI. Over the past few years, AI has taken center stage in conversations across newsfeeds and boardrooms alike. From the inception of neural networks to the emergence of companies like Deepmind at Google and the proliferation of Deepfake videos, AI's influence has been undeniable.
While some are captivated by the potential of these advancements, others approach them with caution, emphasizing the need for clear boundaries and ethical guidelines. Tech visionaries, including Elon Musk, have voiced concerns about AI's ethical complexities and potential dangers when deployed without stringent rules and best practices. Other advocates of AI skepticism include Timnit Gebru, one of the first people to sound alarms at Google, Dr. Hinton, the godfather of AI and even Sam Altman, CEO of OpenAI, voiced concerns, as well as the renowned historian Yuval Harari.
Now, Enterprise AI is knocking on the doors of corporate boardrooms, presenting executives with a familiar challenge: the eternal dilemma of adopting new technology. Adopt too early, and you risk venturing into the unknown, potentially inviting reputational and financial damage. Adopt too late, and you might miss the efficiency and cost-cutting opportunities that Enterprise AI promises.
What is Enterprise AI?
Enterprise AI, also known as Enterprise Artificial Intelligence, refers to the application of artificial intelligence (AI) technologies and techniques within large organizations or enterprises to improve various aspects of their operations, decision-making processes, and customer interactions. It involves leveraging AI tools, machine learning algorithms, natural language processing, and other AI-related technologies to address specific business challenges and enhance overall efficiency, productivity, and competitiveness.
In a world where failing to adapt has led to the downfall of organizations, as witnessed in the recent history of the banking industry with companies like Credit Suisse, the pressure to reduce operational costs and stay competitive is more pressing than ever. Add to this mix the current macroeconomic landscape, with higher-than-ideal inflation and lending rates, and the urgency for companies not to be left behind becomes palpable.
Moreover, many corporate leaders still find themselves grappling with the pros and cons of integrating the previous wave of technologies, such as blockchain. Just as the dust was settling on blockchain's implementation, AI burst into the spotlight. A limited understanding of how technologies like neural networks function, coupled with a general lack of comprehension regarding their potential business applications, has left corporate leaders facing a perfect storm of FOMO (Fear of Missing Out) and FOCICAD (Fear of Causing Irreversible Chaos and Damage).
So, how can industry leaders navigate the world of Enterprise AI without losing their footing and potentially harming their organizations? The answer lies in combining traditional business processes and quality management with cutting-edge auxiliary technologies to mitigate the risks surrounding AI and its outputs. Here are the questions which QuantumBlack, AI by McKinsey, suggests boards to ask about generative AI.
Laying the foundation for Enterprise AI adoption
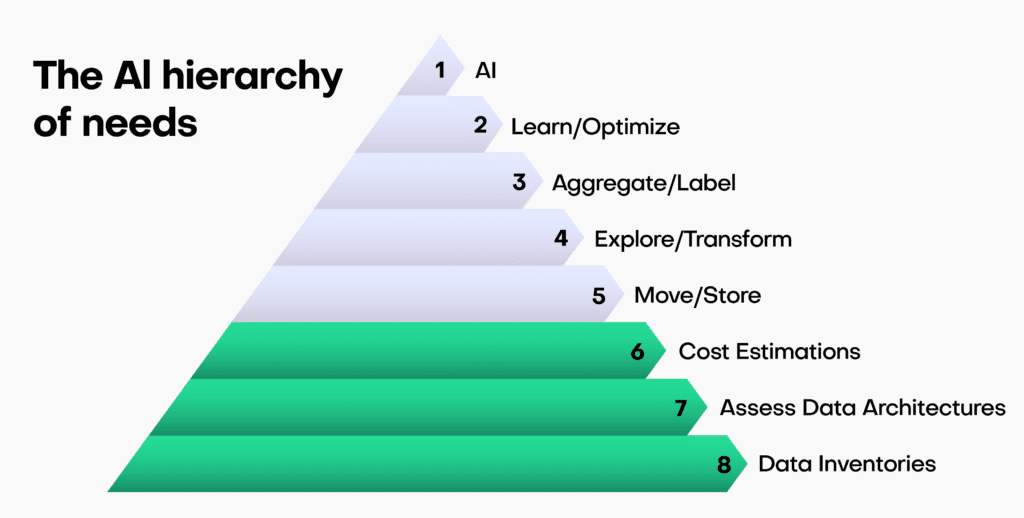
To embark on a successful Enterprise AI journey, companies need to build a strong foundation. This involves several crucial steps:
- Data Inventories: Conduct thorough data inventories to gain a comprehensive understanding of your organization's data landscape. This step helps identify the type of data available, its quality, and its relevance to AI initiatives.
- Assess Data Architectures: Evaluate your existing data structures and systems to determine their compatibility with AI integration. Consider whether any modifications or updates are necessary to ensure smooth data flow and accessibility.
- Cost Estimation: Calculate the costs associated with adopting AI, including labor for data preparation and model development, technology investments, and change management expenses. This step provides a realistic budget for your AI initiatives.
By following these steps, organizations can lay the groundwork for a successful AI adoption strategy. It helps in avoiding common pitfalls related to data quality and infrastructure readiness.
Leveraging auxiliary technologies in Enterprise AI
In a recent survey by a large telecommunications company, half of all respondents said they wait up to one month for privacy approvals before they can proceed with their data processing and analytics activities. Data Processing Agreements (DPAs), Secure by Design processes, and further approvals are the main reasons behind these high lead times.
The demand for quicker, more accessible, and statistically representative data makes the case that real and mock data just aren't good enough to meet these (somewhat basic) requirements.
On the other side, however, The Wall Street Journal has recently reported that big tech companies such as Microsoft, Google, and Adobe are struggling to make AI technology profitable as they attempt to integrate it into their existing products.
The dichotomy we see here can put decision-makers into a state of paralysis: the need to act is imminent, but the price of poor action is high. Trustworthy and competent guidance, along with a sound strategy, is the only way out of the AI rabbit hole and towards AI-based solutions that can be monetized and thereby target and alleviate corporate pain points.
One of the key strategies to mitigate the risks associated with AI adoption is to leverage auxiliary technologies. These technologies act as force multipliers, enhancing the efficiency and safety of AI implementations. Recently, European lawmakers specifically included synthetic data in the draft of the EU's upcoming AI Act, as a data type explicitly suitable for building AI systems.
In this context, MOSTLY AI's Synthetic Data Platform emerges as a powerful ally. This innovative platform offers synthetic data generation capabilities that can significantly aid in AI development and deployment. Here's how it can benefit your organization:
- Enhancing Data Privacy: Synthetic data allows organizations to work with data that resembles their real data but contains no personally identifiable information (PII). This ensures compliance with data privacy regulations, such as GDPR and HIPAA.
- Reducing Data Bias: The platform generates synthetic data that is free from inherent biases present in real data. This helps in building fair and unbiased AI models, reducing the risk of discrimination.
- Accelerating AI Development: Synthetic data accelerates AI development by providing a diverse dataset that can be used for training and testing models. It reduces the time and effort required to collect and clean real data.
- Testing AI Systems Safely: Organizations can use synthetic data to simulate various scenarios and test AI systems without exposing sensitive or confidential information.
- Cost Efficiency: Synthetic data reduces the need to invest in expensive data collection and storage processes, making AI adoption more cost-effective.
By incorporating MOSTLY AI's Synthetic Data Platform into your AI strategy, you can significantly reduce the complexities and uncertainties associated with data privacy, bias, and development timelines.
Enterprise AI example: ChatGPT's Code Interpreter
To illustrate the practical application of auxiliary technologies, let's consider a concrete example: Chat GPT's code interpreter in conjunction with MOSTLY AI’s Synthetic Data Platform. This innovative duo-tool plays a pivotal role in ensuring companies can harness the power of AI while maintaining safety and compliance. Business teams can feed statistically meaningful synthetic data into their corporate ChatGPT instead of real corporate data and thereby meet both data accuracy and privacy objectives.
Defining guidelines and best practices for Enterprise AI
Before diving into Enterprise AI implementation, it's essential to set clear guidelines and best practices. This involves:
- Scope and Planning Strategy: Define the scope of your AI implementation, aligning it with your organization's strategic objectives. Create a comprehensive plan that outlines the steps, timelines, and resources required for a successful AI deployment.
Embracing auxiliary technologies
In the context of auxiliary technologies, MOSTLY AI's Synthetic Data Platform is an invaluable resource. This platform provides organizations with the ability to generate synthetic data that closely mimics their real data, without compromising privacy or security.
Insight: The combination of setting clear guidelines and leveraging auxiliary technologies like MOSTLY AI's Synthetic Data Platform ensures a smoother and safer AI journey for organizations, where innovation can thrive without fear of adverse consequences.
The transformative force of Enterprise AI
In summary, Enterprise AI is no longer a distant concept but a transformative force reshaping the corporate landscape. The challenges it presents are real, as are the opportunities.
We've explored the delicate balance executives must strike when considering AI adoption, the ethical concerns that underscore this technology, and a structured approach to navigate these challenges. Auxiliary technologies like MOSTLY AI's Synthetic Data Platform serve as indispensable tools, allowing organizations to harness the full potential of AI while safeguarding against risks.
As you embark on your Enterprise AI journey, remember that the right tools and strategies can make all the difference. Explore MOSTLY AI's Synthetic Data Platform to discover how it can enhance your AI initiatives and keep your organization on the path to success. With a solid foundation and the right auxiliary technologies, the future of Enterprise AI holds boundless possibilities.
If you would like to know more about synthetic data, we suggest trying MOSTLY AI's free synthetic data generator, using one of the sample dataets provided within the app or reach out to us for a personalized demo!
The European Union’s Artificial Intelligence Act (“AI Act”) is likely to have a profound impact on the development and utilization of artificial intelligence systems. Anonymization, particularly in the form of synthetic data, will play a pivotal role in establishing AI compliance and addressing the myriad challenges posed by the widespread use of AI systems.
This blog post offers an introductory overview of the primary features and objectives of the draft EU AI Act. It also elaborates on the indispensable role of synthetic data in ensuring AI compliance with data management obligations, especially for high-risk AI systems.
Notably, we focus on the European Parliament’s report on the proposal for a regulation of the European Parliament and the Council, which lays down harmonized rules on Artificial Intelligence (the Artificial Intelligence Act) and amends certain Union Legislative Acts (COM(2021)0206 – C9-0146/2021 – 2021/0106(COD)). It's important to note that this isn't the final text of the AI Act.
The first comprehensive regulation for AI compliance
The draft AI Act is a hotly debated legal initiative that will apply to providers and deployers of AI systems, among others. Remarkably, it is set to become the world's first comprehensive mandatory legal framework for AI. This will directly impact researchers, developers, businesses, and citizens involved in or affected by AI. AI compliance is a brand new domain that will transform the way companies manage their data.
The choice: AI compliance or costly consequences
Much like the GDPR, failure to comply with the AI Act's obligations can have substantial financial repercussions: maximum fines for non-compliance under the draft AI Act can be nearly double those under the GDPR. Depending on the severity and duration of the violation, penalties can range from warnings to fines of up to 7% of the offender's annual worldwide turnover.
Additionally, national authorities can order the withdrawal or recall of non-compliant AI systems from the market or impose temporary or permanent bans on their use. AI compliance is set to become a serious financial issue for companies doing business in the EU.
Risk-based classification
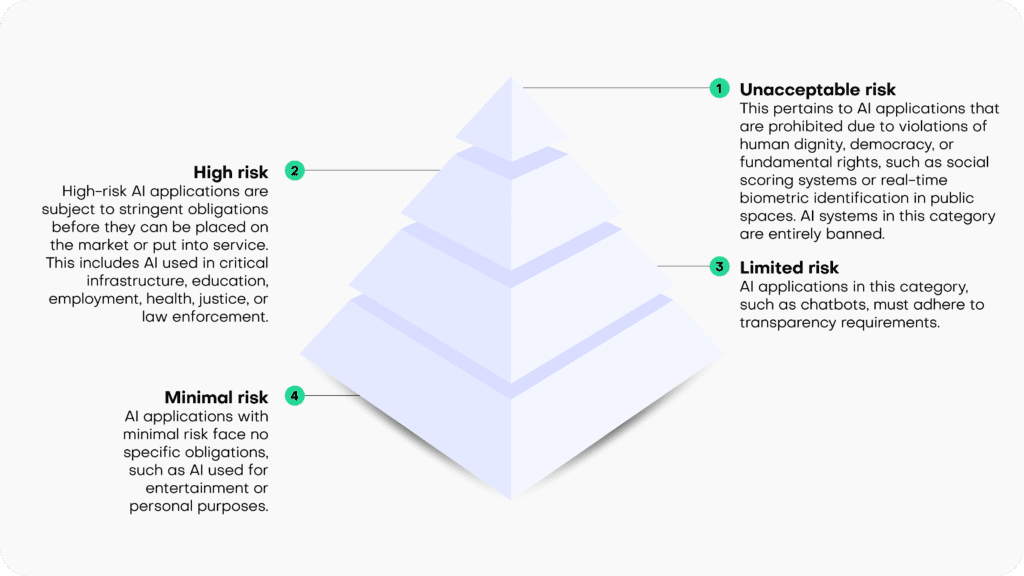
The draft EU AI Act operates on the principle that the level of regulation should align with the level of risk posed by an AI system. It categorizes AI systems into four risk categories:
- Unacceptable risk: This pertains to AI applications that are prohibited due to violations of human dignity, democracy, or fundamental rights, such as social scoring systems or real-time biometric identification in public spaces. AI systems in this category are entirely banned.
- High risk: High-risk AI applications are subject to stringent obligations before they can be placed on the market or put into service. This includes AI used in critical infrastructure, education, employment, health, justice, or law enforcement.
- Limited risk: AI applications in this category, such as chatbots, must adhere to transparency requirements.
- Minimal risk: AI applications with minimal risk face no specific obligations, such as AI used for entertainment or personal purposes.
Synthetic solutions for AI compliance
The draft AI Act focuses its regulatory efforts on high-risk AI systems, imposing numerous obligations on them. These obligations encompass ensuring the robustness, security, and accuracy of AI systems. It also mandates the ability to correct or deactivate the system in case of errors or risks, as well as implementing human oversight and intervention mechanisms to prevent or mitigate harm or adverse impacts, as well as a number of additional requirements.
Specifically, under the heading “Data and data governance”, Art. 10 sets out strict quality criteria for training, validation and testing data sets (“data sets”) used as a basis for the development of “[h]igh-risk AI systems which make use of techniques involving the training of models with data” (which likely encompasses most high-risk AI systems).
According to Art 10(2), the respective data sets shall be subject to appropriate data governance and management practices. This includes, among other things, an examination of possible biases that are likely to affect the health and safety of persons, negatively impact fundamental rights, or lead to discrimination (especially with regard to feedback loops), and requires the application of appropriate measures to detect, prevent, and mitigate possible biases. Not surprisingly, AI compliance will start with the underlying data.
Pursuant to Art 10 (3), data sets shall be “relevant, sufficiently representative, appropriately vetted for errors and as complete as possible in view of the intended purpose” and shall “have the appropriate statistical properties […]“.
Art 10(5) specifically stands out in the data governance context, as it contains a legal basis for the processing of sensitive data, as protected, among other provisions, by Art 9(1) GDPR: Art 10(5) entitles high-risk AI system providers, to the extent that is strictly necessary for the purposes of ensuring negative bias detection and correction, to exceptionally process sensitive personal data. However, such data processing must be subject to “appropriate safeguards for the fundamental rights and freedoms of natural persons, including technical limitations on the re-use and use of state-of-the-art security and privacy-preserving [measures]“.
Art 10(5)(a-g) sets out specific conditions which are prerequisites for the processing of sensitive data in this context. The very first condition, as stipulated in Art 10(5)(a) sets the scene: the data processing under Art 10 is only allowed if its goal, namely bias detection and correction “cannot be effectively fulfilled by processing synthetic or anonymised data”. Conversely, if an AI system provider is able detect and correct bias by using synthetic or anonymized data, it is required to do so and cannot rely on other “appropriate safeguards”.
The distinction between synthetic and anonymized data in the parliamentary draft of the AI Act is somewhat confusing, since considering the provision’s purpose, arguably only anonymized synthetic data qualifies as preferred method for tackling data bias. However, since anonymized synthetic data is a sub-category of anonymized data, the differentiation between those two terms is meaningless, unless the EU legislator attempts to highlight synthetic data as the preferred version of anonymized data (in which case the text of the provision should arguably read “synthetic or other forms of anonymized data”).
Irrespective of such details, it is clear that the EU legislator clearly requires the use of anonymized data for the processing of sensitive data as a primary bias detection and correction tool. It looks like AI compliance cannot be achieved without effective and AI-friendly data anonymization tools.
Recital 45(a) supports this (and extends the synthetic data use case to privacy protection and also addresses AI-system users, instead of only AI system providers):
“The right to privacy and to protection of personal data must be guaranteed throughout the entire lifecycle of the AI system. In this regard, the principles of data minimization and data protection by design and by default, as set out in Union data protection law, are essential when the processing of data involves significant risks to the fundamental rights of individuals.
Providers and users of AI systems should implement state-of-the-art technical and organizational measures in order to protect those rights. Such measures should include not only anonymization and encryption, but also the use of increasingly available technology that permits algorithms to be brought to the data and allows valuable insights to be derived without the transmission between parties or unnecessary copying of the raw or structured data themselves.”
The inclusion of synthetic data in the draft AI Act is a continuation of the ever-growing political awareness of the technology’s potential. This is underlined by a recent statement made by the EU Commission’s Joint Research Committee: “[Synthetic data] not only can be shared freely, but also can help rebalance under-represented classes in research studies via oversampling, making it the perfect input into machine learning and AI models."
Synthetic data is set to become one of the cornerstones of AI compliance in the very near future.
In this tutorial, you will learn how to use synthetic data to explore and validate a machine-learning model that was trained on real data. Synthetic data is not restricted by any privacy concerns and therefore enables you to engage a far broader group of stakeholders and communities in the model explanation and validation process. This enhances transparent algorithmic auditing and helps to ensure the safety of developed ML-powered systems through the practice of Explainable AI (XAI).
We will start by training a machine learning model on a real dataset. We will then evaluate and inspect this model using a synthesized (and therefore privacy-preserving) version of the dataset. This is also referred to as the Train-Real-Test-Synthetic methodology. We will then inspect the ML model using the synthetic data to better understand how the model makes its predictions. The Python code for this tutorial is publicly available and runnable in this Google Colab notebook.
Train model on real data
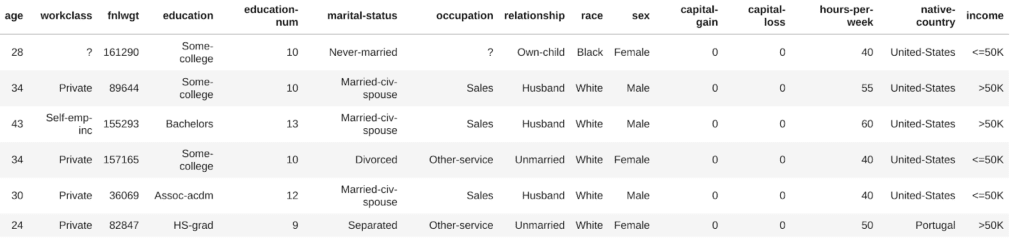
The first step will be to train a LightGBM model on a real dataset. You’ll be working with a subset of the UCI Adult Income dataset, consisting of 10,000 records and 10 attributes. The target feature is the income column which is a Boolean feature indicating whether the record is high-income (>50K) or not. Your machine learning model will use the 9 remaining predictor features to predict this target feature.
# load original (real) data
import numpy as np
import pandas as pd

df = pd.read_csv(f'{repo}/census.csv')
df.head(5)
And then use the following code block to define the target feature, preprocess the data and train the LightGBM model:
import lightgbm as lgb
from lightgbm import early_stopping
from sklearn.model_selection import train_test_split

target_col = 'income'
target_val = '>50K'

def prepare_xy(df):
    y = (df[target_col]==target_val).astype(int)
    str_cols = [
        col for col in df.select_dtypes(['object', 'string']).columns if col != target_col
    ]
    for col in str_cols:
        df[col] = pd.Categorical(df[col])
    cat_cols = [
        col for col in df.select_dtypes('category').columns if col != target_col
    ]
    num_cols = [
        col for col in df.select_dtypes('number').columns if col != target_col
    ]
    for col in num_cols:
        df[col] = df[col].astype('float')
    X = df[cat_cols + num_cols]
    return X, y

def train_model(X, y):
    cat_cols = list(X.select_dtypes('category').columns)
    X_trn, X_val, y_trn, y_val = train_test_split(
        X, y, test_size=0.2, random_state=1
    )
    ds_trn = lgb.Dataset(
        X_trn,
        label=y_trn,
        categorical_feature=cat_cols,
        free_raw_data=False
    )
    ds_val = lgb.Dataset(
        X_val,
        label=y_val,
        categorical_feature=cat_cols,
        free_raw_data=False
    )
    model = lgb.train(
        params={
            'verbose': -1,
            'metric': 'auc',
            'objective': 'binary'
        },
        train_set=ds_trn,
        valid_sets=[ds_val],
        callbacks=[early_stopping(5)],
    )
    return model
Run the code lines below to preprocess the data, train the model and calculate the AUC performance metric score:
X, y = prepare_xy(df)
model = train_model(X, y)
Training until validation scores don't improve for 5 rounds
Early stopping, best iteration is: [63] valid_0's auc: 0.917156
The model has an AUC score of 91.7%, indicating excellent predictive performance. Take note of this in order to compare it to the performance of the model on the synthetic data later on.
Explainable AI: privacy concerns and regulations
Now that you have your well-performing machine learning model, chances are you will want to share the results with a broader group of stakeholders. As concerns and regulations about privacy and the inner workings of so-called “black box” ML models increase, it may even be necessary to subject your final model to a thorough auditing process. In such cases, you generally want to avoid using the original dataset to validate or explain the model, as this would risk leaking private information about the records included in the dataset.
So instead, in the next steps you will learn how to use a synthetic version of the original dataset to audit and explain the model. This will guarantee the maximum amount of privacy preservation possible. Note that it is crucial for your synthetic dataset to be accurate and statistically representative of the original dataset. We want to maintain the statistical characteristics of the original data but remove the privacy risks. MOSTLY AI provides some of the most accurate and secure data synthesization in the industry.
Synthesize dataset using MOSTLY AI
Follow the steps below to download the original dataset and synthesize it via MOSTLY A’s synthetic data generator:
- Download
census.csvby clicking here, and then save the file to disk by pressing Ctrl+S or Cmd+S, depending on your operating system.

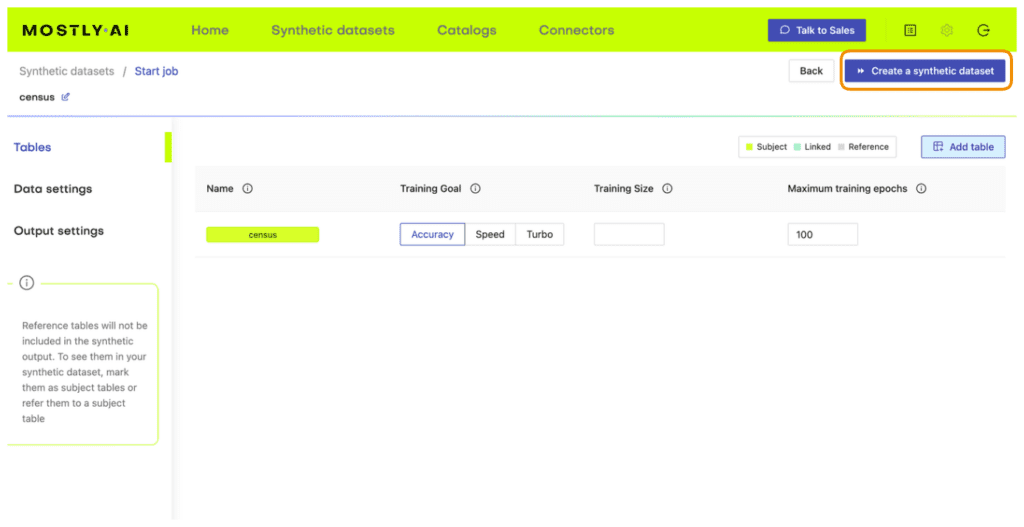
- Navigate to your MOSTLY AI account, click on the “Synthetic Datasets” tab, and upload
census.csvhere.
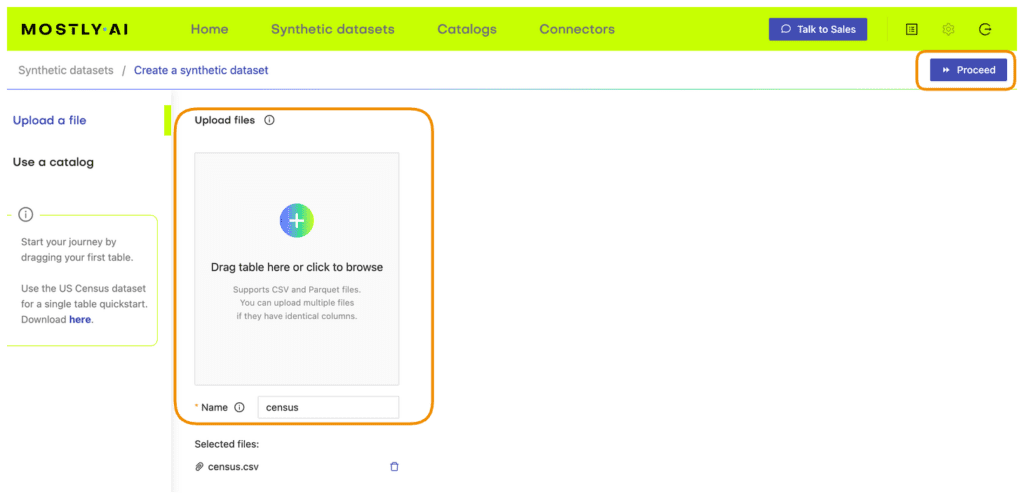
- Synthesize
census.csv, leaving all the default settings.
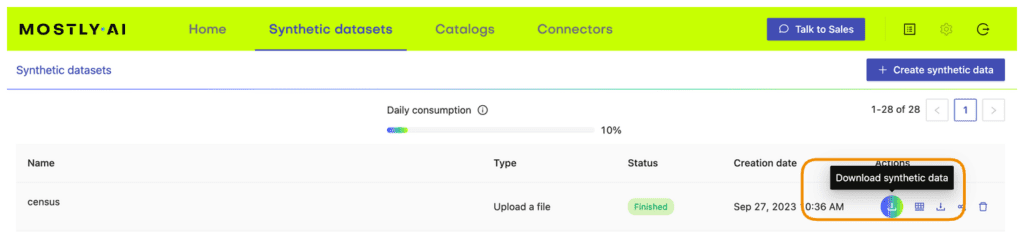
- Once the job has finished, download the generated synthetic data as a CSV file to your computer.
- Access the generated synthetic data from wherever you are running your code. If you are running in Google Colab, you will need to upload it by executing the next cell.
# upload synthetic dataset
if is_colab:
    import io
    uploaded = files.upload()
    syn = pd.read_csv(io.BytesIO(list(uploaded.values())[0]))
    print(f"uploaded synthetic data with {syn.shape[0]:,} records and {syn.shape[1]:,} attributes")
else:
    syn_file_path = './census-synthetic.csv'
    syn = pd.read_csv(syn_file_path)
    print(f"read synthetic data with {syn.shape[0]:,} records and {syn.shape[1]:,} attributes")
You can now poke around and explore the synthetic dataset, for example by sampling 5 random records. You can run the line below multiple times to see different samples.
syn.sample(5)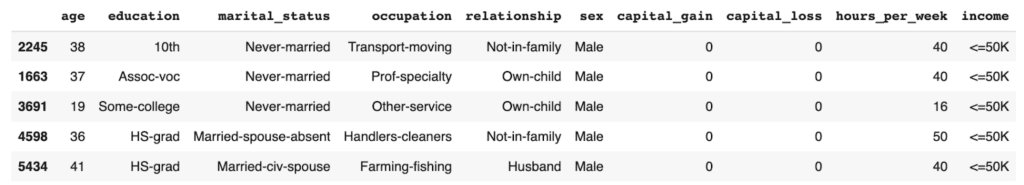
The records in the syn dataset are synthesized, which means they are entirely fictional (and do not contain private information) but do follow the statistical distributions of the original dataset.
Evaluate ML performance using synthetic data
Now that you have your synthesized version of the UCI Adult Income dataset, you can use it to evaluate the performance of the LightGBM model you trained above on the real dataset.
The code block below preprocesses the data calculates performance metrics for the LightGBM model using the synthetic dataset, and visualizes the predictions on a bar plot:
from sklearn.metrics import roc_auc_score, accuracy_score
import seaborn as sns
import matplotlib.pyplot as plt

X_syn, y_syn = prepare_xy(syn)
p_syn = model.predict(X_syn)
auc = roc_auc_score(y_syn, p_syn)
acc = accuracy_score(y_syn, (p_syn >= 0.5).astype(int))
probs_df = pd.concat([
    pd.Series(p_syn, name='probability').reset_index(drop=True),
    pd.Series(y_syn, name=target_col).reset_index(drop=True),
], axis=1)
fig = sns.displot(data=probs_df, x='probability', hue=target_col, bins=20, multiple="stack")
fig = plt.title(f"Accuracy: {acc:.1%}, AUC: {auc:.1%}", fontsize=20)
plt.show()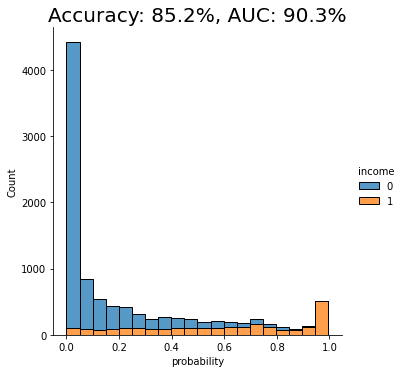
We see that the AUC score of the model on the synthetic dataset comes close to that of the original dataset, both around 91%. This is a good indication that our synthetic data is accurately modeling the statistical characteristics of the original dataset.
Explain ML Model using Synthetic Data
We will be using the SHAP library to perform our model explanation and validation: a state-of-the-art Python library for explainable AI. If you want to learn more about the library or explainable AI fundamentals in general, we recommend checking out the SHAP documentation and/or the Interpretable ML Book.
The important thing to note here is that from this point onwards, we no longer need access to the original data. Our machine-learning model has been trained on the original dataset but we will be explaining and inspecting it using the synthesized version of the dataset. This means that the auditing and explanation process can be shared with a wide range of stakeholders and communities without concerns about revealing privacy-sensitive information. This is the real value of using synthetic data in your explainable AI practice.
SHAP feature importance
Feature importances are a great first step in better understanding how a machine learning model arrives at its predictions. The resulting bar plots will indicate how much each feature in the dataset contributes to the model’s final prediction.
To start, you will need to import the SHAP library and calculate the so-called shap values. These values will be needed in all of the following model explanation steps.
# import library
import shap
# instantiate explainer and calculate shap values
explainer = shap.TreeExplainer(model)
shap_values = explainer.shap_values(X_syn)
You can then plot the feature importances for our trained model:
shap.initjs()
shap.summary_plot(shap_values, X_syn, plot_size=0.2)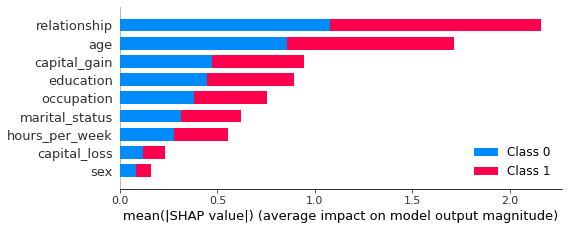
In this plot, we see clearly that both the relationship and age features contribute strongly to the model’s prediction. Perhaps surprisingly, the sex feature contributes the least strongly. This may be counterintuitive and, therefore, valuable information. Without this plot, stakeholders may draw their own (possibly incorrect) conclusions about the relative importance of the sex feature in predicting the income of respondents in the dataset.
SHAP dependency plots
To get even closer to explainable AI and to get an even more fine-grained understanding of how your machine learning model is making its predictions, let’s proceed to create dependency plots. Dependency plots tell us more about the effect that a single feature has on the ML model’s predictions.
A plot is generated for each feature, with all possible values of that feature on the x-axis and the corresponding shap value on the y-axis. The shap value is an indication of how much knowing the value of that particular feature affects the outcome of the model. For a more in-depth explanation of how shap values work, check out the SHAP documentation.
The code block below plots the dependency plots for all the predictor features in the dataset:
def plot_shap_dependency(col):
    col_idx = [
        i for i in range(X_syn.shape[1]) if X_syn.columns[i]==col][0]
    shp_vals = (
        pd.Series(shap_values[1][:,col_idx], name='shap_value'))
    col_vals = (
        X_syn.iloc[:,col_idx].reset_index(drop=True))
    df = pd.concat([shp_vals, col_vals], axis=1)
    if col_vals.dtype.name != 'category':
        q01 = df[col].quantile(0.01)
        q99 = df[col].quantile(0.99)
        df = df.loc[(df[col] >= q01) & (df[col] <= q99), :]
    else:
        sorted_cats = list(
            df.groupby(col)['shap_value'].mean().sort_values().index)
        df[col] = df[col].cat.reorder_categories(sorted_cats, ordered=True)
    fig, ax = plt.subplots(figsize=(8, 4))
    plt.ylim(-3.2, 3.2)
    plt.title(col)
    plt.xlabel('')
    if col_vals.dtype.name == 'category':
        plt.xticks(rotation = 90)
    ax.tick_params(axis='both', which='major', labelsize=8)
    ax.tick_params(axis='both', which='minor', labelsize=6)
    p1 = sns.lineplot(x=df[col], y=df['shap_value'], color='black').axhline(0, color='gray', alpha=1, lw=0.5)
    p2 = sns.scatterplot(x=df[col], y=df['shap_value'], alpha=0.1)

def plot_shap_dependencies():
    top_features = list(reversed(X_syn.columns[np.argsort(np.mean(np.abs(shap_values[1]), axis=0))]))
    for col in top_features:
        plot_shap_dependency(col)

plot_shap_dependencies()
Let’s take a closer look at the dependency plot for the relationship feature:
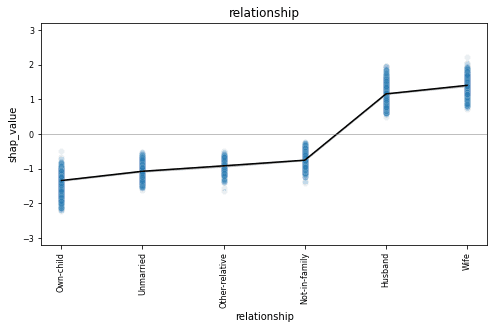
The relationship column is a categorical feature and we see all 6 possible values along the x-axis. The dependency plot shows clearly that records containing “husband” or “wife” as the relationship value are far more likely to be classified as high-income (positive shap value). The black line connects the average shap values for each relationship type, and the blue gradient is actually the shap value of each of the 10K data points in the dataset. This way, we also get a sense of the variation in the lift.
This becomes even more clear when we look at a feature with more discrete values, such as the age column.
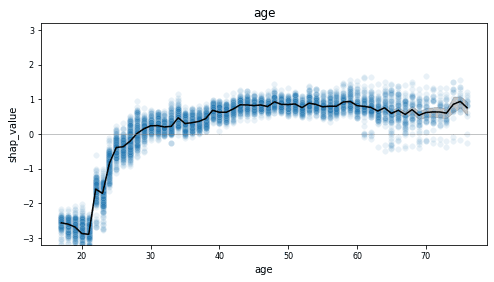
This dependency plot shows us that the likelihood of a record being high-income increases together with age. As the value of age decreases from 28 to 18, we see (on average) an increasingly lower chance of being high-income. From around 29 and above, we see an increasingly higher chance of being high-income, which stables out around 50. Notice the wide range of values once the value of age exceeds 60, indicating a large variance.
Go ahead and inspect the dependency plots for the other features on your own. What do you notice?
SHAP values for synthetic samples
The two model explanation methods you have just worked through aggregate their results over all the records in the dataset. But what if you are interested in digging even deeper down to uncover how the model arrives at specific individual predictions? This level of reasoning and inspection at the level of individual records would not be possible with the original real data, as this contains privacy-sensitive information and cannot be safely shared. Synthetic data ensures privacy protection and enables you to share model explanations and inspections at any scale. Explainable AI needs to be shareable and transparent - synthetic data is the key to this transparency.
Let’s start by looking at a random prediction:
# define function to inspect random prediction
def show_idx(i):
    shap.initjs()
    df = X_syn.iloc[i:i+1, :]
    df.insert(0, 'actual', y_syn.iloc[i])
    df.insert(1, 'score', p_syn[i])
    display(df)
    return shap.force_plot(explainer.expected_value[1], shap_values[1][i,:], X_syn.iloc[i,:], link="logit")

# inspect random prediction
rnd_idx = X_syn.sample().index[0]
show_idx(rnd_idx)
The output shows us a random record with an actual score of 0, meaning this is a low-income (<50K) record. The model scores all predictions with a value between 0 and 1, where 0 is a perfect low-income prediction and 1 is a perfect high-income prediction. For this sample, the model has given a prediction score of 0.17, which is quite close to the actual score. In the red-and-blue bars below the data table, we can see how different features contributed to this prediction. We can see that the values of the relationship and marital status pushed this sample towards a lower prediction score, whereas the education, occupation, capital_loss, and age features pushed for a slightly higher prediction score.
You can repeat this single-sample inspection method for specific types of samples, such as the sample with the lowest/highest prediction score:
idx = np.argsort(p_syn)[0]
show_idx(idx)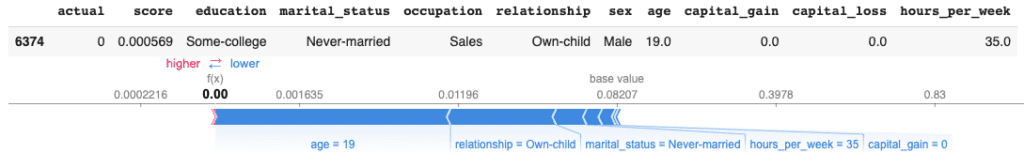
Or a sample with particular characteristics of interest, such as a young female doctorate under the age of 30:
idx = syn[
    (syn.education=='Doctorate')
    & (syn.sex=='Female')
    & (syn.age<=30)].sample().index[0]
show_idx(idx)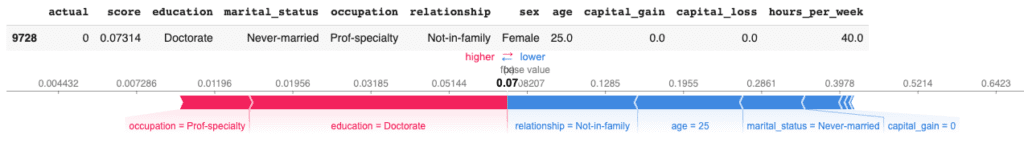
You can also zoom back out again to explore the shap values across a larger number of samples. For example, you can aggregate the shap values of 1,000 samples using the code below:
shap.initjs()
shap.force_plot(explainer.expected_value[1], shap_values[1][:1000,:], X.iloc[:1000,:], link="logit")
This view enables you to look through a larger number of samples and inspect the relative contributions of the predictor features to each individual sample.
Explainable AI with MOSTLY AI
In this tutorial, you have seen how machine learning models that have been trained on real data can be safely tested and explained with synthetic data. You have learned how to synthesize an original dataset using MOSTLY AI and how to use this synthetic dataset to inspect and explain the predictions of a machine learning model trained on the real data. Using the SHAP library, you have gained a better understanding of how the model arrives at its predictions and have even been able to inspect how this works for individual records, something that would not be safe to do with the privacy-sensitive original dataset.
Synthetic data ensures privacy protection and therefore enables you to share machine learning auditing and explanation processes with a significantly larger group of stakeholders. This is a key part of the explainable AI concept, enabling us to build safe and smart algorithms that have a significant impact on individuals' lives.
What’s next?
In addition to walking through the above instructions, we suggest experimenting with the following in order to get even more hands-on experience using synthetic data for explainable AI:
- replicate the explainability section with real data and compare results
- use a different dataset, eg. the UCI bank marketing dataset
- use a different ML model, eg. a RandomForest model
You can also head straight to the other synthetic data tutorials:
- Rebalancing your data for ML classification problems
- Optimize training size for synthetic data accuracy
- Evaluate synthetic data quality using downstream ML
MOSTLY AI has recently been mentioned in an excellent article about synthetic data by the MIT Technology Review. We are honored to have been featured and would like to elaborate on some topics Karen Hao, the renowned AI journalist, raised.
On synthetic data's potential for fair AI
As the article states, extrapolating new data from an existing data set indeed reproduces the biases embedded in the original. However, it is possible to augment the data to make it fairer via synthetization. For example, our team fixed the racial bias in the infamous Compas recidivism data set and reduced the racial difference in the data from 24% to a mere 1% by introducing demographic parity through the synthetization process. Thus, our research proves that it is indeed possible to synthesize near bias-free versions of your data.
According to Christo Wilson, an associate professor of computer science at Northeastern University, perfectly balanced data sets don't automatically translate into perfectly fair AI systems. They don't. That is exactly why you need synthetic data. Simply upping subject numbers for minorities or removing sensitive categories like race does not solve the issue. Synthetization, on the other hand, is capable of fixing biases in a holistic way, regenerating data to reflect reality not as it is but as we would like to see it.
As long as you are aware of your biases and your definition of fairness is solid and fits the specific case you are looking at, you can create a data set that satisfies these constraints. If you are curious and would like to know more, check out our fair synthetic data research poster presented at the ICLR 2021 machine learning conference!
Synthetic data for explainable AI
The article quotes one of our favorite ethical AI activists, Cathy O'Neil: 'As regulators confront the need to test AI systems for legal compliance, it could be the only approach that gives them the flexibility they need to generate on-demand, targeted testing data.' Indeed, the role of synthetic data is about to become even more pronounced with the upcoming AI regulations looming over Europe and elsewhere. Synthetic data can provide local interpretability to AI systems, essentially functioning as a window into the workings of an algorithm. If you are curious about how synthetic data can power explainable AI in practical terms, check out our recent synthetic data for XAI manifesto!
To the future of synthetic data and beyond
Cathy O'Neil says, 'Synthetic data is likely to get better over time, but not by accident.' We couldn't agree more, and our world-class team of scientists and engineers is constantly working on just that. If you would like to be there when synthetic data breakthroughs happen, sign up for the MOSTLY AI newsletter!
Last year MOSTLY AI has introduced and demonstrated the groundbreaking idea of generating fair synthetic data. I.e., data, that is representative of the real world, but that has unwanted biases, unwanted relations, surgically removed from it at the same time. Machine learning models that are then trained on fair synthetic data will be fair by design. It’s a thought-provoking paradigm shift, that will allow organizations to govern not only Privacy but also Fairness within AI at its source, that is the AI training data itself.
Fast forward to today, we are excited to see many things happening around fairness:
- The broad public interest in fairness and AI bias has drastically picked up, resulting in media coverage, documentaries, books, public debates, analyst reports, etc.
- The regulators are becoming active, with most notably the European Commission proposing an AI regulation, that explicitly demands that training data shall be fair & representative. US regulators are expected to follow suit, particularly within high-risk domains, like finance and health care.
- Leading AI conferences, like the ICLR, expand beyond accuracy and dedicate workshops to ethics, like Responsible AI or Synthetic Data for Privacy.
Speaking of ICLR, we had the honor to present our work on fair synthetic data at this year’s conference. This is another recognition of our work, which was already featured by Andrew Ng, IEEE Spectrum, Forbes, Slate, and many more. While the corresponding research paper is now available on arxiv.org, and the Fair Synthetic Data poster is accessible here, we summarize the key take aways once more:
- MOSTLY AI’s technology allows to generate Synthetic Data that is both statistical representative as well as fair - in the sense that it adheres to provided fairness constraints
- The trade-off between representativeness and fairness can be explicitly controlled for.
- Hidden proxy variables (e.g., body height serving as proxy for gender, or ZIP codes for race), which pose a significant challenge in combating biases, are successfully controlled for.
- And fairness can be established while only marginally impacting the downstream machine learning utility. One thus does not need to compromise significantly on accuracy in the pursuit of Ethical AI. Find out how to create fair synthetic data from our earlier blog post!
Last but not least, and as further testimony to the validity of the approach, Amazon just published a paper on fast fair synthetic data as well. And as their study leverages the same US census data as our paper, it allows for a direct comparison of results. We always knew that the quality of our synthetic data is unparalleled, but even we were amazed to see the effectiveness of our approach, as we excel on every single available dimension of realism, accuracy, as well as fairness:
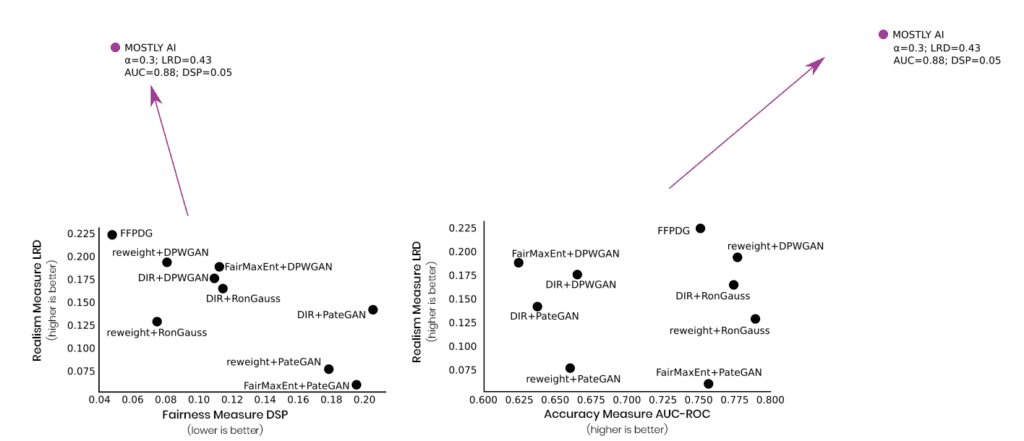
So, if Ethical AI is a priority for your organization or you deploy AI algorithms that directly impact the lives of individuals, then talk to us, and let’s discuss how we can get you started with fair synthetic data today. If you would like to learn more about fair synthetic data, read our Fairness Series!
Co-Authors: Alexandra Ebert & Daniel Soukup
In the previous part of this series, we have discussed two risks entailed in the rise of digitalization and artificial intelligence: the violation of the privacy and fairness of individuals. We have also outlined our approach to mitigate privacy and fairness risks with bias-corrected synthetic data: this allows for privacy-preserving data sharing and also aids the fair treatment of customers (data subjects) in downstream analysis and machine-learning tasks. (By the way, if you would like to experiment with fair synthetic data yourself, you can download the datasets we created at the bottom of the page.)
If you would like to dig deeper into algorithmic fairness and the potential risks in machine learning systems, we can highly recommend The Ethical Algorithm book by M. Kearns and A. Roth. For a more technical viewpoint, check out fairmlbook.org to find lecture notes, videos, and other great resources.
In this blog post, we take a deeper dive into our approach to de-bias synthetic data. For now, we focus on statistical parity as a fairness measure and show in detail the effects of our approach in two settings:
- the Adult US census data set, which is an extract of the 1994 US Census database, and
- the Compas recidivism data set that was the focus of ProPublica’s high profile machine bias study.
Read the other parts of the series:
- Part 1 - Why Bias in AI is a Problem & Why Business Leaders Should Care
- Part 2 - 10 Reasons For Bias In AI And What To Do About It
- Part 3 - We Want Fair AI Algorithms – But How To Define Fairness?
- Part 4 - Tackling AI Bias At Its Source – With Fair Synthetic Data
Statistical Parity as a Measure of Fairness
Let’s start with a quick reminder: a data set or algorithm being unfair usually refers to some kind of imbalance. A rather intuitive measure for such an imbalance is the so-called statistical or demographic parity. In mathematical terms, we can describe it as follows: consider a population that can be split into groups by a sensitive attribute S, such as gender, skin color, age or any other property. Then consider another target attribute T that contains sensitive information on the population such as income, whether or not people spent time in prison or credit history.
In the Adult data set, we select the sensitive attribute (S) gender, either “female” or “male”, and the target attribute (T) income, which is either “>50k” or “<=50k”.
In this example, statistical parity is satisfied when the number of females that earn more than 50K divided by the total count of females equals the number of males earning more than 50K divided by the total number of males:

In other words, the probability that a randomly chosen male is a high earner should be the same as the probability of a random female being a high earner. Also, note that when these two fractions are equal for the high-income segment (“>50K”) then this automatically holds true for the low-income segment (“<=50K”) as well.
In the real world, unfortunately, the equality above does not hold true. A simple visualization of the data set reveals a strong imbalance between females and males (Fig 2).
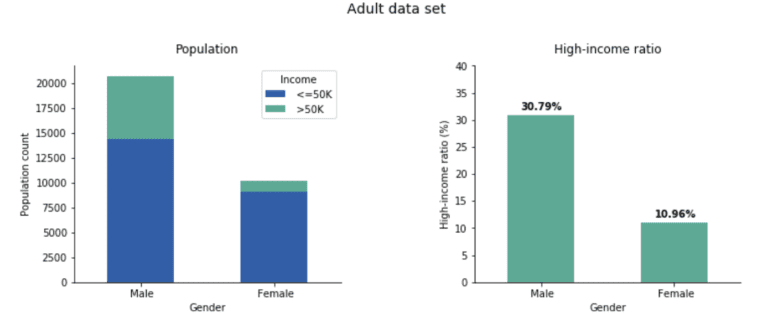
Only 10.96% of women are in the high-income range while among men, the fraction is 30.79%, almost three times higher. In the remainder of the blog post, we show how to create a fair, synthetic version of the Adult data set that removes the income gap between these two gender groups.
Though being intuitive, parity has limitations especially in the context of fair algorithmic decision making. We are aware of these shortcomings, some of which we mentioned in our fairness definitions post already, and we will discuss alternative fairness measures at the end of this blog post.
Generating a Fair Dataset
One of the first ideas to try when creating a fair data set for machine learning is to drop the sensitive column. In the presented case that’s the “sex” attribute. At first sight, this sounds like a good and easy-to-implement solution but, unfortunately, it can actually cause more harm than good. On one hand, what makes this approach fail can be so-called proxy or hidden proxy columns. Imagine we know which neighborhood a person lives in, the brand and model of the person’s mobile phone, the car this person drives, where this person buys her/his clothes, etc. Given some of the above information, we humans can make a pretty educated guess on this person’s sex, skin color, and other attributes. And since algorithms are better in analyzing patterns like this, they will definitely detect these correlations and exploit them, leading again to unfair predictions and decisions. We could actually go one step further and say that leaving the “sex” column in the data set is better for fairness because it offers a clear handle to enforce fairness constraints such as statistical parity. To give another example from criminal justice, women on average are less likely to commit future violent crimes than men with similar criminal records. So, a gender-neutral assessment can overestimate a woman’s recidivism risk.
Our synthetic data platform's community version is free to use and leverages deep neural networks to produce synthetic data. In order to generate fair synthetic data, we add a fairness constraint to the model parameter optimization during training. Sticking with the Adult data set, we penalize the violation of statistical parity within every mini-batch by increasing the training loss by a number that is proportional to the difference between the fraction of women and the fraction of men in the high-income segment. A very similar approach for training fair classifiers is described in a paper by P. Manisha and S. Gujar and an implementation can be found at Y. Shavit’s github repo.
In more general terms, adding the fairness constraint expands the objective of our software from generating accurate and private synthetic data to generating accurate, private, and fair synthetic data.
Private and Fair Synthetic Data
After feeding the Adult data set to our software and training it with the additional parity fairness constraint in place, we generate a synthetic fair version of the Adult data set. Once we evaluate the income distribution, we see a major change: the income gap almost disappeared (Fig 3).

Actually, we repeated the whole process 50 times and the plotted numbers are the average ratios over these independent runs. The income-ratios slightly varied across the 50 experiments but this variance (rooted in the stochastic nature of our training and generation process) was quite small: 1.2% and 1.3% for the Male and Female ratios, respectively. As apparent from the plots, the synthesis corrected the income gap: 25% of the synthetic males are high earners (instead of the real 30%) and 22% of the synthetic females are high earners (while the original value was 11% only).
With regards to parity, it is common to compare not just the difference but the fraction of high-income male ratio to high-income female ratio (that is, we divide the two sides of the above equation). This fraction is called the disparate impact and it is an industry-standard to ask for at least 0.8, the so-called four-fifth rule. In the original data set, this fraction is roughly 10/30 = 0.33, a quite severe disparate impact violation but the bias-corrected synthetic data is at 22/25 = 0.88, well over the threshold.
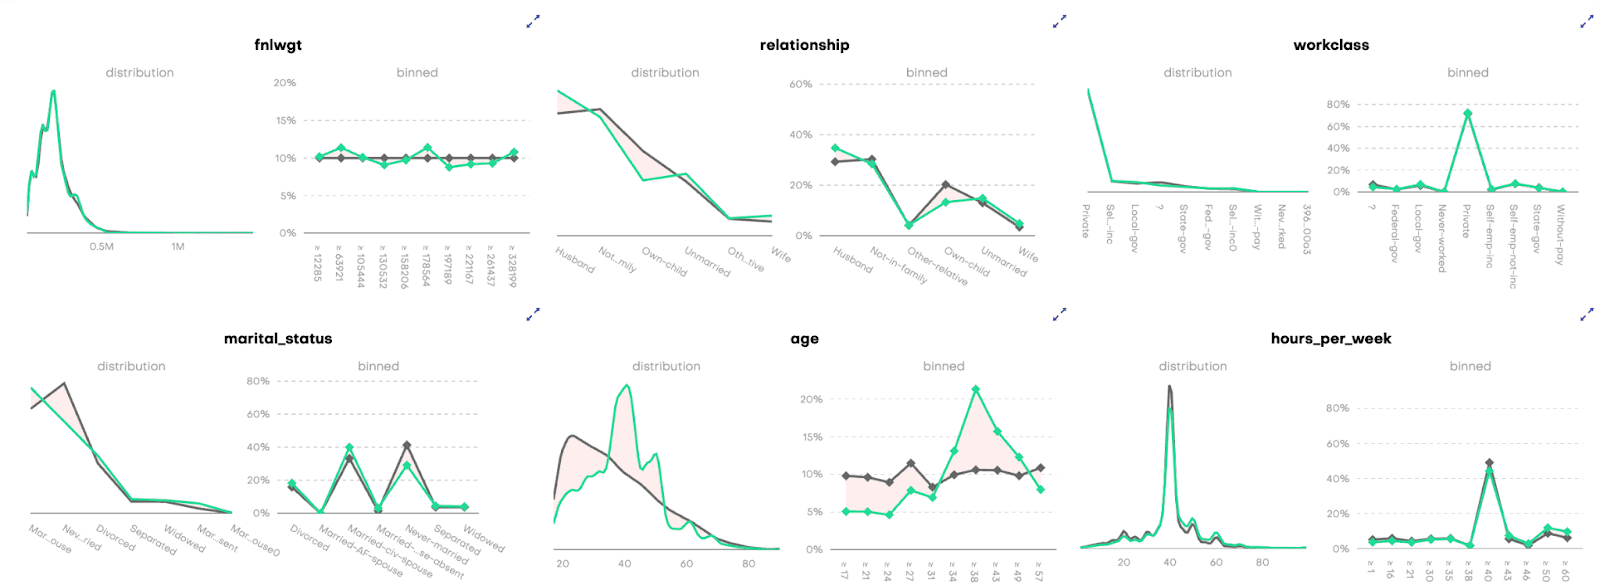
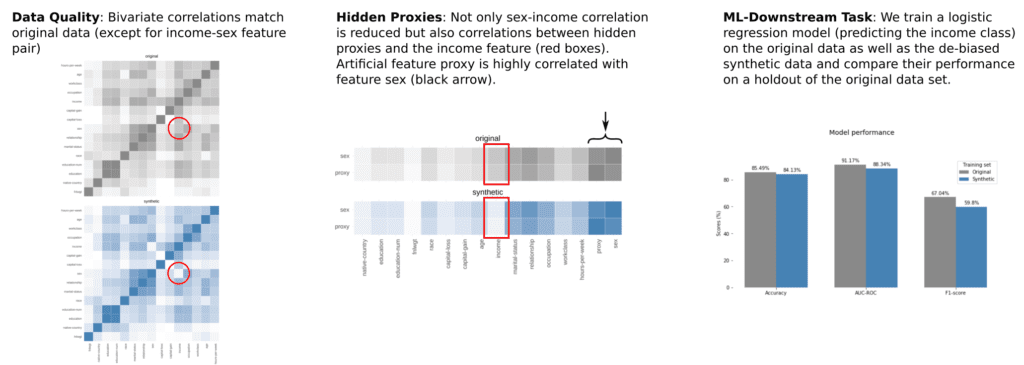
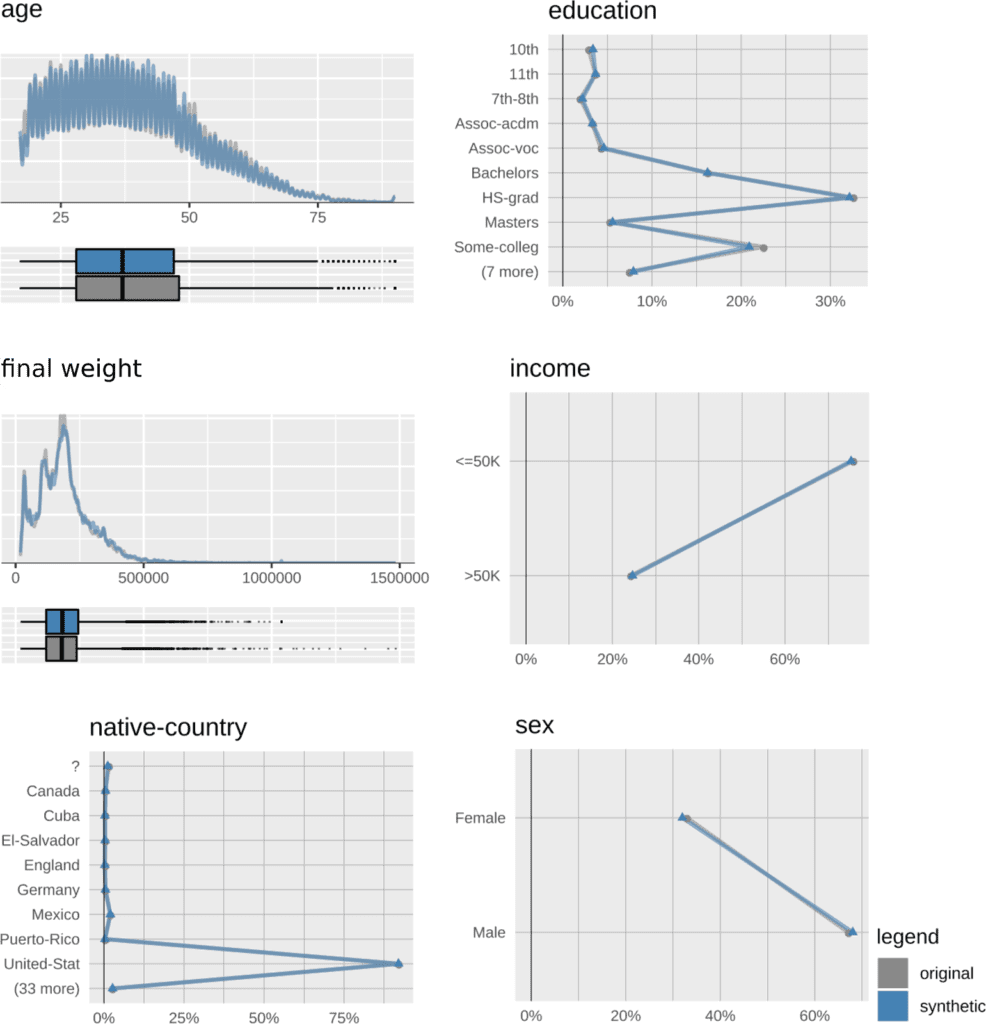
The additional parity constraint during model training does not diminish the quality and accuracy of the synthetic data. Univariate distributions of the synthetic-data attributes almost perfectly match their original counterparts (in Figure 4, we show only a selection). Please note that, while parity is modified to a large degree, both the population-wide male-to-female ratio, as well as the high-earner-to-low-earner ratios, are preserved.
Also the bivariate correlations of the synthetic data, on first sight, seem to be in excellent agreement with the original data (Figure 5).

A closer look, however, reveals some detailed changes due to the inner workings of the fairness constraint. Given the statistical parity definition, “income” must not depend on “sex”, which means these two attributes should not be correlated.
While in the original data, there is a clear “sex”-”income” correlation (red circle in the left plot in Figure 5) this dependency is almost reduced to noise level in the fair, synthetic data (red circle in the right plot in Figure 5). Apart from the “sex”-”income” pair, no other correlation seems to be altered by applying the fairness constraint, at least not strong enough to show a visible effect on the correlation plot.
But what about proxy attributes, columns in the data set that are correlated with “sex” and “income”? Can they introduce unfairness through a backdoor, as they are not explicitly mentioned in the parity constraint? Recall that the “parity equation” (see Equation 1) contains the attributes “sex” and “income” only.
To visualize the effect of the parity constraint on proxy attributes, we add an artificial feature to the Adult data set named “proxy”. We generated this column so that it is strongly correlated with the attribute “sex”. For females, “proxy” equals to 1 in 90% of all cases and equals to 0 for the remaining 10%. For males, the percentages are swapped. Looking at this new data set, we see, first, the strong correlation between “sex” and “proxy” (the black arrow on the left-hand side plot of Figure 6). Second, as these two attributes are strongly linked, also their correlation to “income” is comparable (the red arrow on the left-hand side plot of Figure 6). Now, when we run our synthetic data solution with the fairness constraint in place on “sex” only, we find that in the fair synthetic data both correlations “sex”-”income” and “proxy”-”income” are almost reduced to noise level (the red arrow on the right-hand side plot of Figure 6). The latter finding shows that the parity constraint works as intended and accounts for (hidden) proxy attributes.

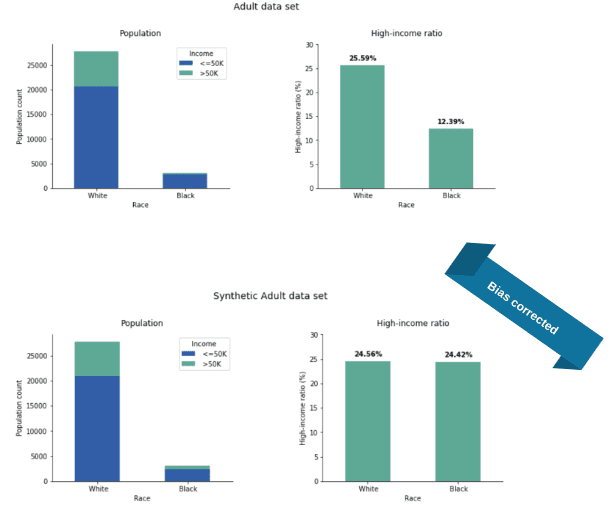
In the Adult data set, gender is not the only sensitive attribute: if we train our synthetic engine with “race” as a sensitive attribute, we get similarly impressive corrections (for this task, we used a simplified version of the data set filtering for Black/White subjects). In the original data, there are twice as many high earners in the White population than in the African American, but the ratios are almost exactly equal in our adjusted synthetic data (Figure 7).
In summary, the introduction of (parity) fairness to our software solution shows very promising results. The quality and accuracy of the synthetic data remain high, the privacy of data subjects is protected, and parity-fairness is guaranteed. All these properties make private and fair synthetic data readily available for further application.
Mitigating Bias on More Than One Feature
It is also a possibility to turn on the fairness loss on multiple sensitive attributes at the same time which we did for race and gender. In this case, one must be careful what ratios to optimize: if we were to simply put fairness losses independently on race and gender then the algorithm might fall into the mistake of “fairness gerrymandering”. That is, the new data set would look fair with respect to both gender and race individually, but we would see high imbalances when restricted to gender and race simultaneously (Figure 8).
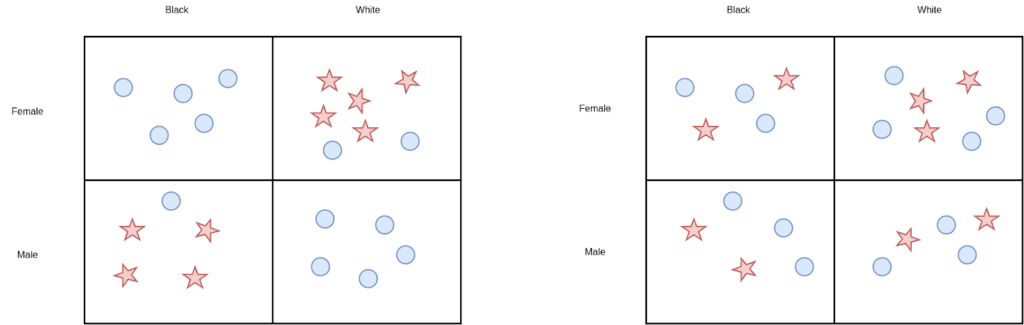
Taking this into account, our solution gives synthetic data with significantly balanced high-income ratios across the four groups given by race and gender (Figure 9).
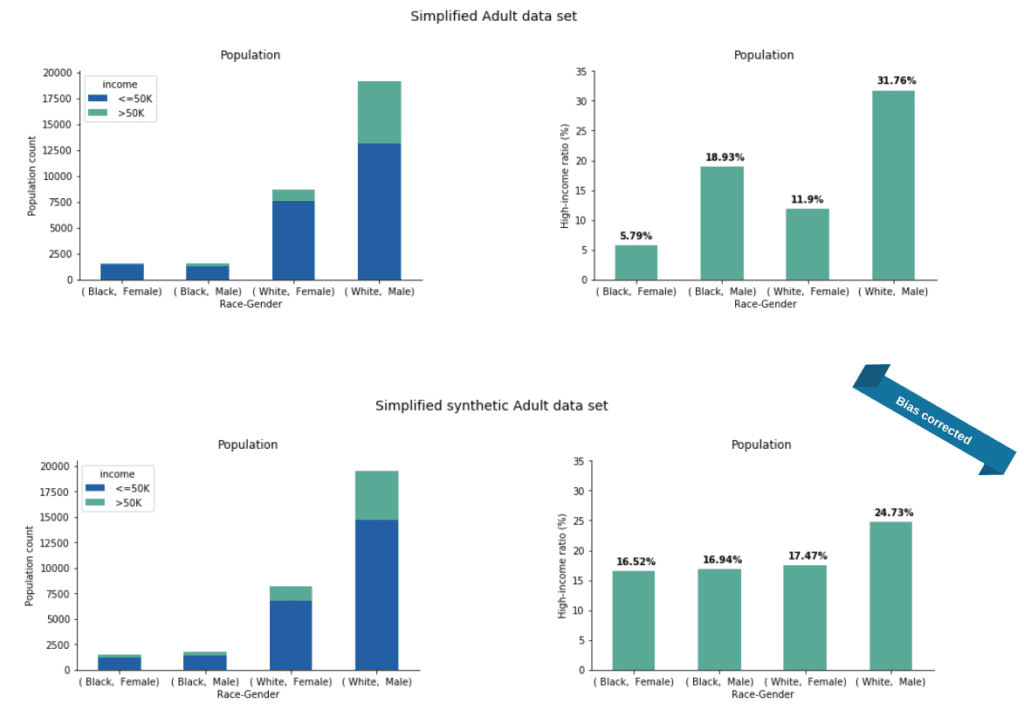
It is apparent that we did not achieve complete parity but this difference can be further lowered by giving higher weight to the fairness loss against the accuracy loss.
Fair Synthetic Data in Downstream Machine Learning Tasks
In the previous post, we introduced a scenario in which Got Big Data Company generates a fair synthetic dataset. This data set is handed to an external vendor, SmartUP AI, to develop new predictive models. As the data set is fair and synthetic, SmartUP AI does not need to take specific privacy measures nor does it need to apply any bias correction so they can work with standard, out-of-the-box models.
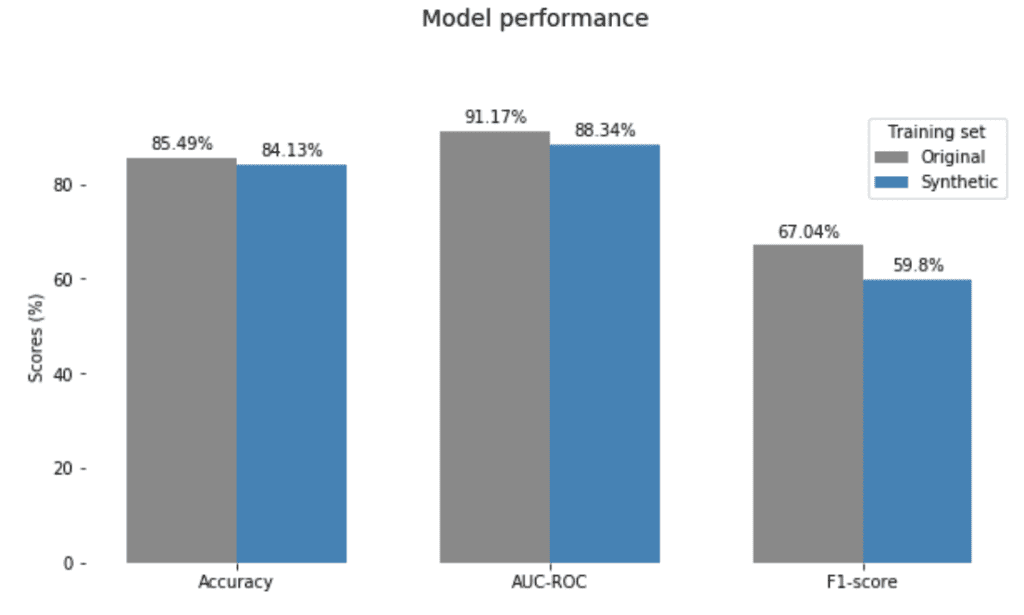
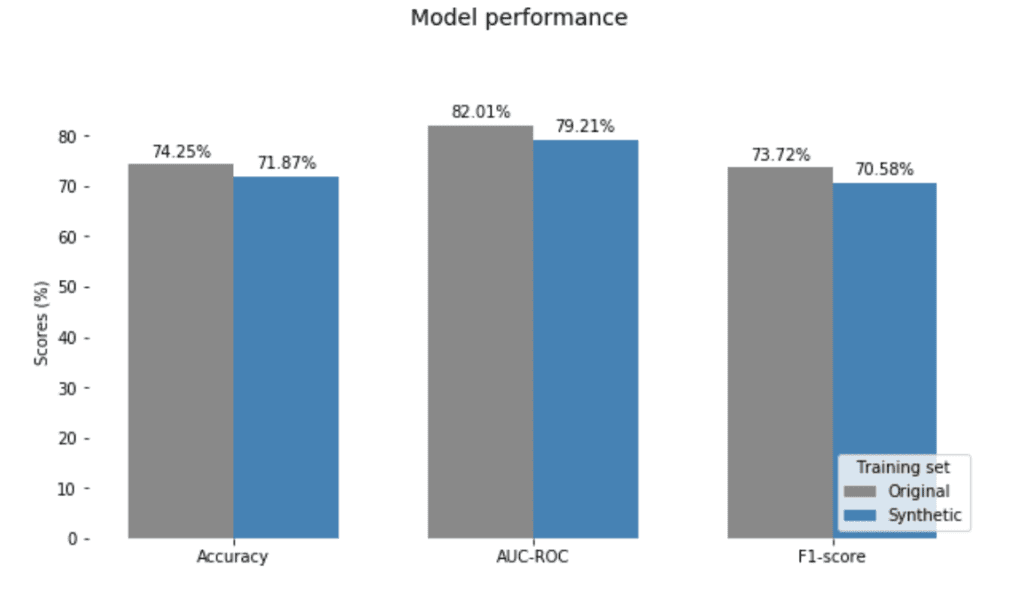
We demonstrate this with the Adult census data by fitting a simple linear model, logistic regression, which predicts the income level, high versus low, based on the other attributes. As we mentioned, there is no point in removing gender as an explanatory variable since the data set can contain other hidden proxies. We train two models, one on the original data set and one on the bias-corrected synthetic data. Both models are then tested on a holdout from the original data. Moreover, we repeated the model training procedure 50 times with independently generated synthetic data.
The charts in Figure 10 show the mean performance of the real and synthetic models over these experiments. The synthetically fitted models have very competitive performance and generalize well to the unseen real data. Also, we observed only minimal variance across the experiments (2%, 2% and 2.5% in Accuracy, AUC-ROC, and F1-score, respectively).
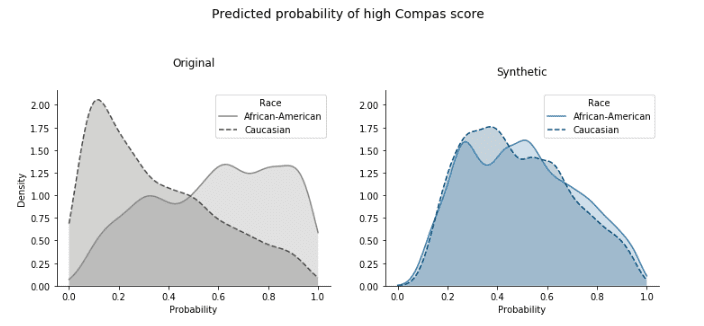
Moreover, the models trained on the synthetic data treat the classes of the sensitive attribute (gender, in this case) nearly equally. These predictive models output the probability of being high-income for any data point, so we can look at how these probabilities are distributed. Since there are more low-income samples, we expect these probabilities to be concentrated close to 0, both for females and males. However, for the model fitted on the original data, we see below that there is a much higher number of around-0 probabilities for females than males (Figure 11).
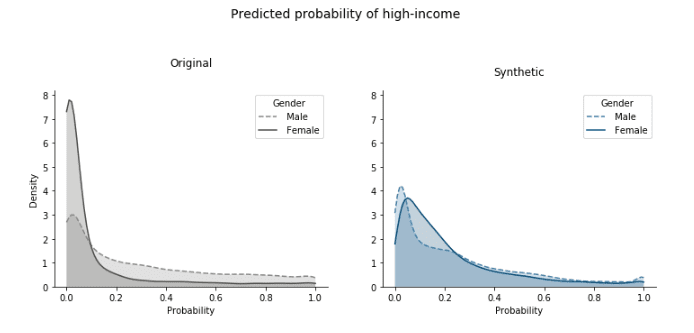
On the other hand, with the predictors trained on the synthetic data these distributions are brought very close together. This is exactly the group fairness that parity is designed to capture. The important thing to keep in mind though is that the predictive-model training itself did not involve any type of optimization to fairness and the evaluation is also on the biased original data. So this fair outcome is solely due to using bias-corrected synthetic data for the training.
Our results align with the findings of research conducted at Carnegie Mellon University into fair representations of data. We see that our fairness-constrained synthetic data solution learns to represent data points in a way that removes the dependencies between the sensitive and target attribute while preserving other relationships.
Correcting the Compas Data Set
We return briefly to the ProPublica study on algorithmic justice and the corresponding Compas data set (see our introductory fairness post). This data set contains information about defendants together with their predicted risk to re-offend, the so-called Compas score. We generate a parity-fair synthetic version of this data set with “race” as the sensitive attribute and the Compas score as the target variable. The original data set is heavily biased towards African Americans which in turn gets perfectly corrected in our synthetic data.
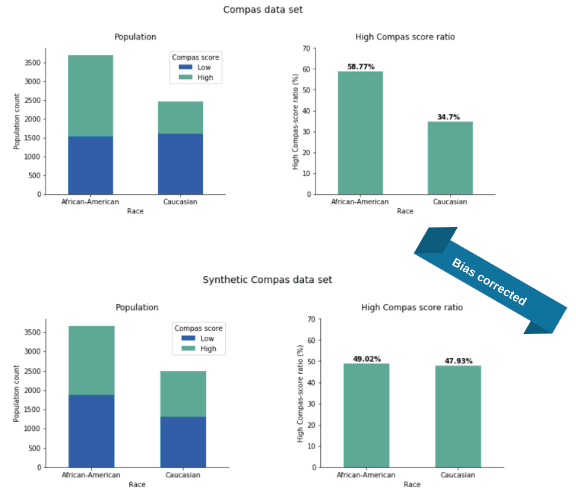
In the original Compas data set, the ratio of individuals with high Compas scores is 59% and 35% for African Americans and Caucasians, respectively. Quite impressively, our bias mitigated data reduced this gap to merely 1%, settling the values in the middle at 49% and 48%, respectively.
In the subsequent prediction task, we can achieve almost perfect equality between the predicted probabilities for high Compas score between the two classes of the sensitive attribute “race” (Figure 13).
Looking at the classifier’s performance, this parity-correction comes with minimal compromise in predictive accuracy (Figure 14).
Alternative Fairness Definitions
While demographic parity is a very intuitive notion, it has certain limitations. As compared to other fairness definitions, there is a worse trade-off between satisfying parity and having high accuracy for the generated data. If your original data had a class imbalance then the parity-mitigated synthetic data or a classifier that is forced to satisfy parity cannot achieve the same level of accuracy as a predictor with no parity loss. Actually, the base-rate difference is a provable lower bound on the accuracy. Moreover, parity is a notion of group fairness, it equalizes outcomes across classes, while other approaches optimize for individual fairness focusing on treating similar individuals similarly. S. Corbett-Davies and S. Goel argue that all these approaches suffer from serious shortcomings and advocate a risk-based assessment that could better serve policymaking.
Since parity only considers the sensitive attribute and a single other variable, it is not designed to handle a situation involving both predictions and a ground-truth label (three variables all together). So, in a more nuanced approach to fairness, one aims to have a predictor model that makes the same mistakes with the same chance across the sensitive attribute classes.
Such notions include equal opportunity and equalized odds which we also tested in our synthesis process: our experiments showed that if we generate synthetic data sets with these fairness constraints then they also give rise to fair classifiers with respect to these stronger notions. We will share the details of these more technical results in a subsequent article.
Conclusions and How We Will Continue After #FairnessWeek
The notion of fairness (in particular, statistical parity) and synthetic data go together very well. Not only can we generate highly accurate synthetic data but we can also steer the generation to almost perfectly mitigate strong biases in the original data sets. The additional fairness constraint in the training loss of our generative models fine-tunes the correlation structure between attributes such that these biases are strongly reduced. Privacy and (parity) fairness are further preserved in downstream tasks: an out-of-the-box classifier model when trained on fair synthetic data makes fair predictions even on biased input.
Statistical parity has limitations, and, on a more general note, there is no concept of fairness or silver-bullet solution that is applicable to all possible use cases. While this was our last post of #FairnessWeek, we will definitely continue our work on fair synthetic data and mitigating bias in Artificial Intelligence. In an upcoming study, we will extend our approach to other fairness measures, such as equal false-positivity rate and equalized odds.
Co-Authors: Alexandra Ebert & Daniel Soukup
In the age of digitalization and the rise of artificial intelligence, more and more tasks in public and private organizations are managed or supported by computers and machine learning algorithms.
These include tasks such as data analysis, automated decision making, customer interaction services such as automated emails or chatbots, and recommendation systems. In general, we believe this is a good thing, as machine learning algorithms are fast, scalable, and can analyze way more complex data structures than humans. For example, there are studies showing that the adoption of automated underwriting in mortgage lending contributed to the increase of approval rates for minority and low-income applicants by 30% while improving the overall accuracy of default predictions.
However, machine learning algorithms typically require lots of training data and when this data contains sensitive information about real people, the stakes become extremely high. Two risks involve the violation of privacy and fairness: disclosing sensitive personal information and treating people unjustly during the decision-making process.
There are many well-documented cases of biased decision making that triggered an ongoing discussion about algorithmic fairness. A famous example is Google’s hate speech-detection algorithm that discriminated against African Americans. Researchers at the University of Washington found, that the algorithm was more likely to label their tweets as “hateful” or “offensive”. Not only was it biased against people of color, but also, as another study demonstrated, against well-known drag queens. Another case of bias in Artificial Intelligence was Amazon’s HR algorithm. The system was fed with 10 years worth of records of previous – and predominantly male – Amazon employees and thereby learned that being female poorly correlated with being a suitable candidate for a job at the tech company.
Now, in the cases above, algorithms systematically discriminate against a group based on its gender, race, or sexual orientation. If not addressed, these systemic biases end up in data sets that decision-making algorithms are trained on. Subsequently, the biased algorithms make unfair decisions, perpetuating, and actually amplifying the biases in our society.
We at MOSTLY AI believe in the positive powers of artificial intelligence to foster research and innovation. We will demonstrate that bias-corrected synthetic data can address both privacy and fairness concerns to allow for utilizing and democratizing big data assets while keeping the risks at a minimum. The current post will give a high-level overview of our work and in post 5 of our Fairness Series, we will discuss more technical aspects of our results as well as make our fair synthetic data sets available.
Read the other parts of the series:
- Part 1 - Why Bias in AI is a Problem & Why Business Leaders Should Care
- Part 2 - 10 Reasons For Bias In AI And What To Do About It
- Part 3 - We Want Fair AI Algorithms – But How To Define Fairness?
- Part 5 - Diving Deep Into Fair Synthetic Data Generation
From Privacy Protection To Promoting Fairness in AI
Our synthetic data platform, enables organizations to generate highly accurate, statistically representative synthetic data at scale such as synthetic customer records along with purchase histories. The software functions as an unlimited source of artificial individuals who have interacted with your business the same way as real people did historically. The synthetic data, however, can be shared safely without privacy concerns since these artificial people do not really exist and the privacy of your actual customers, the real data subjects, remains protected.
Synthetic data generation doesn’t need to stop at privacy protection though. As we generate the data from scratch, we can model and shape it to fit different needs. A beautiful example of this is NVIDIA’s styleGAN, where a conditional generation of synthetic images allows for adding smiles or sunglasses to faces, or changing hair and skin color.
In this blog post, we want to leverage the possibility of modeling and shaping synthetic data to mitigate the second risk mentioned in the introduction: violation of fairness. The result is fair synthetic data that is fully anonymous and de-biased (in accordance with a specific fairness definition).
To Get Fair Synthetic Data You Need To Start With A Fairness Definition
Imagine a perfect world without any biases and discriminations, where attributes such as skin color or sex do not influence people’s lives either in a good nor a bad way. In such a world, the fraction of women among top management positions would equal those of men. Similarly, the fraction of women earning more than $50,000 per year would equal that of men and the fraction of African-Americans in US prisons would be the same as the fraction among Caucasians. This property comes under the name of statistical or demographic parity. The plot below shows how demographic parity is violated in the Adult US census data set with respect to gender and income.

Statistical parity is a very intuitive fairness measure and, in a perfect world with equal opportunities for everybody, it would be satisfied. There are many other, equally viable metrics but keep in mind that there is no single equation or approach that will perfectly fit vastly different scenarios. To truly address and derive actionable insight against bias, one needs a deep understanding of the underlying issues in each use-case. What we developed here is a flexible framework to generate synthetic data that satisfies fairness with respect to a given metric, focusing on parity for now and exploring other measures in a subsequent study.
How To Create A Fair Synthetic Dataset?
There are three points in the machine learning life cycle where you can mitigate bias: at the source, by changing your input data; during the modeling phase by using additional fairness constraints; and as a post-processing step, by revising the algorithm’s decisions in favor of a sensitive group. Naive data-level techniques, such as oversampling methods, have the risk of skewing important data distributions when mitigating imbalances. Our approach is a sort of hybrid, using fairness constraints on a generative model to produce fair synthetic data.
Now, the main objective of our Synthetic Data Platform is to generate new, synthetic data that is as accurate and as representative as the original data set. Under the hood, the software leverages deep neural networks that are trained to optimize an accuracy loss: this simply measures how well our model is reproducing the statistical distributions of the real data. Now, in order to get fair data, we can add a fairness constraint to this optimization step. To stick with the income example, for every mini-batch of data that enters during training, we penalize the violation of statistical parity by a number that is proportional to the difference between the fraction of women and the fraction of men in the high-income segment. We then adapt the model parameters with the objective to minimize both the accuracy loss and fairness constraint.
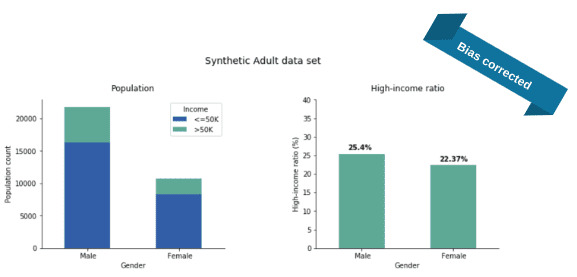
Using this approach, we successfully removed the income inequality with respect to gender from the synthetic version of the Adult data set. We did this with very little compromise on other aspects of data accuracy: for example, you can see we preserved the original Male/Female ratio perfectly.
How Organizations Can Benefit From Private And Fair Synthetic Data
One of our main motivations in working on fair synthetic data generation is the following scenario: imagine Got Big Data Company, a conscientious organization that aims to develop a new predictive model. To do so, they ask the help of a 3rd party vendor, SmartUp AI, and until recently, such collaborations involved allowing access to their sensitive database. Moreover, if Got Big Data Company wanted to address data bias then it required rather special know-how on the developer’s side. Here enters fair synthetic data: Got Big Data Company first generates a synthetic and hence private version of their original data set which is also fair with respect to the modeling task at hand. Next, the vendor, SmartUp AI, develops the predictive model on the synthetic data, just as they would for any task without having to be concerned about bias correction on their end. Then, these models are handed back to Got Big Data Company for use on actual customer data.
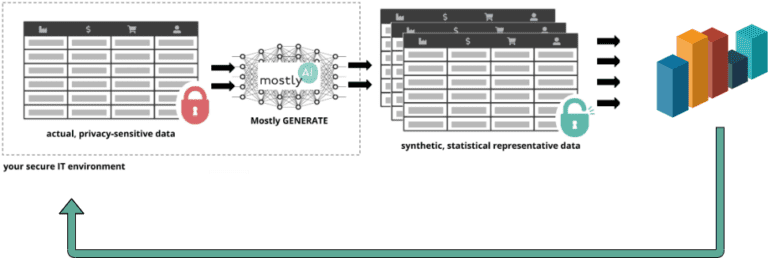
using the synthetic data ⇒ evaluate and deploy on real data.
We find that out-of-the-box predictive models trained on fair synthetic data treat the classes of the sensitive attribute near equally (e.g., female and male). This fair outcome is solely due to using parity-corrected synthetic data, there are no fairness constraints of the predictive models. In the next article, we will release our parity-corrected synthetic data and dive into the technical details of our approach and analysis of the generated data.
Conclusions
There are many inherent risks in automated decision making and in the use of data sets that do not reflect the world we strive to live in. Historical and measurement biases skew predictive models which in turn affect millions of people who are applying for loans or submitting job applications. As data scientists, engineers, and business leaders, we are responsible to address these issues as best as we can. At Mostly AI, we offer a two-in-one tool to utilize data sets that are often sensitive and biased at the same time. First, our fair synthetic data can be safely shared without leaking personal information. Second, having addressed bias-mitigation at the synthetic data generation phase, it enables organizations to utilize existing analytics and modeling pipelines without the need for costly anti-discrimination modifications. To learn more about how fair synthetic data is generated, continue with part 5 of our Fairness Series.
“One of the major challenges in making algorithms fair lies in deciding what fairness actually means,” said Dr. Chris Russell, who is leading the safe and ethical AI group at the Alan Turing Institute, in an interview with Wired. “Trying to understand what fairness means, and when a particular approach is the right one to use is a major area of ongoing research.” Fairness is a vastly complex concept and as people tend to have different values their interpretations of fairness differ as well. A mother might think it is fair if both of her children receive two pieces of chocolate. But instead of having two happy kids eating their chocolate, they start to quarrel. The older ones’ argument? He is much bigger and thus should have received a piece more than his brother. The little one’s opinion? It was him who helped dad do the dishes yesterday evening – therefore he is the one deserving more chocolate. Read the other parts of the series:- Part 1 - Why Bias in AI is a Problem & Why Business Leaders Should Care
- Part 2 - 10 Reasons For Bias In AI And What To Do About It
- Part 4 - Tackling AI Bias At Its Source – With Fair Synthetic Data
- Part 5 - Diving Deep Into Fair Synthetic Data Generation
Equal Treatment Versus Equal Access
In the private as well in the business context we oftentimes strive to achieve fairness by treating everybody exactly the same. An equal amount of chocolate. An equal amount of time to finish a test in school and – in an ideal world – also equal pay regardless of gender or race. The concept behind this is called equality. But what it fails to take into account is that not every one of us starts from the same place and that some might need different support than others do. Imagine three people of divergent height trying to get to the beautifully ripe, red apples on an apple tree. If you were to give a small pedestal to everyone, it would not really improve the situation for the smaller individuals:
Fair AI Requires A Mathematical Fairness Definition
In order to build fair machine learning systems, we need to precisely define and quantify what we mean by a fair outcome. There are several mathematical definitions that do just that and on a high level, these notions fall into two categories: group and individual fairness. Group fairness and parity constraints aim to achieve the same outcomes across different demographics, or more generally, a set of protected population classes. In other words, the population that receives a given assessment by the algorithm (let it be positive or negative) should reflect the whole population and its demographics. We can furthermore require that the types of mistakes the model makes and the severity of these errors should be evenly distributed across the population. These requirements are intuitive, easily applied across domains, and hence are the most widely used, and studied. At the same time, being fair with respect to parity can seem highly unfair from a single individual’s viewpoint. So individual fairness advocates treating similar individuals similarly. The ”Fairness through Awareness” approach is built on first defining a task-specific similarity measure between pairs of data subjects and using that to quantify how close predictions a randomized algorithm should give on two individuals. There are ways to combine group and individual fairness, such as learning fair representations (abstract transformations of the data points into high-dimensional numeric vectors) that could be used in downstream modeling tasks. Yet another approach develops individual risk scores and uses a thresholding policy to treat similarly risky individuals the same way. The list of fairness definitions goes on and on, but in all cases, one aims to find the most accurate model that still satisfies a given fairness constraint. But who exactly selects the protected classes and the requirements that should be met? We know that certain parity requirements are impossible to satisfy simultaneously. On the other hand, finding the right metric and risk scores for individual assessments can be very challenging and needs to be done on a case-by-case basis. As Hanna Wallach from Microsoft Research puts it “[…] issues relating to fairness and machine learning are fundamentally socio-technical, and they are not going to be addressed by computer scientists or developers alone”. So it is of utmost importance to include a diverse set of stakeholders in these decisions with an insight into the whole decision-making process.Demographic Parity – A Group-Fairness Measure
For defining and explaining in more detail group-fairness measures, let’s revisit David Weinberger’s tomato factory example. In this hypothetical factory, tomatoes are processed to end up in spaghetti sauce. An integral part of the factory is a machine learning algorithm that automatically analyzes tomatoes on the conveyor belt and classifies them into fresh and bad (or rotten) tomatoes. Fresh tomatoes are transferred into the “Acceptable” bin and ultimately end up in the spaghetti sauce, rotten tomatoes end up in the “Discard” bin and are thrown away. Consider there exist only two kinds of tomatoes worldwide: 80% of all tomatoes are red tomatoes and 20% of them are yellow. Apart from their appearance, there is no difference between red and yellow tomatoes. They taste the same, have the same shape, grow equally fast, and need equal amounts of care. They also have the same storage life which means they start to rot after the same time span. One of the most intuitive definitions of fairness is demographic (or statistical) parity. In case the tomato sorting machine learning algorithm satisfies demographic parity, we expect about 80% of red and 20% of yellow tomatoes within the “Acceptable” bin in the spaghetti factory. In other words, we expect the fractions of red and yellow tomatoes in the global population to be reflected in the “favorable” group of “Acceptable” tomatoes in the factory. An unfair algorithm, that “favors” red tomatoes and discriminates against yellow ones, would put more than 80% of red tomatoes in the “Acceptable” bin. In this example, demographic parity is a perfectly fine measure. However, as Dwork and co-workers pointed out, the notion of demographic parity has shortcomings and needs to be applied with great care. Imagine that our two hypothetical tomato sorts do differ in that yellow tomatoes tend to rot a little faster than red ones on their way to the factory. In that case, the fraction of red tomatoes in the “Acceptable” bin should be larger than 80% as more of the yellow tomatoes need to be discarded. Enforcing demographic parity in this scenario leads to two problems. First, it actually introduces some unfairness. To achieve demographic parity, say for a one-day batch of tomatoes processed in the factory, the algorithm needs to put some rotten yellow tomatoes into the “Acceptable” bin while, at the same time, prevent some of the perfectly fresh red tomatoes from going in there. The second shortcoming is related to the tension between accuracy and fairness. If the tomato sorting algorithm was what is called a perfect classifier (in practice a perfect classifier does not exist but for the sake of the argument let’s consider it does), it would not make any mistakes and place all tomatoes in the correct bin. As such, this algorithm is fair as it treats every single tomato the way the tomato “deserves”. Enforcing demographic parity on this perfect classifier would actually detune it – which clearly shows that there is a misalignment between optimizing a classifier and satisfying demographic parity. Therefore, demographic parity usually leads to larger costs in accuracy and, therefore, costs an organization more money than other fairness measures.Equality of False-negatives And Equalized Odds
The core problem of demographic parity is that it does not take into account the ground truth. It does not care whether or not tomatoes are “Acceptable”, it just requires the fractions of red and yellow tomatoes in the global population being represented in the “Acceptable” bin. There is a group of fairness measures that do take into account the ground truth by, for example, balancing or equalizing the errors the sorting algorithm makes for both sorts of tomatoes. One of the simplest examples in this context is the so-called equality of false-negatives measure that enforces constant false-negative rates across groups. In our tomato example, this means that fresh tomatoes – irrespective of their color – have the same probability of falsely ending up in the “Discard” bin. This measure only amends the errors made in the group of fresh tomatoes as only they can falsely end up in the “Discard” bin. An even stronger fairness notion that also mitigates errors in the group of rotten tomatoes is called equalized odds. It requires constant false-negative as well as true-negative rates across groups. This means that also the chances for rotten tomatoes ending up in the “Discard” bin is equal for red and yellow tomatoes. One big advantage of these types of fairness measures is that they allow for perfect decisions. For a perfect classifier, the false-negative and true-negative rates across all groups are 0% and 100%, respectively. This does not mean that the accuracy of a real-world classifier is not limited by an additional fairness constraint but it shows that, for example, equalized odds is usually better aligned with optimization than demographic parity.The Accuracy Versus Fairness Trade-Off
Fairness always comes at a cost: as we put an additional constraint on the model, we introduce a trade-off with accuracy. This is not a new phenomenon and a stark example relates to a fatal Uber accident in Tempe, Arizona. The autonomous vehicle system detected the pedestrian in time to stop but the developers had tweaked the emergency braking system in favor of not braking too much, balancing a trade-off between jerky driving and safety. Going back to bias, when we compare a model that maximizes total revenue, a fairness constrained model will probably promise less profit. You can explore these concepts with an interactive threshold classifier, including demographic parity and equal opportunity (that is, equal true positive rates), in a post from Google Research. By setting various global or group aware thresholds for giving out hypothetical loans, you can see how the bank’s profit and the distributions of loans across the population changes.