In this tutorial, you will learn the key concepts behind MOSTLY AI’s synthetic data Quality Assurance (QA) framework. This will enable you to efficiently and reliably assess the quality of your generated synthetic datasets. It will also give you the skills to confidently explain the quality metrics to any interested stakeholders.
Using the code in this tutorial, you will replicate key parts of both the accuracy and privacy metrics that you will find in any MOSTLY AI QA Report. For a full-fledged exploration of the topic including a detailed mathematical explanation, see our peer-reviewed journal paper as well as the accompanying benchmarking study.
The Python code for this tutorial is publicly available and runnable in this Google Colab notebook.
QA reports for synthetic data sets
If you have run any synthetic data generation jobs with MOSTLY AI, chances are high that you’ve already encountered the QA Report. To access it, click on any completed synthesization job and select the “QA Report” tab:
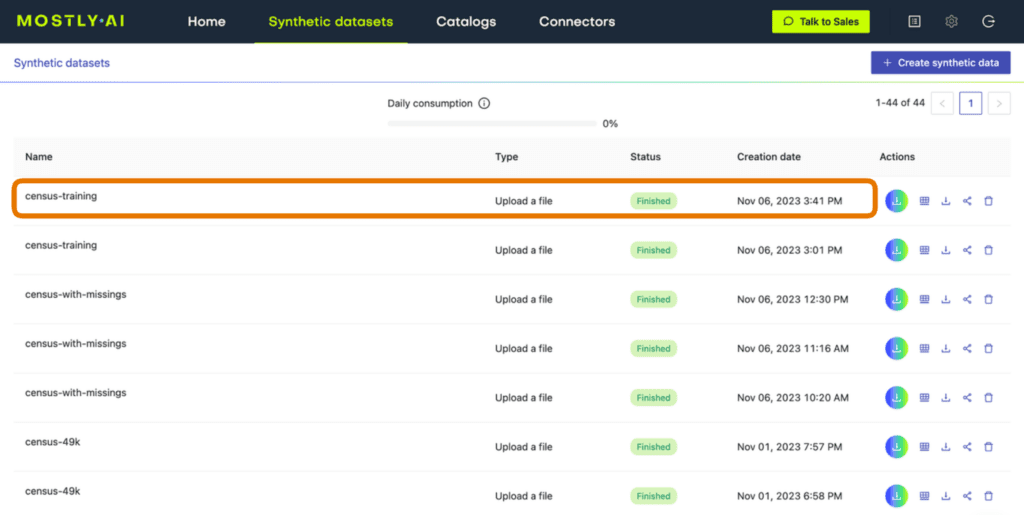
Fig 1 - Click on a completed synthesization job.
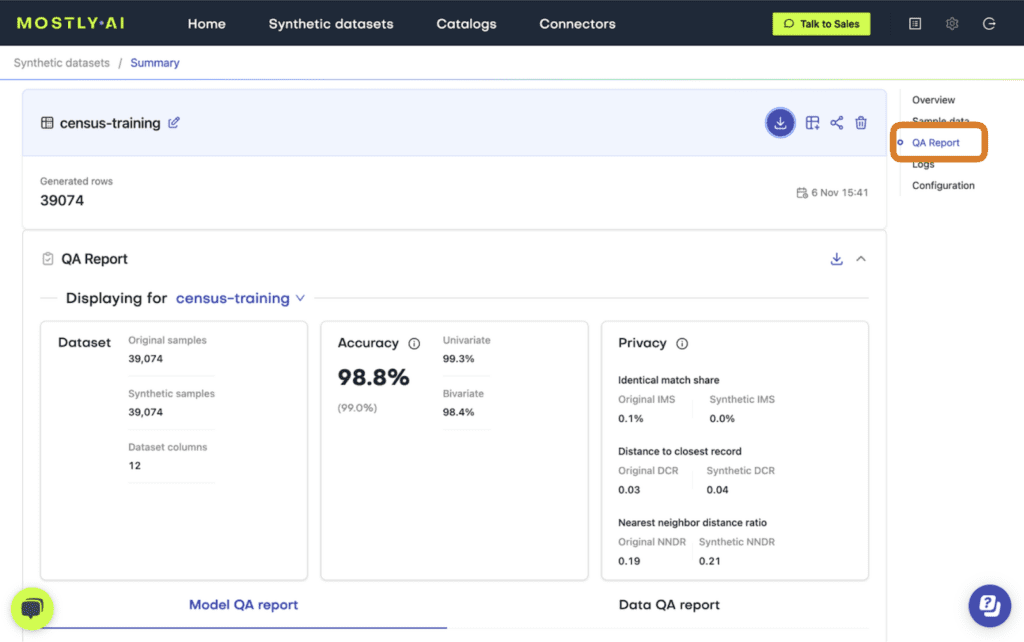
Fig 2 - Select the “QA Report” tab.
At the top of the QA Report you will find some summary statistics about the dataset as well as the average metrics for accuracy and privacy of the generated dataset. Further down, you can toggle between the Model QA Report and the Data QA Report. The Model QA reports on the accuracy and privacy of the trained Generative AI model. The Data QA, on the other hand, visualizes the distributions not of the underlying model but of the outputted synthetic dataset. If you generate a synthetic dataset with all the default settings enabled, the Model and Data QA Reports should look the same.
Exploring either of the QA reports you will discover various performance metrics, such as univariate and bivariate distributions for each of the columns and well as more detailed privacy metrics. You can use these metrics to precisely evaluate the quality of your synthetic dataset.
So how does MOSTLY AI calculate these quality assurance metrics?
In the following sections you will replicate the accuracy and privacy metrics. The code is almost exactly the code that MOSTLY AI runs under the hood to generate the QA Reports – it has been tweaked only slightly to improve legibility and usability. Working through this code will give you a hands-on insight into how MOSTLY AI evaluates synthetic data quality.
Preprocessing the data
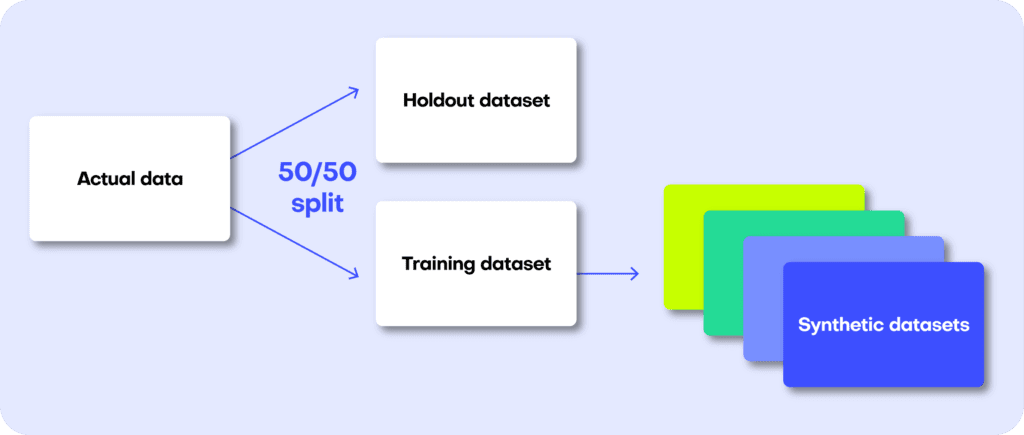
The first step in MOSTLY AI’s synthetic data quality evaluation methodology is to take the original dataset and split it in half to yield two subsets: a training dataset and a holdout dataset. We then use only the training samples (so only 50% of the original dataset) to train our synthesizer and generate synthetic data samples. The holdout samples are never exposed to the synthesis process but are kept aside for evaluation.

Fig 3 - The first step is to split the original dataset in two equal parts and train the synthesizer on only one of the halves.
Distance-based quality metrics for synthetic data generation
Both the accuracy and privacy metrics are measured in terms of distance. Remember that we split the original dataset into two subsets: a training and a holdout set. Since these are all samples from the same dataset, these two sets will exhibit the same statistics and the same distributions. However, as the split was made at random we can expect a slight difference in the statistical properties of these two datasets. This difference is normal and is due to sampling variance.
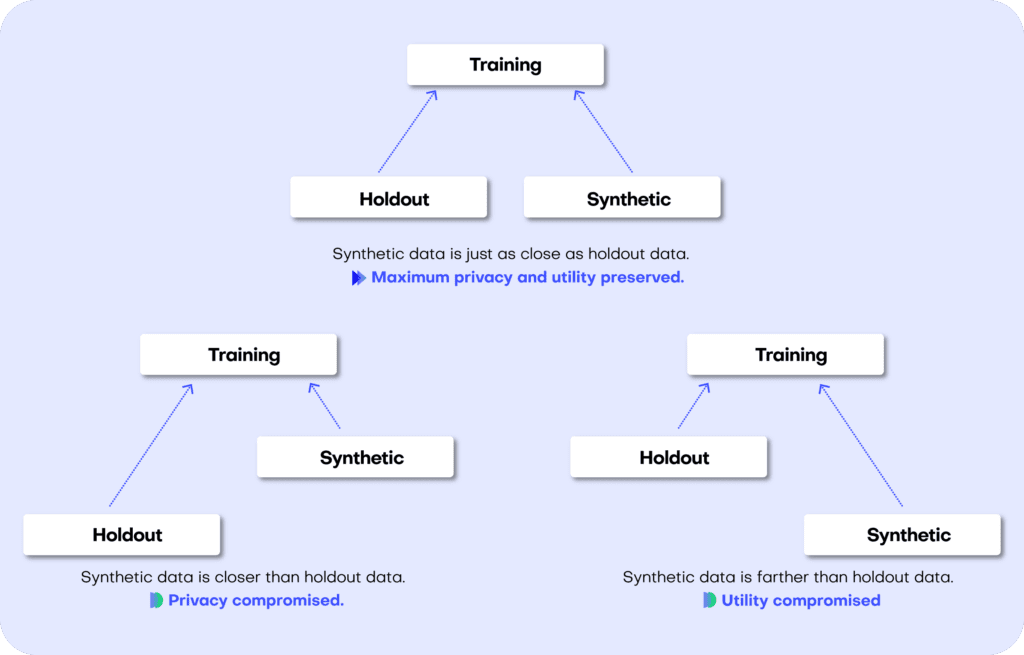
The difference (or, to put it mathematically: the distance) between the training and holdout samples will serve us as a reference point: in an ideal scenario, the synthetic data we generate should be no different from the training dataset than the holdout dataset is. Or to put it differently: the distance between the synthetic samples and the training samples should approximate the distance we would expect to occur naturally within the training samples due to sampling variance.
If the synthetic data is significantly closer to the training data than the holdout data, this means that some information specific to the training data has leaked into the synthetic dataset. If the synthetic data is significantly farther from the training data than the holdout data, this means that we have lost information in terms of accuracy or fidelity.
For more context on this distance-based quality evaluation approach, check out our benchmarking study which dives into more detail.
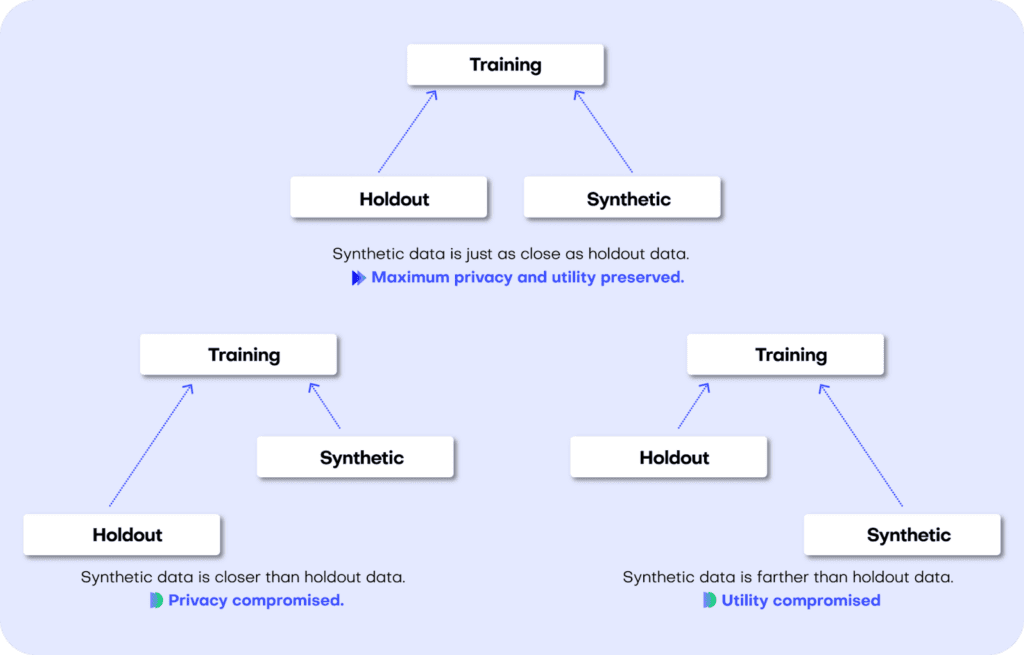
Fig 4 - A perfect synthetic data generator creates data samples that are just as different from the training data as the holdout data. If this is not the case, we are compromising on either privacy or utility.
Let’s jump into replicating the metrics for both accuracy and privacy 👇
Synthetic data accuracy
The accuracy of MOSTLY AI’s synthetic datasets is measured as the total variational distance between the empirical marginal distributions. It is calculated by treating all the variables in the dataset as categoricals (by binning any numerical features) and then measuring the sum of all deviations between the empirical marginal distributions.
The code below performs the calculation for all univariate and bivariate distributions and then averages across to determine the simple summary statistics you see in the QA Report.
First things first: let’s access the data. You can fetch both the original and the synthetic datasets directly from the Github repo:
repo = (
    "https://github.com/mostly-ai/mostly-tutorials/raw/dev/quality-assurance"
)
tgt = pd.read_parquet(f"{repo}/census-training.parquet")
print(
    f"fetched original data with {tgt.shape[0]:,} records and {tgt.shape[1]} attributes"
)
syn = pd.read_parquet(f"{repo}/census-synthetic.parquet")
print(
    f"fetched synthetic data with {syn.shape[0]:,} records and {syn.shape[1]} attributes"
)
fetched original data with 39,074 records and 12 attributes
fetched synthetic data with 39,074 records and 12 attributes
We are working with a version of the UCI Adult Income dataset. This dataset has just over 39K records and 12 columns. Go ahead and sample 5 random records to get a sense of what the data looks like:
tgt.sample(n=5)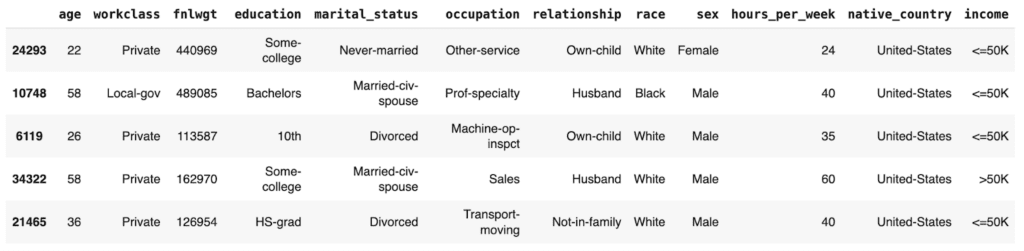
Let’s define a helper function to bin the data in order treat any numerical features as categoricals:
def bin_data(dt1, dt2, bins=10):
    dt1 = dt1.copy()
    dt2 = dt2.copy()
    # quantile binning of numerics
    num_cols = dt1.select_dtypes(include="number").columns
    cat_cols = dt1.select_dtypes(
        include=["object", "category", "string", "bool"]
    ).columns
    for col in num_cols:
        # determine breaks based on `dt1`
        breaks = dt1[col].quantile(np.linspace(0, 1, bins + 1)).unique()
        dt1[col] = pd.cut(dt1[col], bins=breaks, include_lowest=True)
        dt2_vals = pd.to_numeric(dt2[col], "coerce")
        dt2_bins = pd.cut(dt2_vals, bins=breaks, include_lowest=True)
        dt2_bins[dt2_vals < min(breaks)] = "_other_"
        dt2_bins[dt2_vals > max(breaks)] = "_other_"
        dt2[col] = dt2_bins
    # top-C binning of categoricals
    for col in cat_cols:
        dt1[col] = dt1[col].astype("str")
        dt2[col] = dt2[col].astype("str")
        # determine top values based on `dt1`
        top_vals = dt1[col].value_counts().head(bins).index.tolist()
        dt1[col].replace(
            np.setdiff1d(dt1[col].unique().tolist(), top_vals),
            "_other_",
            inplace=True,
        )
        dt2[col].replace(
            np.setdiff1d(dt2[col].unique().tolist(), top_vals),
            "_other_",
            inplace=True,
        )
    return dt1, dt2
And a second helper function to calculate the univariate and bivariate accuracies:
def calculate_accuracies(dt1_bin, dt2_bin, k=1):
    # build grid of all cross-combinations
    cols = dt1_bin.columns
    interactions = pd.DataFrame(
        np.array(np.meshgrid(cols, cols)).reshape(2, len(cols) ** 2).T
    )
    interactions.columns = ["col1", "col2"]
    if k == 1:
        interactions = interactions.loc[
            (interactions["col1"] == interactions["col2"])
        ]
    elif k == 2:
        interactions = interactions.loc[
            (interactions["col1"] < interactions["col2"])
        ]
    else:
        raise ("k>2 not supported")

    results = []
    for idx in range(interactions.shape[0]):
        row = interactions.iloc[idx]
        val1 = (
            dt1_bin[row.col1].astype(str) + "|" + dt1_bin[row.col2].astype(str)
        )
        val2 = (
            dt2_bin[row.col1].astype(str) + "|" + dt2_bin[row.col2].astype(str)
        )
        # calculate empirical marginal distributions (=relative frequencies)
        freq1 = val1.value_counts(normalize=True, dropna=False).to_frame(
            name="p1"
        )
        freq2 = val2.value_counts(normalize=True, dropna=False).to_frame(
            name="p2"
        )
        freq = freq1.join(freq2, how="outer").fillna(0.0)
        # calculate Total Variation Distance between relative frequencies
        tvd = np.sum(np.abs(freq["p1"] - freq["p2"])) / 2
        # calculate Accuracy as (100% - TVD)
        acc = 1 - tvd
        out = pd.DataFrame(
            {
                "Column": [row.col1],
                "Column 2": [row.col2],
                "TVD": [tvd],
                "Accuracy": [acc],
            }
        )
        results.append(out)

    return pd.concat(results)
Then go ahead and bin the data. We restrict ourselves to 100K records for efficiency.
# restrict to max 100k records
tgt = tgt.sample(frac=1).head(n=100_000)
syn = syn.sample(frac=1).head(n=100_000)
# bin data
tgt_bin, syn_bin = bin_data(tgt, syn, bins=10)
Now you can go ahead and calculate the univariate accuracies for all the columns in the dataset:
# calculate univariate accuracies
acc_uni = calculate_accuracies(tgt_bin, syn_bin, k=1)[['Column', 'Accuracy']]
Go ahead and inspect the first 5 columns:
acc_uni.head()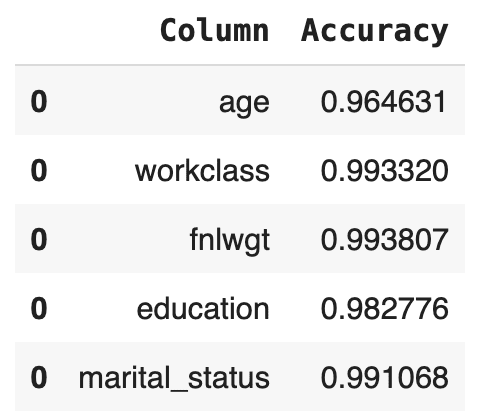
Now let’s calculate the bivariate accuracies as well. This measures how well the relationships between all the sets of two columns are maintained.
# calculate bivariate accuracies
acc_biv = calculate_accuracies(tgt_bin, syn_bin, k=2)[
    ["Column", "Column 2", "Accuracy"]
]
acc_biv = pd.concat(
    [
        acc_biv,
        acc_biv.rename(columns={"Column": "Column 2", "Column 2": "Column"}),
    ]
)
acc_biv.head()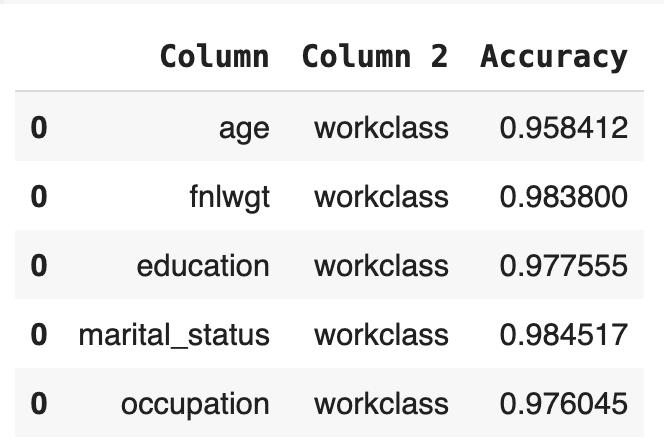
The bivariate accuracy that is reported for each column in the MOSTLY AI QA Report is an average over all of the bivariate accuracies for that column with respect to all the other columns in the dataset. Let’s calculate that value for each column and then create an overview table with the univariate and average bivariate accuracies for all columns:
# calculate the average bivariate accuracy
acc_biv_avg = (
    acc_biv.groupby("Column")["Accuracy"]
    .mean()
    .to_frame("Bivariate Accuracy")
    .reset_index()
)
# merge to univariate and avg. bivariate accuracy to single overview table
acc = pd.merge(
    acc_uni.rename(columns={"Accuracy": "Univariate Accuracy"}),
    acc_biv_avg,
    on="Column",
).sort_values("Univariate Accuracy", ascending=False)
# report accuracy as percentage
acc["Univariate Accuracy"] = acc["Univariate Accuracy"].apply(
    lambda x: f"{x:.1%}"
)
acc["Bivariate Accuracy"] = acc["Bivariate Accuracy"].apply(
    lambda x: f"{x:.1%}"
)
acc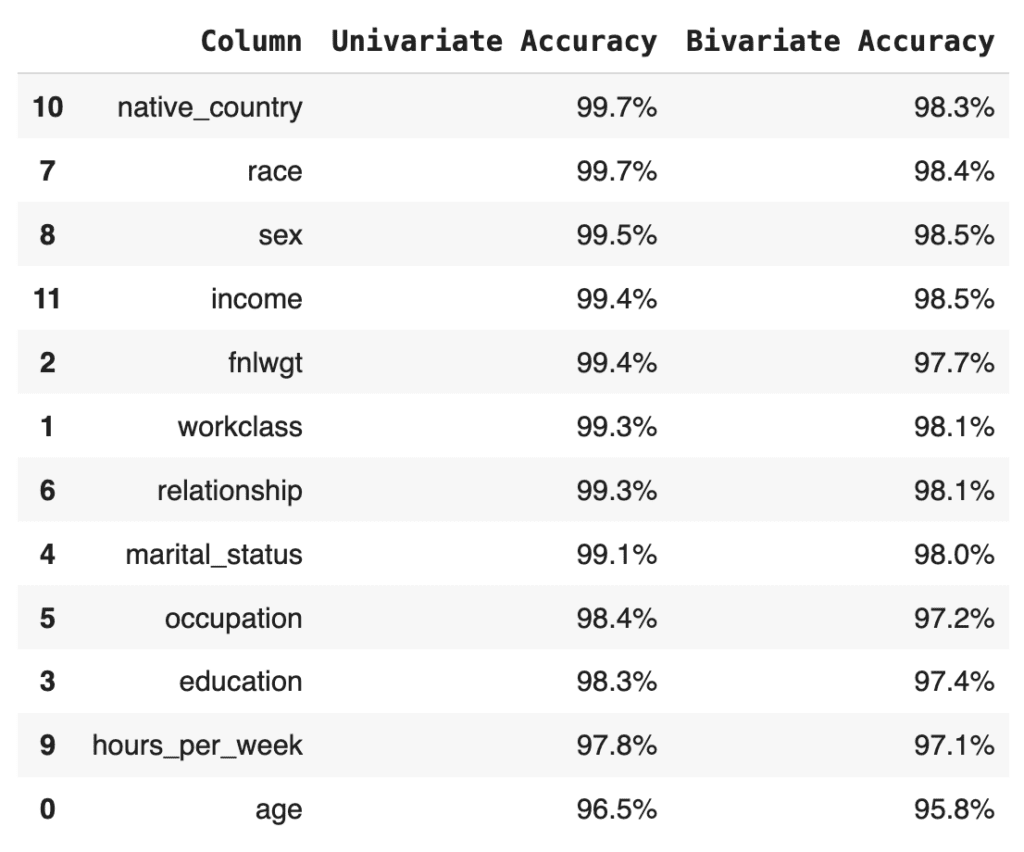
Finally, let’s calculate the summary statistic values that you normally see at the top of any MOSTLY AI QA Report: the overall accuracy as well as the average univariate and bivariate accuracies. We take the mean of the univariate and bivariate accuracies for all the columns and then take the mean of the result to arrive at the overall accuracy score:
print(f"Avg. Univariate Accuracy: {acc_uni['Accuracy'].mean():.1%}")
print(f"Avg. Bivariate Accuracy:  {acc_biv['Accuracy'].mean():.1%}")
print(f"-------------------------------")
acc_avg = (acc_uni["Accuracy"].mean() + acc_biv["Accuracy"].mean()) / 2
print(f"Avg. Overall Accuracy:    {acc_avg:.1%}")
Avg. Univariate Accuracy: 98.9%
Avg. Bivariate Accuracy: 97.7%
------------------------------
Avg. Overall Accuracy: 98.3%
If you’re curious how this compares to the values in the MOSTLY AI QA Report, go ahead and download the tgt dataset and synthesize it using the default settings. The overall accuracy reported will be close to 98%.
Next, let’s see how MOSTLY AI generates the visualization segments of the accuracy report. The code below defines two helper functions: one for the univariate and one for the bivariate plots. Getting the plots right for all possible edge cases is actually rather complicated, so while the code block below is lengthy, this is in fact the trimmed-down version of what MOSTLY AI uses under the hood. You do not need to worry about the exact details of the implementation here; just getting an overall sense of how it works is enough:
import plotly.graph_objects as go


def plot_univariate(tgt_bin, syn_bin, col, accuracy):
    freq1 = (
        tgt_bin[col].value_counts(normalize=True, dropna=False).to_frame("tgt")
    )
    freq2 = (
        syn_bin[col].value_counts(normalize=True, dropna=False).to_frame("syn")
    )
    freq = freq1.join(freq2, how="outer").fillna(0.0).reset_index()
    freq = freq.sort_values(col)
    freq[col] = freq[col].astype(str)

    layout = go.Layout(
        title=dict(
            text=f"<b>{col}</b> <sup>{accuracy:.1%}</sup>", x=0.5, y=0.98
        ),
        autosize=True,
        height=300,
        width=800,
        margin=dict(l=10, r=10, b=10, t=40, pad=5),
        plot_bgcolor="#eeeeee",
        hovermode="x unified",
        yaxis=dict(
            zerolinecolor="white",
            rangemode="tozero",
            tickformat=".0%",
        ),
    )
    fig = go.Figure(layout=layout)
    trn_line = go.Scatter(
        mode="lines",
        x=freq[col],
        y=freq["tgt"],
        name="target",
        line_color="#666666",
        yhoverformat=".2%",
    )
    syn_line = go.Scatter(
        mode="lines",
        x=freq[col],
        y=freq["syn"],
        name="synthetic",
        line_color="#24db96",
        yhoverformat=".2%",
        fill="tonexty",
        fillcolor="#ffeded",
    )
    fig.add_trace(trn_line)
    fig.add_trace(syn_line)
    fig.show(config=dict(displayModeBar=False))


def plot_bivariate(tgt_bin, syn_bin, col1, col2, accuracy):
    x = (
        pd.concat([tgt_bin[col1], syn_bin[col1]])
        .drop_duplicates()
        .to_frame(col1)
    )
    y = (
        pd.concat([tgt_bin[col2], syn_bin[col2]])
        .drop_duplicates()
        .to_frame(col2)
    )
    df = pd.merge(x, y, how="cross")
    df = pd.merge(
        df,
        pd.concat([tgt_bin[col1], tgt_bin[col2]], axis=1)
        .value_counts()
        .to_frame("target")
        .reset_index(),
        how="left",
    )
    df = pd.merge(
        df,
        pd.concat([syn_bin[col1], syn_bin[col2]], axis=1)
        .value_counts()
        .to_frame("synthetic")
        .reset_index(),
        how="left",
    )
    df = df.sort_values([col1, col2], ascending=[True, True]).reset_index(
        drop=True
    )
    df["target"] = df["target"].fillna(0.0)
    df["synthetic"] = df["synthetic"].fillna(0.0)
    # normalize values row-wise (used for visualization)
    df["target_by_row"] = df["target"] / df.groupby(col1)["target"].transform(
        "sum"
    )
    df["synthetic_by_row"] = df["synthetic"] / df.groupby(col1)[
        "synthetic"
    ].transform("sum")
    # normalize values across table (used for accuracy)
    df["target_by_all"] = df["target"] / df["target"].sum()
    df["synthetic_by_all"] = df["synthetic"] / df["synthetic"].sum()
    df["y"] = df[col1].astype("str")
    df["x"] = df[col2].astype("str")

    layout = go.Layout(
        title=dict(
            text=f"<b>{col1} ~ {col2}</b> <sup>{accuracy:.1%}</sup>",
            x=0.5,
            y=0.98,
        ),
        autosize=True,
        height=300,
        width=800,
        margin=dict(l=10, r=10, b=10, t=40, pad=5),
        plot_bgcolor="#eeeeee",
        showlegend=True,
        # prevent Plotly from trying to convert strings to dates
        xaxis=dict(type="category"),
        xaxis2=dict(type="category"),
        yaxis=dict(type="category"),
        yaxis2=dict(type="category"),
    )
    fig = go.Figure(layout=layout).set_subplots(
        rows=1,
        cols=2,
        horizontal_spacing=0.05,
        shared_yaxes=True,
        subplot_titles=("target", "synthetic"),
    )
    fig.update_annotations(font_size=12)
    # plot content
    hovertemplate = (
        col1[:10] + ": `%{y}`<br />" + col2[:10] + ": `%{x}`<br /><br />"
    )
    hovertemplate += "share target vs. synthetic<br />"
    hovertemplate += "row-wise: %{customdata[0]} vs. %{customdata[1]}<br />"
    hovertemplate += "absolute: %{customdata[2]} vs. %{customdata[3]}<br />"
    customdata = df[
        [
            "target_by_row",
            "synthetic_by_row",
            "target_by_all",
            "synthetic_by_all",
        ]
    ].apply(lambda x: x.map("{:.2%}".format))
    heat1 = go.Heatmap(
        x=df["x"],
        y=df["y"],
        z=df["target_by_row"],
        name="target",
        zmin=0,
        zmax=1,
        autocolorscale=False,
        colorscale=["white", "#A7A7A7", "#7B7B7B", "#666666"],
        showscale=False,
        customdata=customdata,
        hovertemplate=hovertemplate,
    )
    heat2 = go.Heatmap(
        x=df["x"],
        y=df["y"],
        z=df["synthetic_by_row"],
        name="synthetic",
        zmin=0,
        zmax=1,
        autocolorscale=False,
        colorscale=["white", "#81EAC3", "#43E0A5", "#24DB96"],
        showscale=False,
        customdata=customdata,
        hovertemplate=hovertemplate,
    )
    fig.add_trace(heat1, row=1, col=1)
    fig.add_trace(heat2, row=1, col=2)
    fig.show(config=dict(displayModeBar=False))
Now you can create the plots for the univariate distributions:
for idx, row in acc_uni.sample(n=5, random_state=0).iterrows():
    plot_univariate(tgt_bin, syn_bin, row["Column"], row["Accuracy"])
    print("")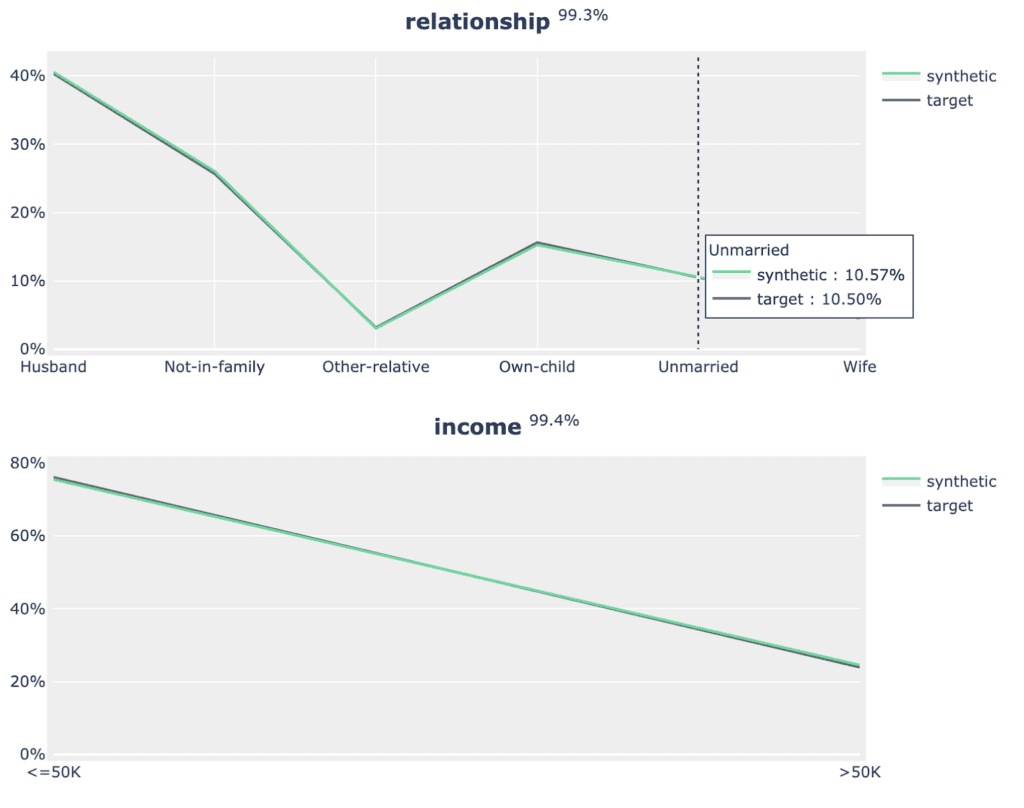
Fig 5 - Sample of 2 univariate distribution plots.
As well as the bivariate distribution plots:
for idx, row in acc_biv.sample(n=5, random_state=0).iterrows():
    plot_bivariate(
        tgt_bin, syn_bin, row["Column"], row["Column 2"], row["Accuracy"]
    )
    print("")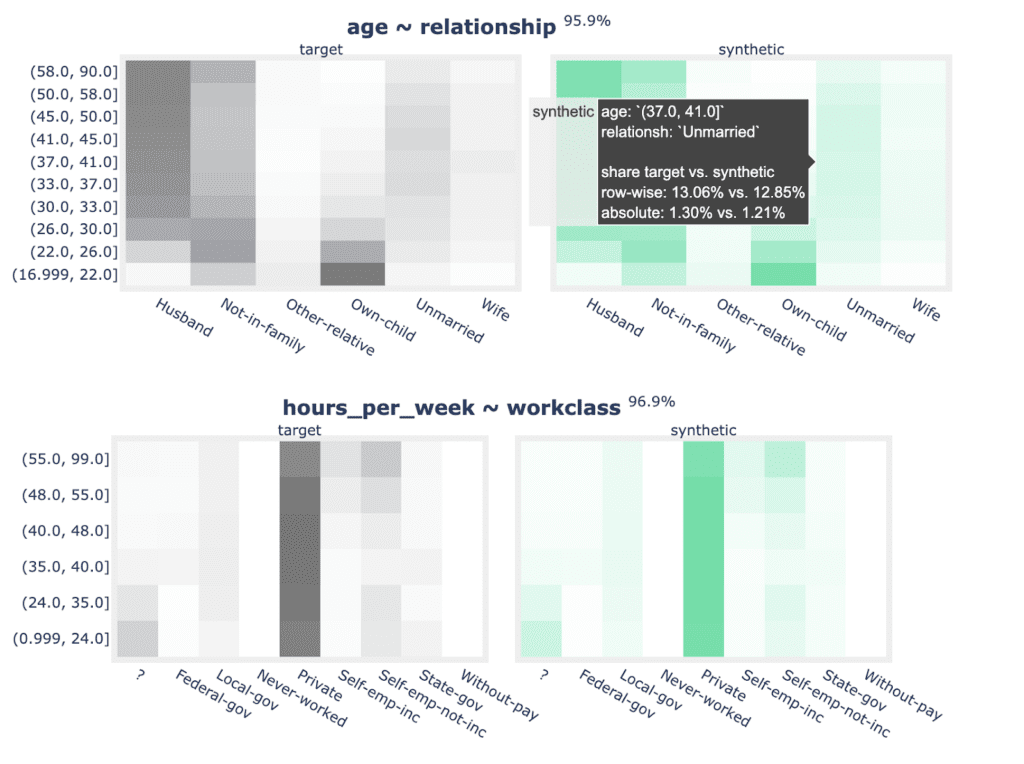
Fig 6 - Sample of 2 bivariate distribution plots.
Now that you have replicated the accuracy component of the QA Report in sufficient detail, let’s move on to the privacy section.
Synthetic data privacy
Just like accuracy, the privacy metric is also calculated as a distance-based value. To gauge the privacy risk of the generated synthetic data, we calculate the distances between the synthetic samples and their "nearest neighbor" (i.e., their most similar record) from the original dataset. This nearest neighbor could be either in the training split or in the holdout split. We then tally the ratio of synthetic samples that are closer to the holdout and the training set. Ideally, we will see an even split, which would mean that the synthetic samples are not systematically any closer to the original dataset than the original samples are to each other.
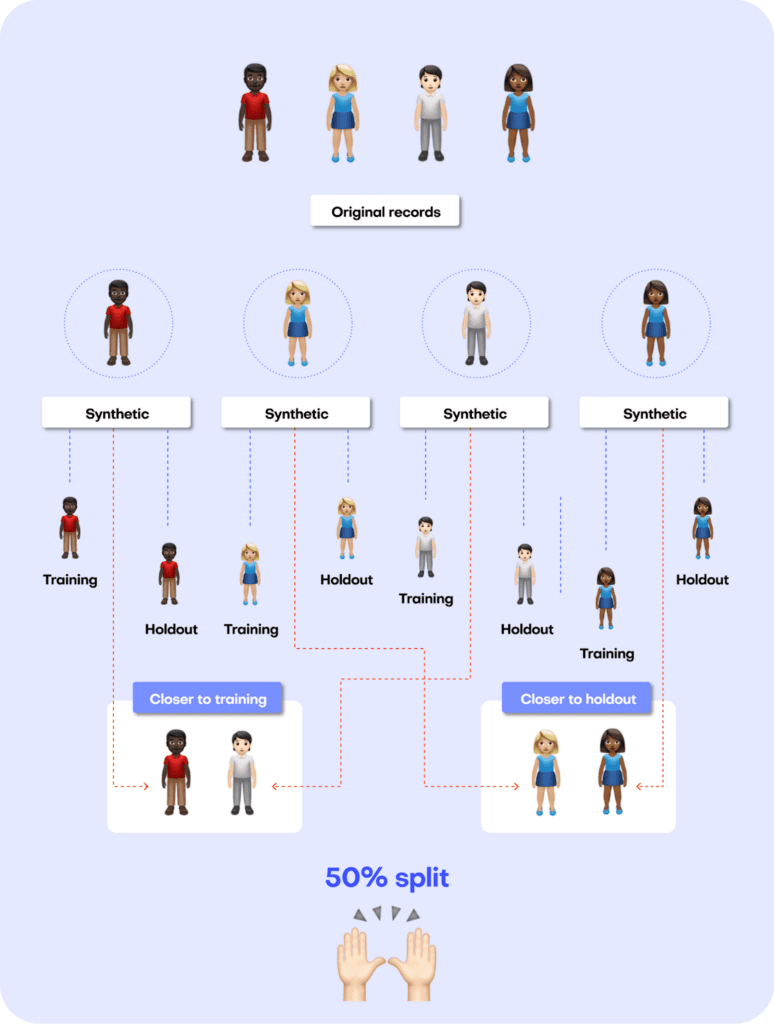
Fig 7 - A perfect synthetic data generator creates synthetic records that are just as different from the training data as from the holdout data.
The code block below uses the scikit-learn library to perform a nearest-neighbor search across the synthetic and original datasets. We then use the results from this search to calculate two different distance metrics: the Distance to the Closest Record (DCR) and the Nearest Neighbor Distance Ratio (NNDR), both at the 5-th percentile.
from sklearn.compose import make_column_transformer
from sklearn.neighbors import NearestNeighbors
from sklearn.preprocessing import OneHotEncoder
from sklearn.impute import SimpleImputer


no_of_records = min(tgt.shape[0] // 2, syn.shape[0], 10_000)
tgt = tgt.sample(n=2 * no_of_records)
trn = tgt.head(no_of_records)
hol = tgt.tail(no_of_records)
syn = syn.sample(n=no_of_records)


string_cols = trn.select_dtypes(exclude=np.number).columns
numeric_cols = trn.select_dtypes(include=np.number).columns
transformer = make_column_transformer(
    (SimpleImputer(missing_values=np.nan, strategy="mean"), numeric_cols),
    (OneHotEncoder(), string_cols),
    remainder="passthrough",
)
transformer.fit(pd.concat([trn, hol, syn], axis=0))
trn_hot = transformer.transform(trn)
hol_hot = transformer.transform(hol)
syn_hot = transformer.transform(syn)


# calculcate distances to nearest neighbors
index = NearestNeighbors(
    n_neighbors=2, algorithm="brute", metric="l2", n_jobs=-1
)
index.fit(trn_hot)
# k-nearest-neighbor search for both training and synthetic data, k=2 to calculate DCR + NNDR
dcrs_hol, _ = index.kneighbors(hol_hot)
dcrs_syn, _ = index.kneighbors(syn_hot)
dcrs_hol = np.square(dcrs_hol)
dcrs_syn = np.square(dcrs_syn)
Now calculate the DCR for both datasets:
dcr_bound = np.maximum(np.quantile(dcrs_hol[:, 0], 0.95), 1e-8)
ndcr_hol = dcrs_hol[:, 0] / dcr_bound
ndcr_syn = dcrs_syn[:, 0] / dcr_bound
print(
    f"Normalized DCR 5-th percentile original  {np.percentile(ndcr_hol, 5):.3f}"
)
print(
    f"Normalized DCR 5-th percentile synthetic {np.percentile(ndcr_syn, 5):.3f}"
)
Normalized DCR 5-th percentile original 0.001
Normalized DCR 5-th percentile synthetic 0.009
As well as the NNDR:
print(
    f"NNDR 5-th percentile original  {np.percentile(dcrs_hol[:,0]/dcrs_hol[:,1], 5):.3f}"
)
print(
    f"NNDR 5-th percentile synthetic {np.percentile(dcrs_syn[:,0]/dcrs_syn[:,1], 5):.3f}"
)
NNDR 5-th percentile original 0.019
NNDR 5-th percentile synthetic 0.058
For both privacy metrics, the distance value for the synthetic dataset should be similar but not smaller. This gives us confidence that our synthetic record has not learned privacy-revealing information from the training data.
Quality assurance for synthetic data with MOSTLY AI
In this tutorial, you have learned the key concepts behind MOSTLY AI’s Quality Assurance framework. You have gained insight into the preprocessing steps that are required as well as a close look into exactly how the accuracy and privacy metrics are calculated. With these newly acquired skills, you can now confidently and efficiently interpret any MOSTLY AI QA Report and explain it thoroughly to any interested stakeholders.
For a more in-depth exploration of these concepts and the mathematical principles behind them, check out the benchmarking study or the peer-reviewed academic research paper to dive deeper.
You can also check out the other Synthetic Data Tutorials:
- Tackle missing data with smart data imputation
- Generate synthetic text data
- Explainable AI with synthetic data
- Perform conditional data generation
- Rebalancing your data for ML classification problems
- Optimize your training sample size for synthetic data accuracy
- Build a “fake vs real” ML classifier
AI-generated data synthesis is on the rise and the number of software solutions available on the market is growing. Users of synthetic data have to make important decisions about which solution to use. But evaluating the quality of AI-generated synthetic datasets is challenging. How should you go about comparing different solutions?
MOSTLY AI co-developed a research-based empirical framework for evaluating the quality of mixed-type tabular synthetic data. This framework provides empirical methods to quantify both the accuracy (utility) and privacy of a synthetic dataset. This article explains how the methodology works and presents the benchmarking results of 8 synthetic data generators on 4 different datasets.
The evaluation framework allows you to confidently make the switch to generative AI synthetic data by comparing the performance of different solutions so that you can choose the best platform for your use case. You can reproduce the results or compare other solutions for yourself using the code in this public Github repository.
The black dot in the top-right corner is the ‘North Star’ of maximum privacy and utility preservation.
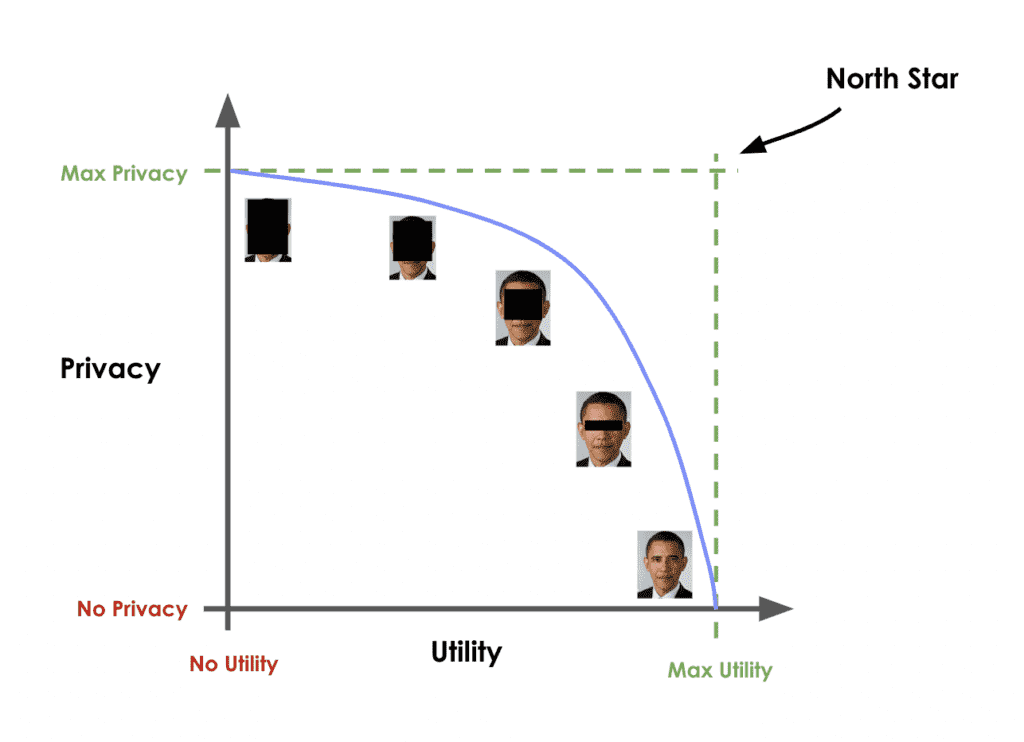
Privacy vs. Utility
Traditional data anonymization techniques struggle with the privacy-utility tradeoff for today’s datasets, which consist of more than just a handful of attributes per individual. Let’s illustrate this fundamental tradeoff with an example: you could easily add enough noise to a dataset to guarantee its privacy. However, except for the most trivial cases, the resulting data will then no longer be realistic nor representative of the original dataset. An analysis performed or a model trained on this kind of perturbed data will yield totally inaccurate results. You’ve lost your data utility.
On the other hand, you could decide to only add a marginal amount of noise. This would preserve the data utility, but would not protect against even the most basic forms of re-identification attacks. Thus, while you maintain utility, you offer no meaningful privacy protection.
Of course the ideal goal would be to achieve both: maximum data utility and maximum privacy - the "North Star" to the top right as shown in the chart below.
AI-generated synthetic data promises to be better than these conventional data anonymization techniques. But how can you quantify their ability to deliver on this promise?
How to benchmark synthetic data generators
Building a robust evaluation methodology for synthetic data generators is no easy task. This technical section will walk you through a specific evaluation framework, co-developed by MOSTLY AI. This section guides you step by step so that you gain an understanding of how the framework is built and can confidently use it to evaluate different synthetic data solutions for yourself. If you are not interested in the technical details, you can skip straight to the results.
A perfect data synthesizer should be capable of generating data samples that closely resemble actual data points that the model has never seen before. The synthetic dataset should have the same statistical characteristics as the original dataset; without revealing any private information. To assess this property, we therefore split the original data into a training and a holdout set. The generated synthetic data samples should then be just as close to the training dataset as the points in the holdout set, which are real data records that the model has never seen before.
So how does it work?
The first step is taking the original dataset and splitting it in half to yield the training and the holdout datasets. The synthesizer is only trained on the training samples (50% of the original dataset) and is then used to generate synthetic data samples. The holdout samples are never exposed to the synthesis process but kept aside for the evaluation.
We can then evaluate the quality of this generated synthetic data by evaluating whether the synthetic samples created by the trained generator are any “closer” to the training data than the holdout data.
If the synthetic data is significantly closer to the training data than to the holdout, the generative model has likely been overfitted. This would indicate that the synthetic data potentially contains information that is specific to the individuals of the training data and that does not generalize beyond those individuals. On the other hand, if the synthetic data is significantly farther away from the training data than the holdout set, we are apparently not representative of the actual data. In that scenario, we would be compromising the fidelity of the data, which negatively impacts the utility of our downstream models trained on this data.
So how do we quantify this fidelity “closeness”?
Remember that the benchmark model starts out by randomly splitting the original dataset into 2 equal halves: a training set and a holdout set. Since these are all samples from the same dataset, these two sets will exhibit the same statistics and the same distributions. Naturally, however, there will be some difference between the training and holdout sets, simply because they consist of different samples. This difference in statistics is thus due to the so-called sampling variance.
After training our synthetic data generator on the training dataset, we will then use it to generate some new, synthetic data samples. Ideally, these synthetic data should be just as far from the training data as the holdout data in terms of accuracy. In other words, there should be just as much difference between the statistics of the synthetic samples and the statistics of the training samples as between the corresponding statistics of the training samples and the statistics of the holdout samples (the difference being the magnitude of the sampling variance).
If the synthetic data is significantly closer to the training data than the holdout data, this means that some information specific to the training data has leaked into the synthetic dataset. If the synthetic data is significantly farther from the training data than the holdout data, this means that we have lost information in terms of accuracy or fidelity.
The specific distance metric we use to evaluate the fidelity of the synthetic dataset is the Total Variational Distance (TVD) between the empirical marginal distributions. It is calculated by treating all the variables in the dataset as categoricals (and thus binning any numerical features) and then measuring the sum of all deviations between the empirical marginal distributions.
This can be done for univariate, bivariate, and to some extent, also for all higher-dimensional marginal distributions. For more details on the exact implementation, read the original paper published in Frontiers in Big Data or take a look at the reproducible code in the dedicated Github repository. An Accuracy metric can then be easily defined as 1 - TVD to yield a percentage value: a synthetic dataset with a TVD of 0.05 from the holdout dataset thus translates to an accuracy of 95%, which is also reported as part of MOSTLY AI’s Quality Assurance report.
Synthetic data should match the original real-world datasets as closely as possible. This is true not only for the distribution of individual attributes or features but also for their multivariate combinations and the relationships among the set of attributes. This becomes complex very fast due to the curse of dimensionality: a dataset of 50 attributes (or columns in a traditional tabular dataset) will have 1,225 bivariate interactions and 19,600 three-way interactions (!) How do we quantify the closeness of the synthetic dataset across so many dimensions?
The solution proposed in the framework co-developed by MOSTLY AI is a non-parametric, model- and assumption-free approach to empirically measure the fidelity as the Total Variational Distance of the empirical marginal distributions.
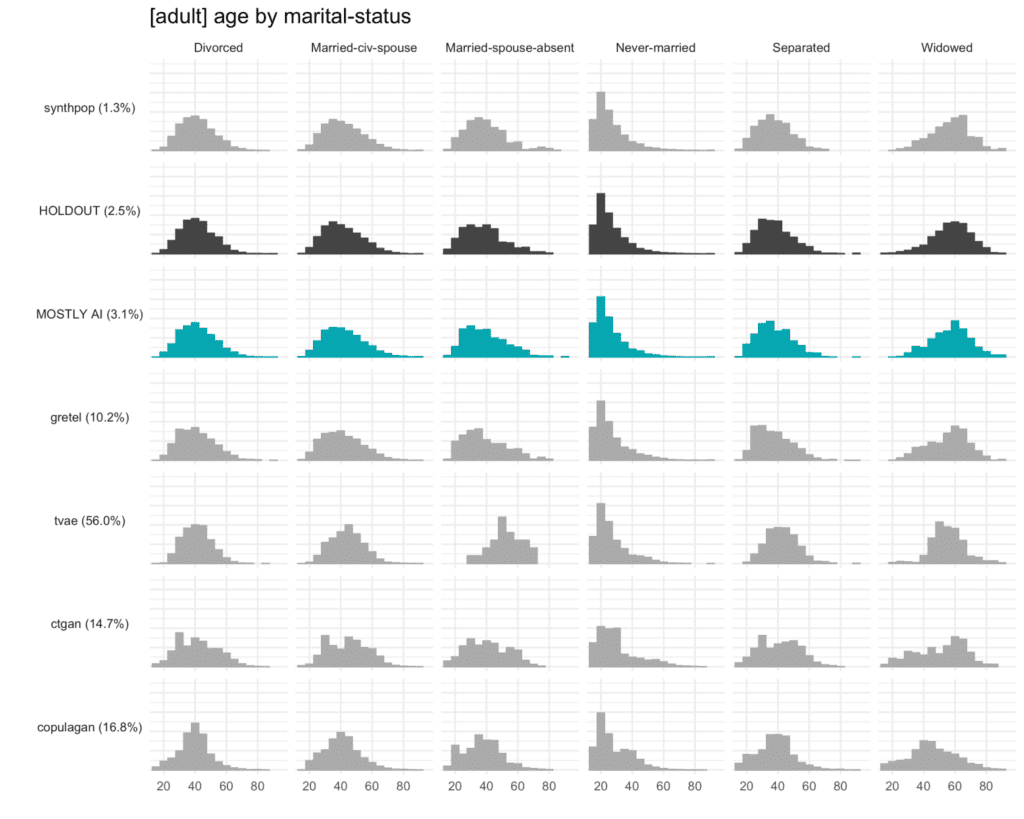
This may sound complex but becomes intuitive when translated into a visualization such as the one below. It’s relatively easy to identify which distributions resemble that of the HOLDOUT set and which don’t. The copulagan distribution for age by “widowed”, for example, is clearly deviating significantly from the distribution in the HOLDOUT set.
For each multivariate combination, the framework evaluates the similarity between the distributions as the Total Variational Distance and measures an average of all these similarities to report a single summary metric.
Privacy
Just as for accuracy, we start by splitting the dataset into equal training and holdout sets, train the generator on the training set and then use the generator to create a synthetic dataset.
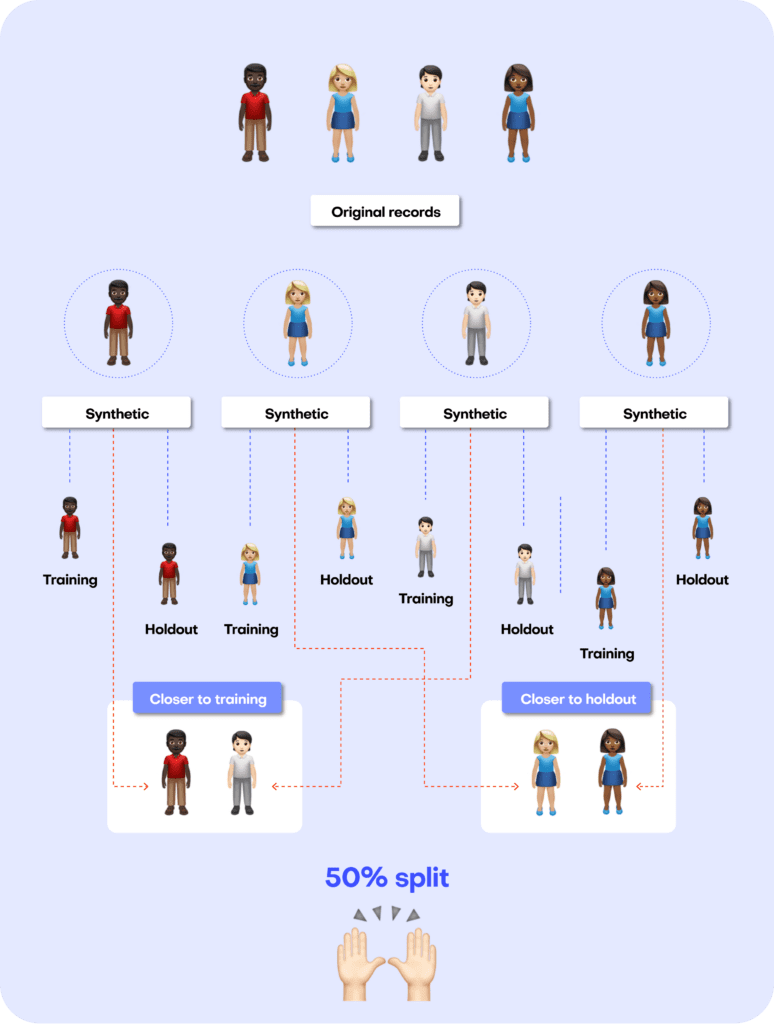
For each individual in the synthetic dataset, we then find its nearest neighbor in the training dataset. The nearest neighbor is the individual in the training set which most closely resembles it. We measure the distance between these two neighbors using the Distance to Closest Record method and compare the distance to its nearest neighbor in the holdout dataset. We repeat this for every synthetic sample to calculate the share of records that are closer to a training than to a holdout record.
A resulting share of 50% would mean that the synthetic dataset is just as different from the original training data as from the holdout set. This would give a strong signal that no private information from the training dataset has made it into the synthetic dataset.
Benchmark results
To see the benchmarking framework in action, we used it to evaluate 8 publicly accessible synthetic data generators on 4 unique datasets.
The following generators are included in the benchmark:
- 4 generators contained as part of MIT’s Synthetic Data Vault (SDV) library, specifically the CopulaGAN, CTGAN, Gaussian Copula, and TVAE synthesizers;
- the synthcity RTVAE generator;
- the synthpop R package;
- an open-sourced generator by Gretel;
- MOSTLY AI’s proprietary generator.
Both Gretel and MOSTLY AI were accessed through their web-based browser applications. The other generators were accessed using their respective Python and R APIs. All generators were used with their default settings, so no parameter-tuning was performed. The code to reproduce the benchmarks is available on Github.
The datasets included in the benchmarks are:
- adult: 48,842 records with 15 attributes (6 numerical, 9 categorical)
- bank-marketing: 45,211 records with 17 attributes (7 numerical, 10 categorical)
- credit-default: 30,000 records with 24 attributes (20 numerical, 4 categorical)
- online-shoppers: 12,330 records with 18 attributes (4 numerical, 14 categorical)
Fidelity performance on a single dataset
The plot below shows the Total Variational Distance of each synthetic dataset trained on the adult dataset, measured once for all univariate distributions, once for all bivariate distributions, and once for all 3-way interactions. The higher the TVD value, the further away the synthetic data points are from the training data, indicating a loss in terms of accuracy.
Only MOSTLY AI and synthpop achieve proximity to the original data, measured as their distance from the holdout dataset. All other synthesizers seem significantly less performant in terms of accuracy, resulting in insights or ML models that are not necessarily representative of the real world. If one looks close, then one can see that synthpop actually seems to do its job too well – its synthetic samples are closer to the training data than the holdout which may be a sign of an overfitted model.
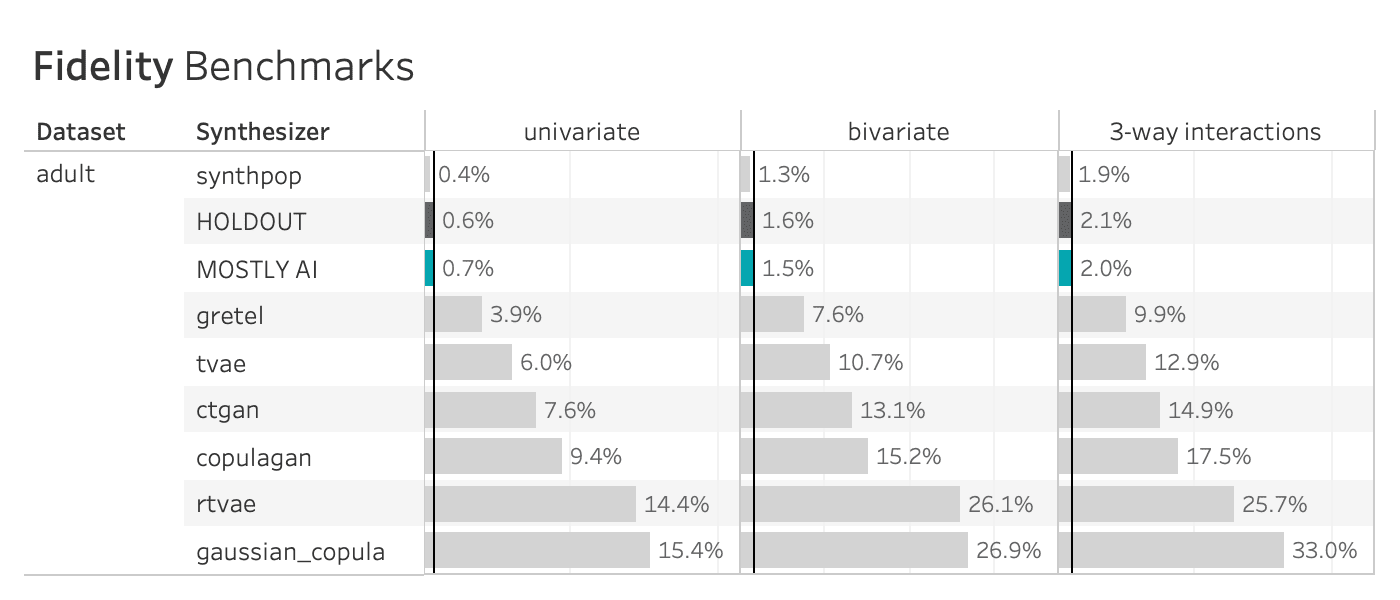
Many of the synthetic data generators create data that is significantly different from the holdout adult dataset, indicating a loss of data utility. Only MOSTLY AI and synthpop closely resemble the holdout dataset.
Fidelity Performance on all Four Datasets
The table below shows the performance of the 8 data synthesizers on all 4 benchmarked datasets, measured as the TVD. The HOLDOUT row shows the deviation measured for the holdout dataset, and serves us as a reference to quantify deviations expected due to the sampling variance. The synthetic datasets should match the Holdout fidelity score as closely as possible.
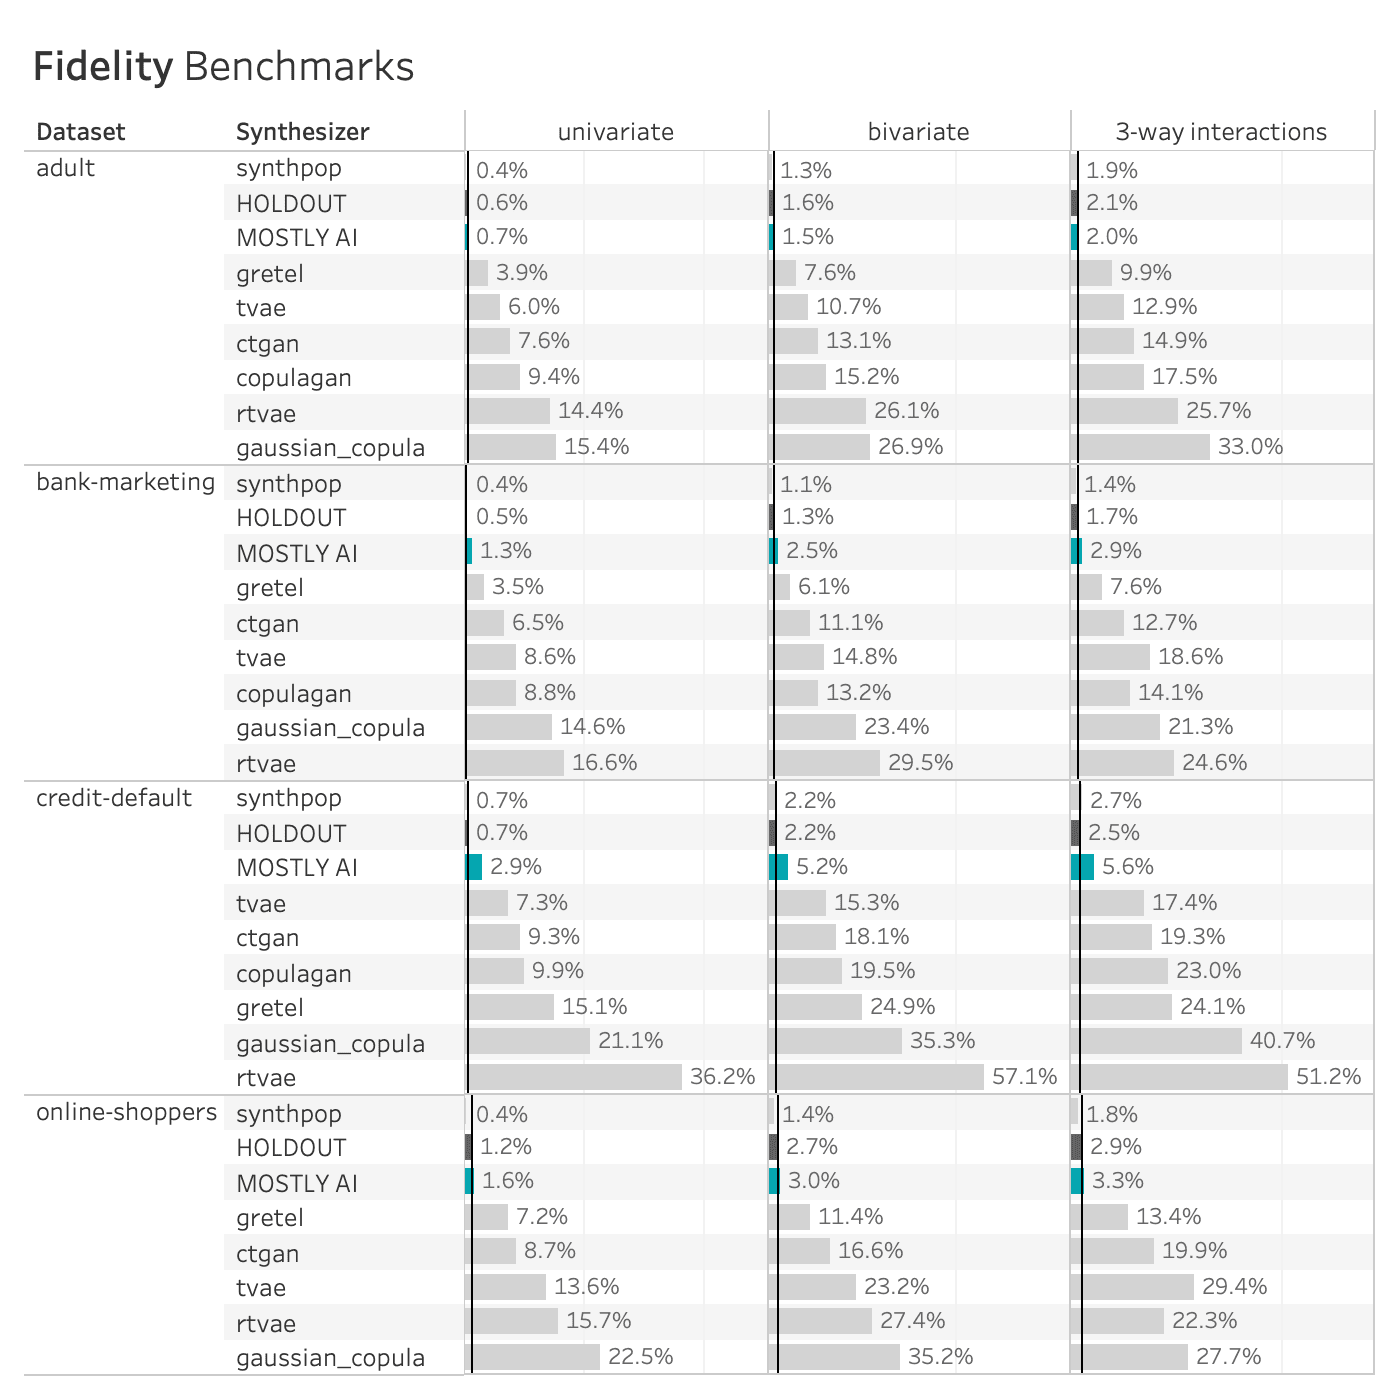
Many of the synthetic data generators create data that is significantly different from the holdout data, indicating a loss of data utility. The copulagan synthesizer failed to complete the online-shoppers benchmark. Only MOSTLY AI and synthpop closely resemble the holdout dataset.
The patterns seen on the adult dataset above are consistent across synthesizers and datasets. The Synthetic Data Vault and Synthcity generators compromise significantly on accuracy. The Gretel synthesizer does better but is still quite far (different) from the holdout set, especially for the bivariate and three-way interactions. Only MOSTLY AI and synthpop closely resemble the distribution of the holdout dataset, with synthpop consistently being closer to the training dataset than the holdout (i.e. potentially overfitting the training data).
Privacy Performance on a Single Dataset
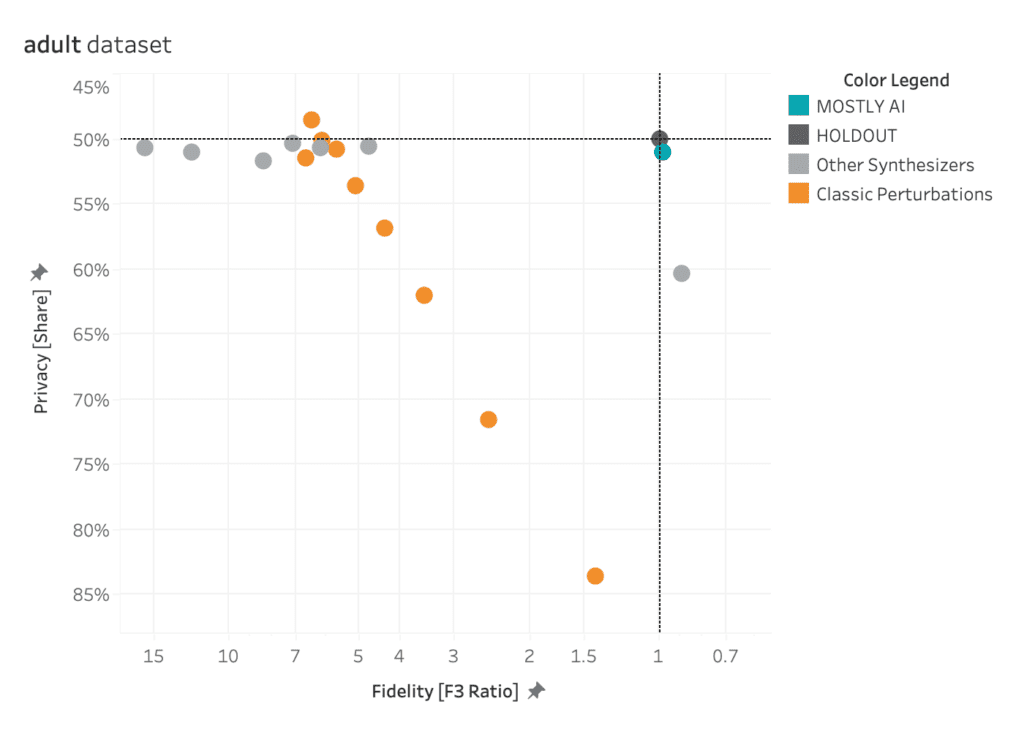
The plot below shows the privacy evaluation of the 8 benchmarked synthetic data generators, as well as for a varying degree of classic perturbation techniques, on the adult dataset. On the one hand, we report the ratio of the distance to the closest record (DCR) with respect to the training samples vs. with respect to the holdout samples. Here, a ratio of 1 would indicate that the synthetic samples are not any closer to the training samples than to the holdout samples. On the other hand, we also report the share of samples that is closer to a training sample than to a holdout sample. A share of 50% would indicate that the synthetic samples are just as likely to be closer to training than to a holdout record.
Almost all of the synthetic data generators are able to achieve a Privacy Share close to 50% (respectively a DCR Ratio close to 1) indicating that they are doing a good job of preserving the privacy of the records in the training dataset. Only synthpop seems to be slightly overfitting on the training data, confirming the previously reported results. All of the synthesizers seem fair to excellent when compared to the classic perturbation techniques that simply try to protect data by randomly substituting values.
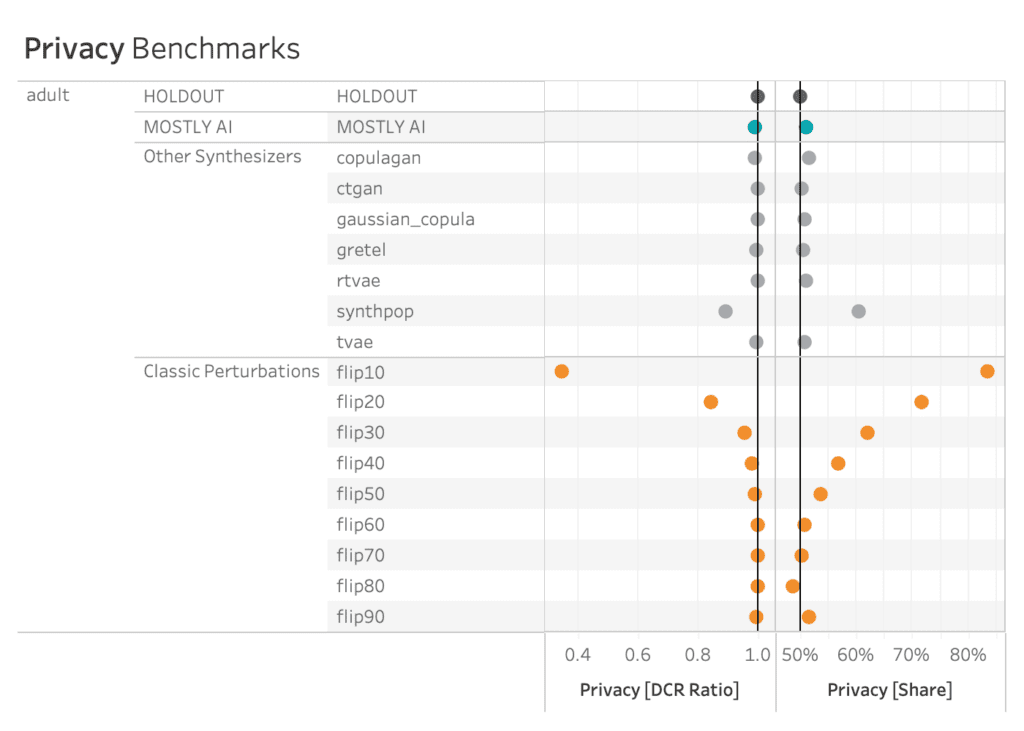
AI-driven synthesizers outperform classic perturbation techniques in terms of privacy measures.
Privacy Performance on all Four Datasets
The patterns seen on the adult dataset above are again consistent across synthesizers and datasets, with some greater variability on the credit-default and online-shoppers datasets. See below for full details. However, as argued before, privacy is only half the picture, and cannot be looked at in isolation. For that reason, it’s crucial to evaluate privacy and fidelity together, as shown in this final section.
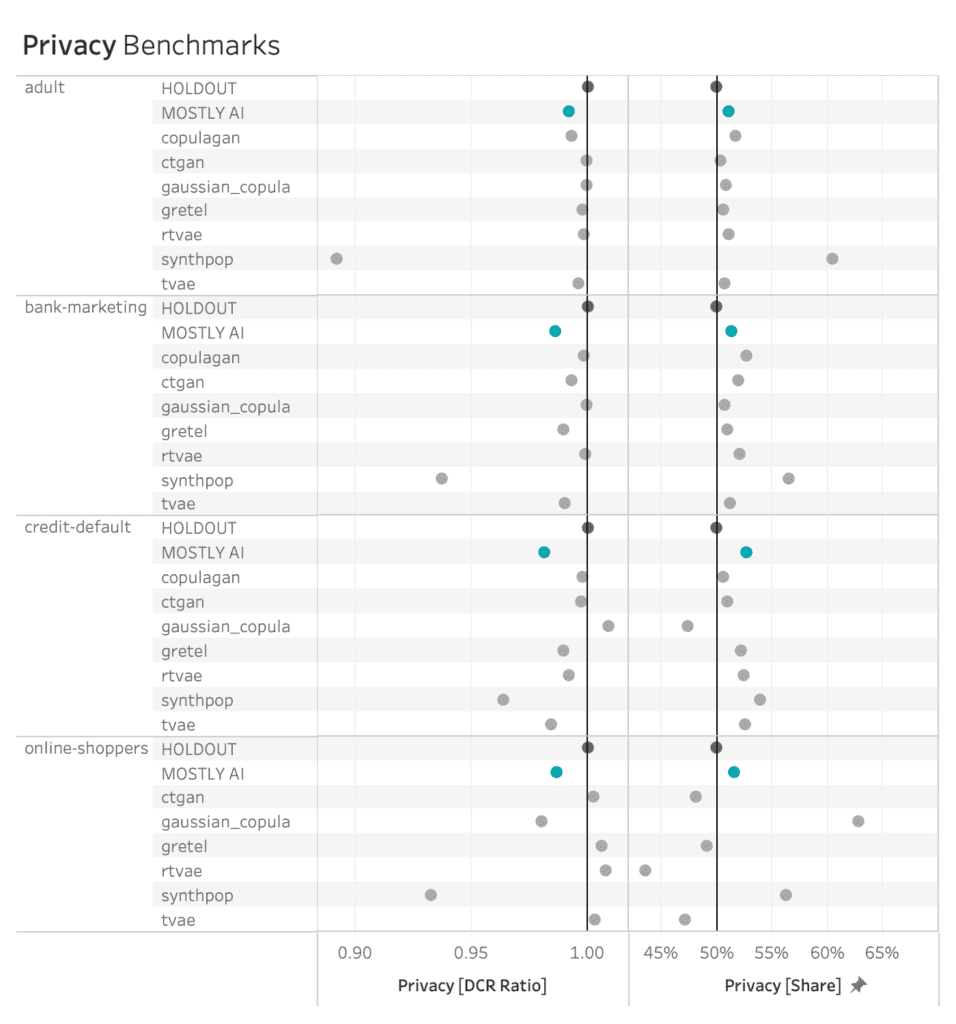
MOSTLY AI consistently ranks among the best synthesizers in terms of privacy measures.
The Full Picture
AI-driven synthetic data generators promise to deliver synthetic data that overcomes the classic privacy-utility tradeoff: preserving maximum data utility without compromising on the privacy of the training data. The visualizations below show to what extent the benchmarked synthetic data generators deliver on this promise.
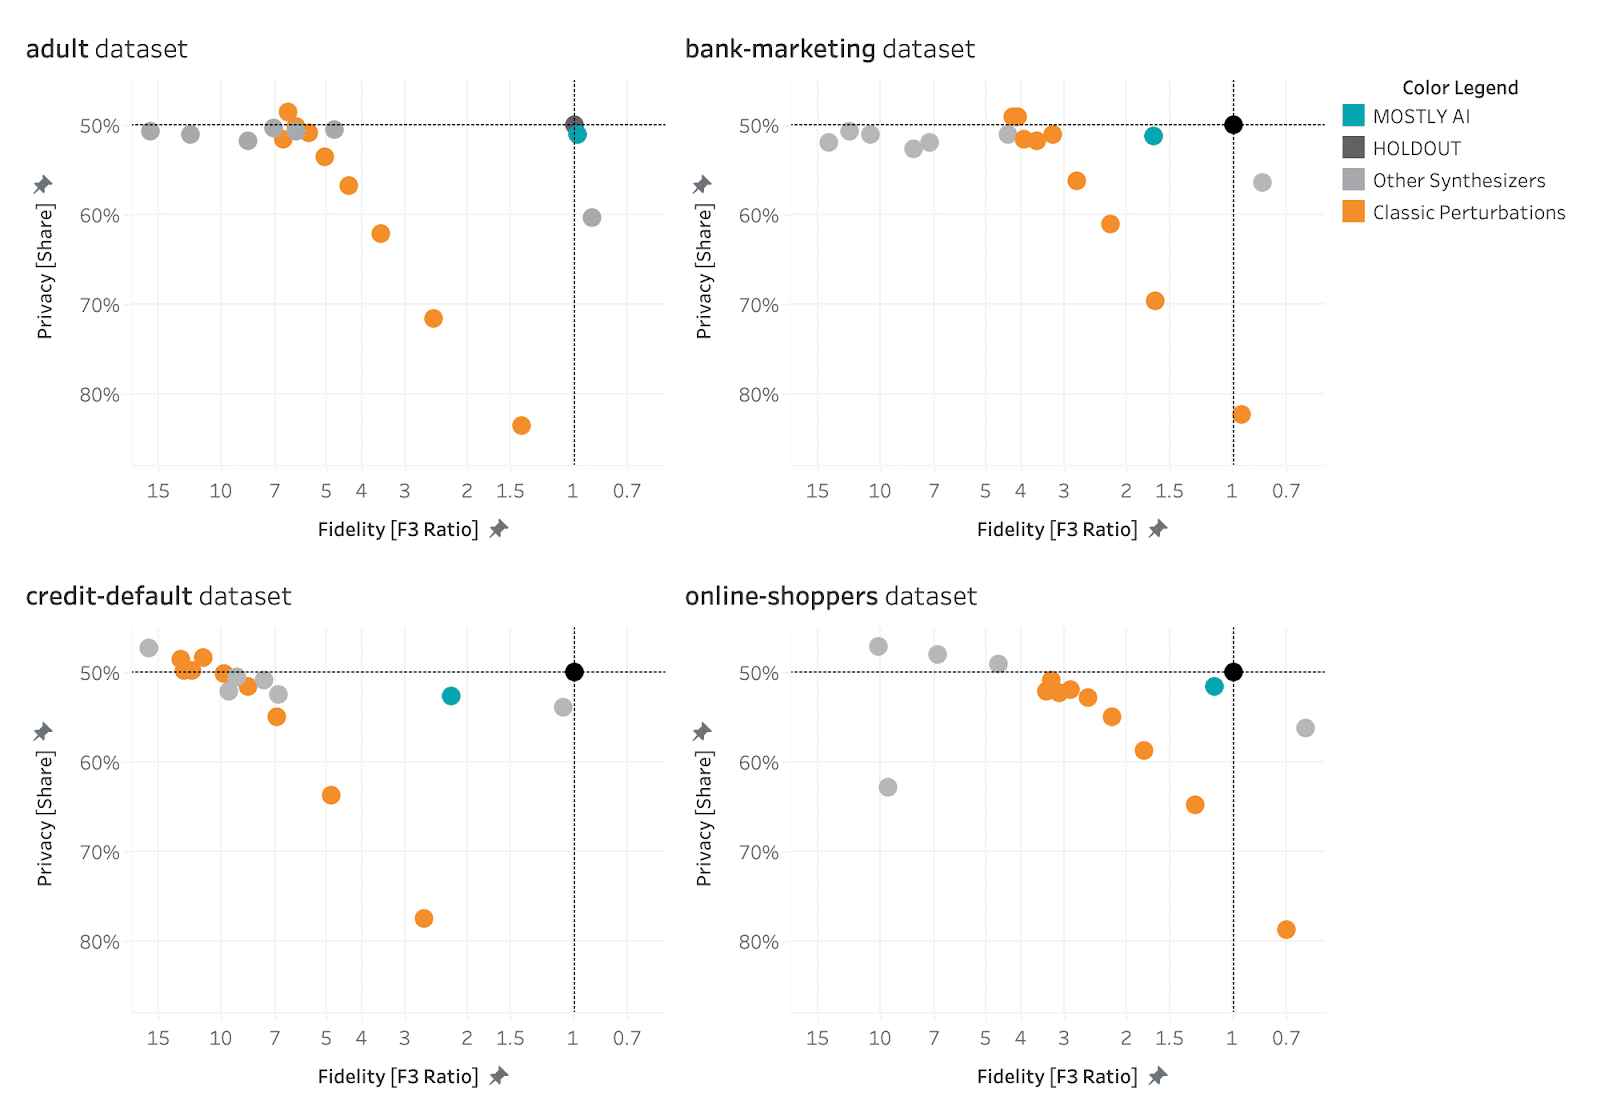
MOSTLY AI consistently ranks at the top of the benchmarked synthetic data generators in terms of both accuracy and privacy.
The black dot in the top right corner is the North Star of maximum utility and privacy preservation. The orange dots represented traditional anonymization techniques using various degrees of data perturbation. The grey dots represent the various synthetic data generators. The turqoise dot is MOSTLY AI which consistently ranks at the top of the benchmark results, both in terms of accuracy and privacy.
If you’re looking for a synthetic data generator that is able to consistently deliver optimal privacy and utility performance, give MOSTLY AI a try today and let us know what you think – the first 100K rows of synthetic data are on us!
At MOSTLY AI we talk about data privacy a lot. And we were even the first in the world to produce an entire rap dedicated to data privacy!
But what really is data privacy? And what is it not? This blog post aims to provide a clear understanding of the definition of data privacy, its importance, and the various measures being taken to protect it.
The data privacy definition
Data privacy, also referred to as information privacy or data protection, is the concept of safeguarding an individual's personal information from unauthorized access, disclosure, or misuse. It entails the application of policies, procedures, and technologies designed to protect sensitive data from being accessed, used, or shared without the individual's consent.
To fully understand data privacy we thus need to understand Personal information first. Personal information, often referred to as personally identifiable information (PII), is any data that can be used to identify, locate, or contact an individual directly or indirectly.
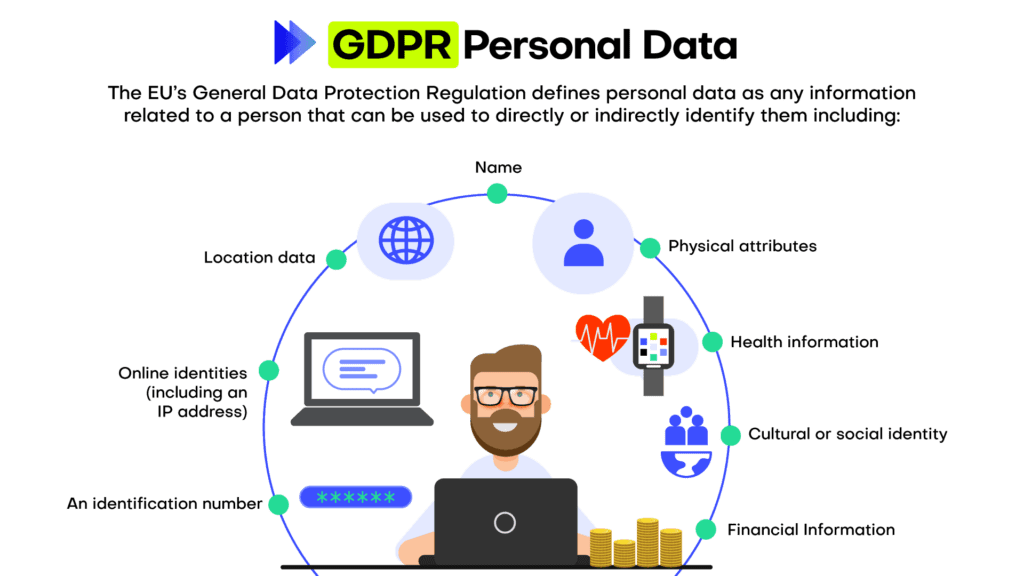
Personal information encompasses a wide range of data points, including but not limited to, an individual's name, physical address, email address, phone number, Social Security number, driver's license number, passport number, and financial account details. Moreover, personal information can extend to more sensitive data such as medical records, biometric data, race, ethnicity, and religious beliefs. In the digital realm, personal information may also include online identifiers like IP addresses, cookies, or device IDs, which can be traced back to a specific individual.
In essence, data privacy is all about the protection of personal information. Why is that important?
Why is data privacy important?
Even if you don’t care about data privacy at all, the law cares. With numerous data protection regulations and laws in place, such as the General Data Protection Regulation (GDPR) in the European Union, it is essential for organizations to adhere to these regulations to avoid legal consequences. Gartner predicts that by 2024, 75% of the global population will have its personal data covered under privacy regulations.
Many companies have realized that data privacy is not only a legal requirement, but something customers care about too. In the Cisco 2022 Consumer Privacy Survey, 76 percent of respondents said they would not buy from a company who they do not trust with their data. Ensuring data privacy helps maintain trust between businesses and their customers and can become an important competitive differentiation.
Data privacy is an important element of cybersecurity. Implementing data privacy measures often leads to improved cybersecurity, as organizations take steps to safeguard their systems and networks from unauthorized access and data breaches. This helps to ensure that sensitive personal information such as financial data, medical records, and personal identification details are protected from identity theft, fraud, and other malicious activities.
And in case you’re still not convinced, how about this: The right to privacy or private life is enshrined in the Universal Declaration of Human Rights (Article 12) – data privacy is a Human Right! Data privacy empowers individuals to have control over their personal information and decide how it is used, shared, and stored.
How to protect data privacy in an organization?
Every company, every business is collecting and working with data. To ensure data privacy there is not one thing that a company needs to do, but many things.
Foremost data privacy needs to start from the top in an organization because leadership plays a critical role in establishing a culture of privacy and ensuring the commitment of resources to implement robust data protection measures. When executives and top management prioritize data privacy, it sends a clear message throughout the organization that protecting personal information is a fundamental aspect of the company's values and mission. This commitment fosters a sense of shared responsibility, guiding employees to adhere to privacy best practices, comply with relevant regulations, and proactively address potential risks.
Once the support from the top management is established, data privacy needs to be embedded in an organization. This is typically achieved through implementing privacy policies. Organizations should have clear privacy policies outlining the collection, use, storage, and sharing of personal information. These policies should be easily accessible and comprehensible to individuals.
These policies define certain best practices and standards when it comes to data privacy. Companies that take data privacy seriously follow these, for example:
- Data minimization: Collecting only the necessary data for the intended purpose, and not retaining it longer than required, helps reduce the risk of unauthorized access or misuse.
- Data anonymization: Data anonymization is the process of removing or obfuscating personally identifiable information from datasets. The goal of data anonymization is to protect the privacy of individuals whose data is included in the dataset. Anonymized data can be shared more freely than non-anonymized data, as the risk of exposing sensitive information is greatly reduced.
- Encryption: Encrypting sensitive data ensures that even if unauthorized access occurs, the information remains unreadable and unusable.
- Access control: Implementing strict access control measures, such as strong passwords and multi-factor authentication, helps prevent unauthorized individuals from accessing sensitive data.
An entire industry around best practices and how these can be ensured (and audited!) has emerged.: Regularly auditing and monitoring data privacy practices within an organization helps identify any potential vulnerabilities and rectify them promptly.
The two most recognized standards and audits are ISO 27001 and SOC 2. ISO 27001 is a globally recognized standard for information security management systems (ISMS), providing a systematic approach to managing sensitive information and minimizing security risks. By implementing and adhering to ISO 27001, organizations can showcase their dedication to maintaining a robust ISMS and assuring stakeholders of their data protection capabilities.
On the other hand, SOC 2 (Service Organization Control 2) is an audit framework focusing on non-financial reporting controls, specifically those relating to security, availability, processing integrity, confidentiality, and privacy. Companies undergoing SOC 2 audits are assessed on their compliance with the predefined Trust Services Criteria, ensuring they have effective controls in place to safeguard their clients' data.
By leveraging ISO 27001 and SOC 2 standards and audits, organizations can not only bolster their internal security and privacy practices but also enhance trust and credibility with clients, partners, and regulatory bodies, while mitigating risks associated with data breaches and non-compliance penalties. We at MOSTLY AI have heavily invested in this space and are certified under both ISO 27001 and SOC 2 Type.
Lastly, let’s turn to the human again: the employees. Numbers are floating around the Internet that claim to show that 95% of all data breaches happen due to human error. Although the primary source for this number could not be identified, it’s probably correct. Therefore, educating employees about data privacy best practices and the importance of protecting sensitive information plays a crucial role in preventing breaches caused by human error.
Data privacy is everyone's business
Data privacy is an essential aspect of our digital lives, as it helps protect personal information and maintain trust between individuals, businesses, and governments. By understanding the importance of data privacy and implementing appropriate measures, organizations can reduce the risk of data breaches, ensure compliance with data protection laws, and maintain customer trust. Ultimately, data privacy is everyone's responsibility, and it begins with awareness and education.
A new, powerful breed of privacy attacks is emerging. One that uses AI to re-identify individuals based on their behavioral patterns. This advent has broad implications for organizations, both from compliance as well as from a risk perspective, as legacy anonymization measures are highly vulnerable. And it’s these risks that drive the surge in demand for privacy-preserving synthetic data, enabled by MOSTLY AI, as a safe and future-proof alternative - even against AI-based re-identification attacks.
The ineffectiveness of data masking
Modern-day privacy regulations, like GDPR and CCPA, consider a dataset to be anonymous, if none of the contained records can “reasonably” be re-identified, i.e. be linked to a natural person or a household. Given that, it is of critical importance to understand how re-identification works, and how it continues to evolve thanks to technological advancements (as is e.g. explicitly required by GDPR recital 26).
There used to be a time, not that long ago, where the masking of direct identifiers, like full names or social security numbers, was deemed to be sufficient to “anonymize” a dataset (see here for a more thorough historical perspective). But it is the simple composition of any of the remaining attributes that allows for the instant re-identification of individual subjects. While masking increases the effort to re-identify manually, and thus might look like an appropriate measure, it doesn’t make it any more difficult for computer-assisted attacks. It’s as simple as making a basic database query to successfully single out individuals within a huge sea of data.
One might even argue that pseudonymization techniques like masking and transformations are harmful, as it instills a false sense of security, leading organizations to risky data sharing practices. Due to an absence of direct identifiers, some individuals without privacy training, might wrongly assume that a redacted dataset is well protected, and share or process accordingly. Security, that is assumed to protect whereas it does not, is the worst possible kind, as it leads an organization to lower its guard.
But aside from lack of knowledge, there is certainly also an intentional ignorance of the problem, that can be encountered if privacy runs counter to commercial interest. Particularly by data brokers, organizations that resell insufficiently anonymized personal data, like mobility or browsing behavior to third parties. They bet on data protection authorities not enforcing the law, and/or on the broader public not caring enough, as they presumably lack the technical expertise. But one can tell that times are changing, if the New York Times, the Guardian, as well as your favorite Late Night host start to pick up the subject.

The well-established risk of linkage attacks
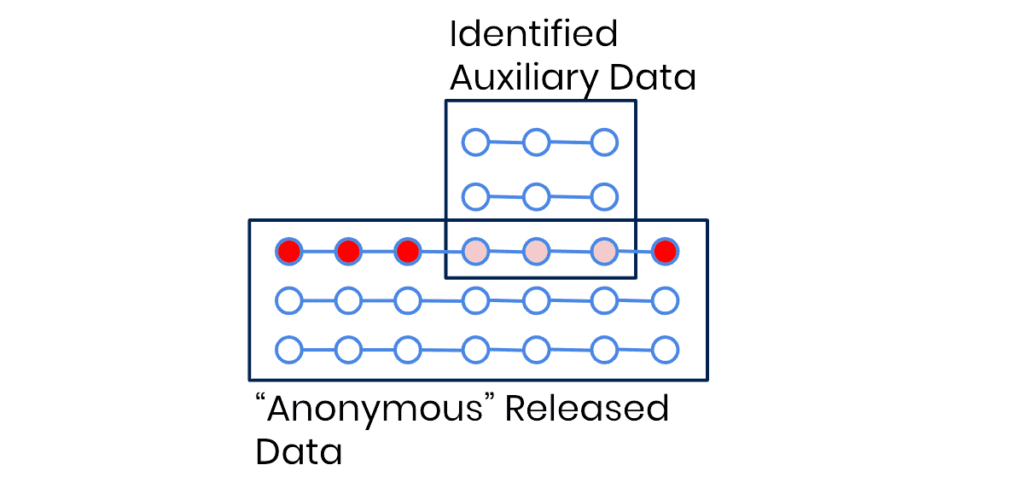
The previously described type of re-identification is also known as a linkage attack. Linkage attacks work by linking a not-yet-identified dataset (eg. a database of supposedly anonymous medical health records) with some easier-to-obtain auxiliary information on specific individuals (e.g. the day and time that a politician gave birth). The attack is then simply performed by looking for overlapping matches between the common attributes of these two sources of information. Once such a match is found, the direct identifiers can be attributed to the supposedly anonymous data records. In the previously stated example, finding a subject that gave birth at the same date and time as the politician, would then allow to attribute all the other medical records of that subject to the named politician - even though no direct identifiers were contained in the accessed database. Anyone with a basic knowledge of data querying techniques can perform such a “hack”, thus it is certainly “reasonably” likely to be performed by a malicious actor.
But linkage attacks are by far not only a concern for politicians and other prominent individuals in your customer database. They are similarly easy to perform on people like you and me. Other prominent examples of this type of attack include the re-identification of NY taxi trips, the re-identification of telco location data, the re-identification of credit card transactions, the re-identification of browsing data, the re-identification of health care records, and so forth. Also when turning towards the prominent case of re-identified Netflix users, we see a type of linkage attack being deployed. There the notable difference is, that Netflix had actually tried to prevent attacks by not only removing all user attributes, but also by adding random noise to obfuscate single records. However, as it turned out, these were all still ineffective, and a linkage attack based on fuzzy matches could be easily performed.
The new rise of powerful profiling attacks
Enter a new breed of even more capable privacy attacks, that leverage AI to re-identify individuals based on their behavioral patterns: profiling attacks. While conceptually it has been known that these types of profiling attacks are possible, their feasibility and ease of implementation has only recently been demonstrated in peer-reviewed papers. Firstly, and most prominently, by a group of leading privacy researchers, including Yves-Alexandre de Montjoye, from the Imperial College London in their recent Nature paper. There they showcase how to successfully re-identify call data records purely based on the implicit relationships between subjects, i.e. on the graph topology. Secondly, joint research by the Vienna University of Economics and Business and MOSTLY AI, demonstrated the applicability of the approach in their paper on re-identifying browsing patterns.
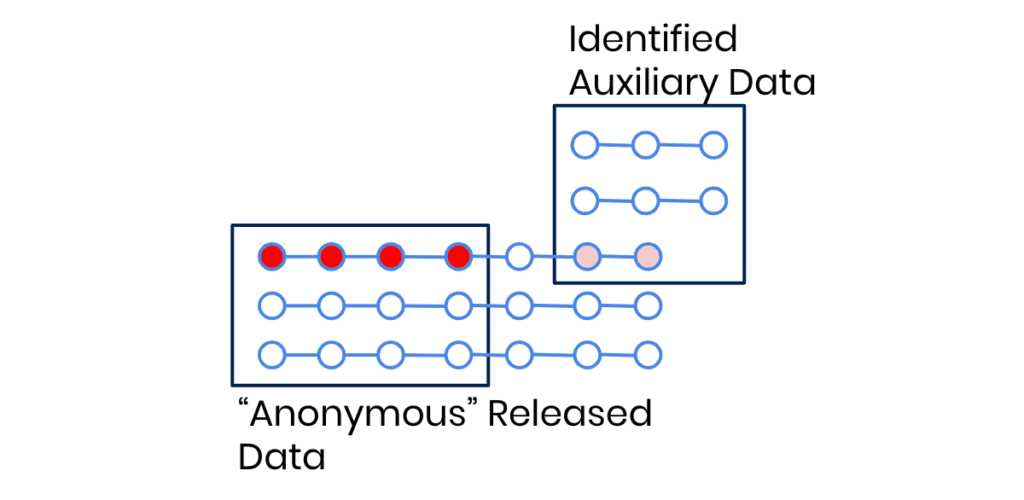
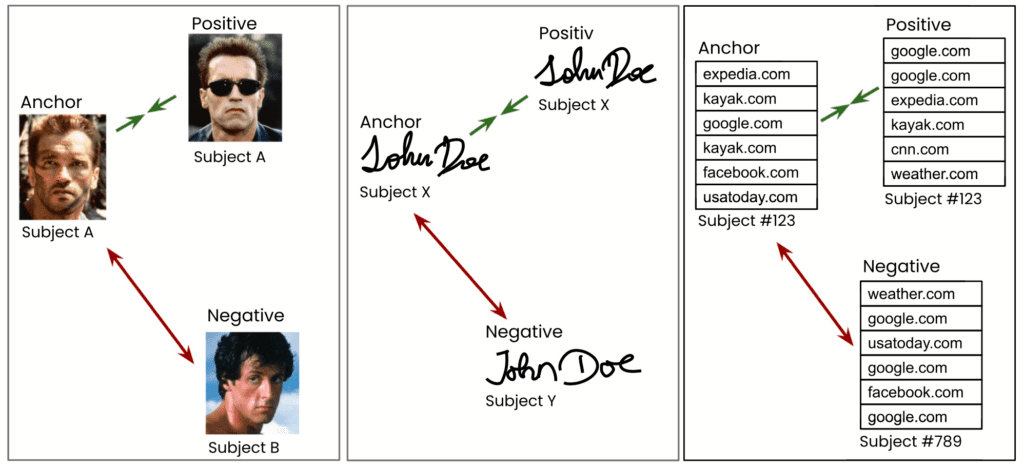
The basic idea is simple, and borrows from modern-day face recognition algorithms. An AI model is trained specifically for the re-identification of subjects, by tasking it to correctly match a randomly selected anchor sample (e.g., an image of Arnold Schwarzenegger) with any of two alternative samples, whereas only one stemmed from the same subject (i.e., another image of Arnold, plus one from a different actor). See Figure 4 for a basic illustration of the concept - for faces, for signatures, and for browsing behavior. In all of these applications the model has to learn to extract the characteristic traits, the uniquely identifying patterns, the “identifying fingerprint” of a data record, while disregarding any other irrelevant information. That characteristic information can then be distilled from any new data in the form of a numeric vector, which then allows to define a distance measure between records of individual subjects. Equipped with that, the profiling attack itself is subsequently as simple as looking for the nearest neighbor of the identified auxiliary data record within the not-yet-identified database.
What is truly remarkable and has a significant impact on the scope of privacy regulations is the efficiency of this methodology. Even though neither geographic, nor temporal, nor subject-level information, nor any overlapping event data have been available, the researchers were able to successfully re-identify the majority of subjects with a generic, domain-agnostic approach. One that works for re-identifying faces, signatures, as well as any sequence of tabular data. The authors further demonstrated the robustness of the method. Creţu et al. showed that the characteristic relations within call data records remained stable across several months, thus allowing re-identification based on data collected at a significantly later stage, casting major concerns on current data retention policies. And Vamosi et al., on the other hand, showed the robustness towards data perturbations. Even in cases where a third of the data points were completely randomly substituted, the re-identification algorithm found the correct match 27% of the time in a pool of thousands of candidates. Thus, the AI-based re-identification is shown to be highly robust against noise. If we expand the search to find matches within the Top 10 or Top 100 nearest neighbors, the success rate goes up significantly . This also means that just a single additional, seemingly innocuous data point - like age or zip code - will likely result in a perfect match once combined with the power of a profiling attack.
Synthetic data is immune to AI-based re-identification attacks
The three basic techniques applied by legacy anonymization solutions are 1) the removal of attributes, 2) the generalization of attributes, and 3) the obfuscation or transformation of attributes. However, by now we have arrived in an era where dozens, hundreds, if not thousands of data points are being gathered for each and every individual which together result in these unique digital fingerprints that make it ridiculously easy for AI to find matching behavioral patterns. The more attributes of an individual are captured, the more it stands out in today's high-dimensional data spaces. And it is due to this mathematical law of high dimensions, that any of these legacy anonymization methods fail to offer protection against linkage and profiling attacks unless they destroy almost the entirety of the contained information.
Thus, leading organizations, that recognize the business value of customer trust, stop the risky practice of transferring actual production data into non-production environments. The data of a customer shall ideally only be used for serving that actual customer. For all other purposes they start to break the susceptible 1:1 link to actual data subjects, and adopt statistically representative synthetic data at scale.
Yet, as we’ve also demonstrated before, synthetic data is not automatically private by design. It needs to be properly empirically vetted. The distance measure from the newly introduced AI-based profiling attacks now provides one of the strongest possible assessments of the privacy of synthetic behavioral data. And with that, it is shown that synthetic data by MOSTLY AI - thanks to its range of in-built privacy mechanisms - is truly privacy-preserving. And thus fully anonymous under GDPR, CCPA and in the strictest possible sense.
Hence, the news is out: The time for legacy anonymization is up and privacy-preserving synthetic data is the future. If you are ready to embark on that future, don’t hesitate to contact us, and we are happy to onboard you to MOSTLY AI - the leader in structured synthetic data.
Credits: The research collaboration between WU Wien and MOSTLY AI is supported by the "ICT of the Future” funding programme of the Austrian Federal Ministry for Climate Action, Environment, Energy, Mobility, Innovation and Technology.
We talked to test engineers, QA leads, test automation experts and CTOs to figure out what their most common test data generation issues were. There are some common themes, and it's clear that the test data space is ready for some AI help.
The biggest day-to-day test data challenges
Enterprise architectures are not prepared to provide useful test data for software development. From an organizational point of view, test data tends to be the proverbial hot potato no one is willing to handle. The lack of quality test data results in longer development times and suboptimal product quality. But what makes this potato too hot to touch? The answer lies in the complexity of test data provisioning. To find out what the most common blockers are for test architects, we first mapped out how test data is generated today.
1. Copy production data and pray for forgiveness
Let's face it. Lots of dev teams do this. With their eyes half-closed, they copy the production data to staging and hope against the odds that all will be fine. It never is, though. Even if you are lucky enough to dodge a cyberattack, 59% of privacy incidents originate in-house, and most often, they are not even intentional.
Our advice for these copy-pasting daredevils is simple: do not do that. Ever. Take your production data out of non-production environments and do it fast.
2. Using legacy data anonymization like data masking or obfuscation and destroy the data in the process
Others in more privacy-conscious industries, like insurance and banking, use legacy data anonymization techniques on production data. As a direct consequence of data masking, obfuscation, and the likes, they struggle with data quality issues. They neither have the amount nor the bandwidth of data they need to meaningfully test systems. Not to mention the privacy risk these seemingly safe and arguably widespread practices bring. Test engineers are not supposed to be data scientists well versed in the nuances of data anonymization. Nor are they necessarily aware of the internal and external regulations regarding data privacy. In reality, lots of test engineers just delete some columns they flagged as personally identifiable information (PII) and call it anonymized. Many test data creation tools out there do pretty much the same automatically, conveniently forgetting that simply masking PII does not qualify as privacy-safe.
3. Manually create test data
Manual test data creation has its place in projects where entirely new applications with no data history need to be tested. However, as most testers can attest, it is a cumbersome method with lots of limitations. Mock data libraries are handy tools, but can’t solve everything. Highly differentiated test data, for example, is impossible to construct by hand. Oftentimes, offshore development teams have no other choice but to generate random data themselves. The resulting test data doesn't represent production and lacks a balance between positive cases, negative cases, as well as unlikely edge cases. A successful and stress-free go-live is out of reach both for these off-shore teams and their home crew. Even when QA engineers crack the test data issues perfectly at first, keeping the test data consistent and up-to-date is a constant struggle. Things change, often. Test data generation needs to be flexible and dynamic enough to be able to keep up with the constantly moving goalposts. Application updates introduce new or changed inputs and outputs, and test data often fails to capture these movements.
The tragic heroes of software testing and development
It's clear that data issues permeate the day-to-day work of test engineers. They deal with these as best as they can, but it does look like they are often set up for unsolvable challenges and sleepless nights. In order to generate good quality test data, they need to understand both the product and its customers. Their attention to detail needs to border on unhealthy perfectionism. Strong coding skills need to be paired with exceptional analytical and advanced data science knowledge with a generous hint of privacy awareness. It looks like the good people of testing could use some sophisticated AI help.
What does the future of AI-generated test data look like?
Good test data can be generated without thinking about it and on the fly. Good test data is available in abundance, covering real-life scenarios as well as highly unlikely edge cases. Good test data leads to quantifiable, meaningful outcomes. Good test data is readily available when using platforms for test automation. AI to the rescue! Instead of expecting test engineers to figure out the nuances of logic and painstakingly crafting datasets by hand, they can use AI-generated synthetic data to increase their product quality without spending more time on solving data issues. AI-generated synthetic data will become an important piece of the testing toolbox. Just like mock data libraries, synthetic data generators will be a natural part of the test data generation process.
As one of our QA friends put it, he would like AI "to impersonate an array of different people and situations, creating consistent feedback on system reliability as well as finding circumstantial errors." We might just be able to make his dreams come true.
From where we stand, the test data of the future looks and feels like production data but is actually synthetic. Read more about the synthetic data use case for testing and software development!
Working within the sales team allows me to speak with a wide range of companies across a broad spectrum of industries. Data protection and data innovation seem to be the main concerns that I encounter. In the following blog post, I'll give an overview of the most common data and privacy business problems I hear about from our clients. The general trend is that companies want to access the vast amount of data that can help with strategic decisions and improve their services and products. There seem to be some underlying themes when it comes to having a strong data protection framework and being more data-driven and innovative. The two things appear antithetical to each other on the surface.
The data privacy vs. utility trade-off
We refer to this as the privacy vs. utility trade-off. Until a few years ago, the methods of protecting customers’ data have either been pseudonymization or some other form of data masking. This not only destroys the utility of the data set, but classic anonymization endangers privacy in more ways than one. MOSTLY AI is challenging this dangerous status quo by providing synthetic data alternatives to help companies become more innovative and data-driven. We are taking on the privacy-utility trade-off.
The most common business problems synthetic data can solve
#1 “Privacy gaps and the risk of re-identification are real threats”
With stringent regulations such as GDPR, CCPA, and so forth, the need for organizations to have a strong data protection strategy in place is of the utmost importance. So is the watertight protection of sensitive personal information. Within the banking, insurance, healthcare, and pharma sectors, this is an important function because they know how randomly data breaches can strike and the consequences they can have. At the same time, there is a need to use this data to keep the company’s operations going and improve its service. Companies try to reconcile these, and what they often end up with is an illusion of privacy provided by less-than-secure, outdated anonymization techniques. Although privacy budgets doubled in 2020 to an average of $2.4 million, privacy departments often still lack the technological competencies necessary to assess data privacy risks and to use privacy-tech solutions to offer meaningful access to data.
Synthetic data really changes the way things are done, as it allows companies to share synthetic data sets, which still provide the full picture but without the sensitive information. This helps companies continue with their objectives while mitigating the risk of sensitive data being leaked and re-identified.
We often ask clients to try to think of data as a product they should build and sell across their organizations. As with all products, the method of manufacturing is what makes that product safe to use. According to Gartner, 59% of privacy incidents originate with an organization’s own employees, and although data literacy certainly helps, the goal of every organization should be to provide safe-to-use data products in the first place. Synthetic data products are safe to use in all downstream tasks, from analytics to testing and AI training.
#2 ‘Getting access to data takes time’
We all know that the sensitive information that companies have needs to be protected, which is done by implementing a strong, strict data governance policy with checks and balances in place. It’s an important function, but it also means that the process to get access to data internally can take a while. This means that projects can take longer or even be killed, and this can cause frustration.
Customer data needs to be used across many departments. Some examples include Product’s desire to analyze customer data so that more customer-centric products can be made. QA needs data that mimics customer data realistically to help test applications and ensure that all edge cases are covered. Data, BI, and Analytics need to analyze the data to make findings that assist management in making strategic decisions. You know what I mean, though; the demand for data internally is significant.
This is where synthetic data has really helped our clients. They were able to decrease their time to data dramatically through our MOSTLY AI synthetic data platform. Synthetic data sandboxes can even speed up traditionally cumbersome processes, such as POC evaluations in which potentially sensitive data needs to be shared with third parties. Once synthesized, Data Governance was satisfied that the data adhered to data privacy legislation and cleared the data for use. This meant that projects weren’t stalled or losing momentum.
#3 “I’m trying to scale AI, but don’t have the right data”
Most companies that we deal with sit upon a huge amount of sensitive data. We can see that all companies know the importance of and want to share this data internally to improve access to the information within the organization. AI adoption is especially fraught with data access issues.
The problem is that most data is stored away in siloed warehouses that require a lengthy internal process to access. Data issues are the main reasons why companies fail to implement AI successfully. Also, the data provisioning overhead is staggering; data scientists spend most of their time cleaning and organizing data instead of using it.
Synthetic data is more than just a privacy-safe data alternative for AI training. We’ve helped customers augment their data for AI training by synthesizing better-than-real datasets. The result is privacy-compliant AI, which performs better than models trained on production data. Using synthetic data for fraud detection is typically one of those use cases where even a few percentage points of performance improvement can result in huge savings.
Biased data gets a lot of companies into trouble when AI starts learning discriminatory patterns from imbalanced datasets. Synthetic data provides a fair solution and allows models to learn about a doctored, bias-free reality. What’s more, synthetic data can serve as a window into the souls of AI algorithms and is expected to play an important role in Explainable AI. With the recent AI regulation proposal from the EU, high-risk AI systems, such as HR software, will be subject to strict regulations demanding high quality of the datasets and regulatory oversight. Synthetic training data will be a crucial ingredient to compliance.
#4 “We are striving for a more data-driven culture”
This is one of the most common statements I come across. What we see is that all companies have their own techniques and strategies that are meant to force this cultural change. Though when it comes to implementing, both on a macro and micro level, it’s starting to get difficult as the first step towards data literacy, sharing sensitive data is difficult in itself, and the time taken to get approval means that these projects get lagged.
The difficulty we see with companies is that they’re restricted internally with this data and need to apply some data masking to actually use it. This destroys its utility, and it still can be re-identified. We think that data literacy needs a revamp. Organizing datathons are a great way to put people in touch with what’s being measured, driving innovations and increasing data literacy. Using synthetic data sandboxes, you can maximize impact and even open up these events to external talent and academia.
#5 “We want to use real data in testing environments but have trouble gaining access of this data”
We see many companies with the challenge of wanting to use real production data in non-productive environments, such as QA and testing. We can't blame them either, as the challenge they have is wanting accurate data to test their applications, and we all appreciate how difficult this process can be. Some try to create their own solution or MVP, but that doesn't yield the results they want. The data needs to be realistic to be properly used for testing environments.
What's more, most companies use partially masked data for testing, exposing production data and their customers' privacy in the process. Production data has no place in testing, no matter how scrambled or pseudonymized it is. The only safe and GDPR-compliant way forward is to go synthetic, and those who act against the inertia of embedded bad practices will emerge as the winners, gaining a competitive edge through innovation.
The need for test data is one of the main reasons why clients come to us, wanting to solve this issue by using realistic and safe synthetic data through our MOSTLY AI synthetic data platform. They have seen improvements in the testing of their products and have reduced the time taken to manually recreate their data sets with dummy data internally. They are able to attain realistic synthetic data within a short period of time once the original dataset has been placed. The resulting highly realistic synthetic version allows companies to develop data-driven digital products, ready to serve real customer needs from day one.
Do you have a question? I'm happy to talk synthetic data with you. Please feel free to contact us!
Learn about good data governance and the responsible use of AI at the next Synthetic Data Meetup!
Our speaker, Belinda Enoma, is a privacy & cybersecurity consultant in the legal and IT space. She will highlight good data governance practices and areas for algorithmic compliance and challenges that need to be continuously addressed as models are created.
She is a renowned conference host, speaker, writer and founder of istartandfinish.com. Belinda is also a mentor and coach to women in the cybersecurity and data protection industry.
Her published work includes “Data breach in the travel sector and strategies for risk mitigation,” (Journal of Data Privacy and Protection Volume 3.4, 2020). She is a Certified Information Privacy Professional (CIPP/US) and has an LLM from Benjamin N. Cardozo Law School, New York.
Register for the virtual meetup and save the date: Thursday, March 4, 2021
12:00 PM EST / 18:00 PM CET. See you there!
And is it really possible to securely anonymize the location data that is currently being shared to combat the spread of COVID-19?
To answer these and more questions, SOSA’s Global Cyber Center (GGC) invited our CEO Michael Platzer to join them on their Cyber Insights podcast for an interview. For those of you, who don’t know SOSA: it’s a leading global innovation platform that helps corporates and governments alike to build and scale their open innovation efforts. What follows is a transcript of the podcast episode.
William: Wonderful, now Micheal, when you think about the broad array of cybersecurity trends that are unfolding today – ranging from new threats to new regulations – what is really top of mind for you in 2020?
Michael: Thanks for having me! We are MOSTLY AI and we are a deep-tech startup founded here in Europe while preparing for GDPR. Very early on, we had this realization that synthetic data will offer a fundamentally new approach to data anonymization. The idea is quite simple. Rather than aggregating, masking or obfuscating existing data, you would allow the machine to generate new data or fake data. But we rather prefer to say “AI-generated synthetic data”. And the benefit is, that you can retain all the statistical information of the original data, but you break the 1:1 relationship to the original individuals. So you cannot re-identify anymore – and thus it’s not personal data anymore, it’s not subject to privacy regulations anymore. So you are really free to innovate and to collaborate on this data – but without putting your customers’ privacy at risk. It’s really a fundamental game-changer that requires quite a heavy lifting on the AI-engineering side. But we are proud to have an excellent team here and to really see that the need for our product is growing fast.
William: Very interesting! Now, we know that location data is among our most accessible PII – we kind of give it out all the time via our mobile device. In the wake of the coronavirus, we are seeing calls to use our location data to track the spread of this pandemic. Is it possible to really effectively anonymize and secure our location data? Or can this data just be reverse engineered? Could using synthetic data help?
Michael: Yes definitely, and we are also engaging with decision-makers at this moment in this crisis. Location data is incredibly difficult to anonymize. There have been enough studies that show how easy it is to re-identify location traces. So what organizations end up with is only sharing highly aggregated count statistics. For example, how many people are at which time at which location. But you lose the dimension at the individual level. And this is so important if you want to figure out what type of socio-demographic segments are adapting to these new social distancing measures, and for how long they do that. And is it 100% of the population that’s adapting, are social contacts reducing by 60% or is it maybe a tiny fragment of segments that is still spreading the virus? To get to this kind of level to intelligence you need to work at a granular level. So not on an aggregated level, but on a granular level. Synthetic data allows you to retain the information on a granular level but break the tie to us individually. We just, coincidentally, in February wrote a blogpost on synthetic location traces – so before the corona crisis started – because we were researching this for the last year. It’s on our company blog and I can only invite people to read it. Super exciting new opportunities now to anonymize location traces!
William: That is exciting – and it sounds as if it could be very helpful, especially given what we are all going through! Now, Micheal, there is an expanding list of techniques to protect data today; from encryption schemes, tokenization, anonymization, etc. Should CISOs look at the landscape as a “grocery shelf” with ingredients to be selected and combined or should they search for one technique to rule them all?
Michael: Well, I don’t believe that there is a one-size-fits-all solution out there. And those different solutions really serve different purposes. It’s important to understand that encryption allows you to safely share data with people that you trust – or you think that you trust. Whether that’s people or machines, at the end, there is someone sitting who is decrypting the data and then has access to the full data. And you hope that you can trust the person. Now, synthetic data allows you to share data with people where you don’t necessarily need to rely on trust, because you have controlled for the risk of a privacy leak. It’s still super valuable, highly relevant information. It contains your business secrets, it contains all the structure and correlations that are available to run your analytics, to train your machine learning algorithms. But you have zeroed out your privacy risk! In that sense, synthetic data and encryption serve two different purposes. So every CISO needs to see what their particular challenge and problem is that needs to be overcome.
William: Well Michael, we’re coming up on our time here. Are there any concluding remarks or anything you would like to add before we hang up?
Michael: Well, we just closed our financing round so we’re set for further growth both in Europe as well as the US. We’re excited about the growing demand for data anonymization solutions, also for our solution. Happy to collaborate with innovative companies, who take privacy seriously. And of course, I wish everyone best of health and that we get – also as a global community – just stronger out of the current crisis.
Whether you’ve just heard about synthetic data at the last conference you attended or are already evaluating how it could help your organization to innovate with your customer data in a privacy-friendly manner, this mini video series will cover everything you need to know about synthetic data:
- What is it? (Pssst, spoiler: a fundamentally new approach to big data anonymization)
- Why is it needed?
- Why classic anonymization fails for big data (and how relying on it puts your organization at risk)
- How synthetic data helps with privacy protection,
- Why it is important that it is AI-generated synthetic data & how to differentiate between different types
- And lastly, synthetic data use cases and insights on how some of the largest brands in the world are already using synthetic data to fuel their digital transformation