"each bar in this chart is a billion-dollar wedge if you build the right verticalized, trust-rich AI startup".
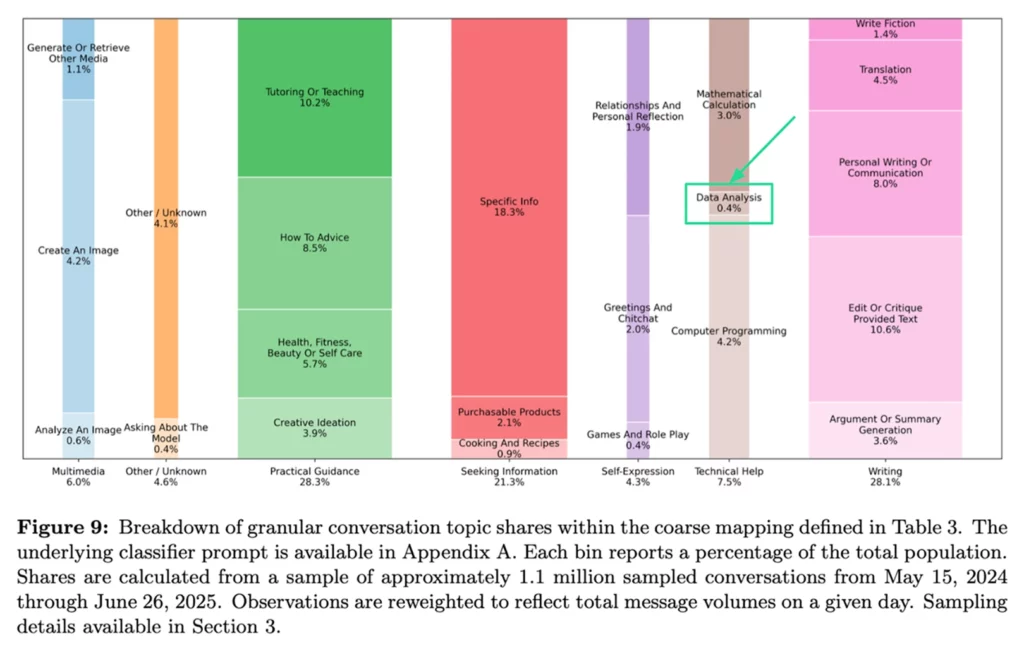
Greg Isenberg's viral take last week on OpenAI's report about How people are using ChatGPT. I read all 61 pages of the report the old fashioned way, sans LLM. As a startup focused on data intelligence, I admittedly gulped when I saw only 0.4% of use cases relate to data analysis. The counter-narrative becomes quite compelling: focus on what people are NOT using ChatGPT for, rather than going head-to-head. But that's too simplistic. There are two reasons data analysis sits at 0.4% instead of 10%: environment mismatch and data access constraints.
What does the data say?
First let's look at the broader picture, because both OpenAI and Anthropic shared a wealth of data in the past 10 days.
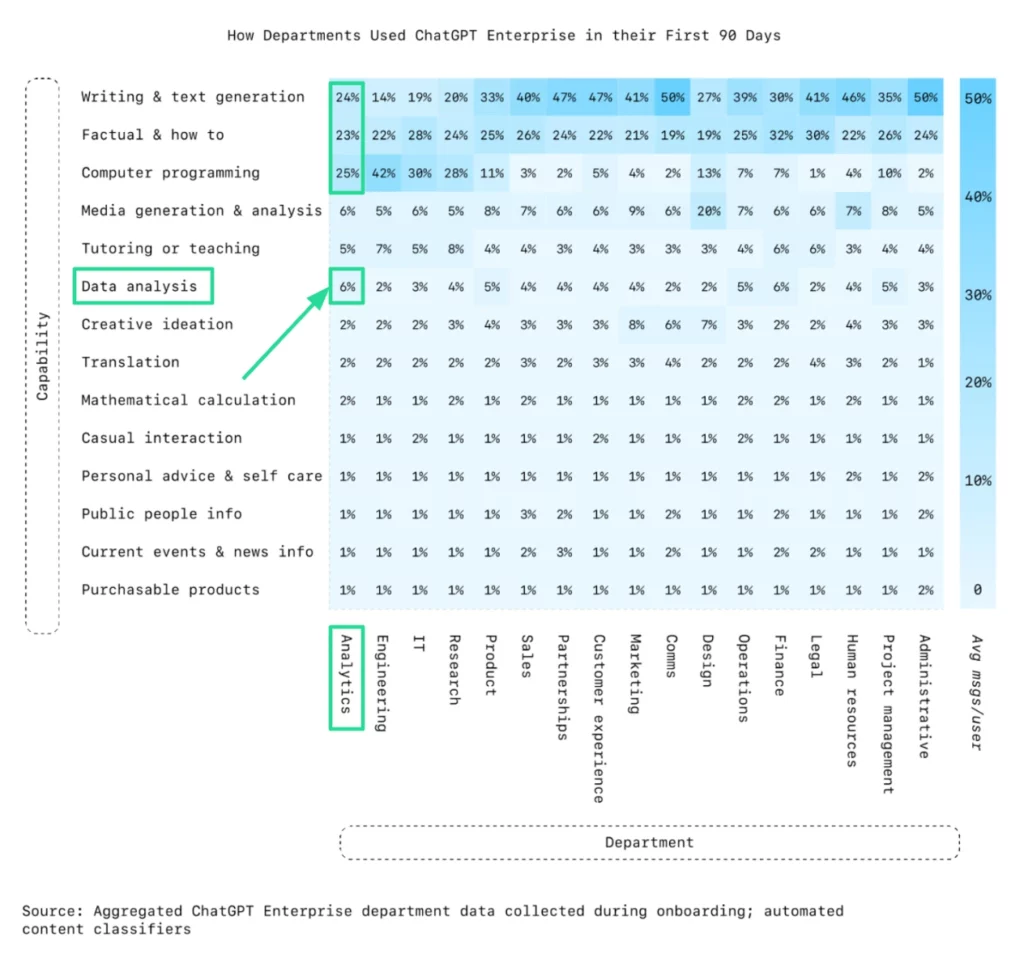
OpenAI also released ChatGPT usage and adoption patterns at work - this time looking at Enterprise data rather than the 1.5M consumer chats from the first study. Analytics departments - the people whose job is literally data analysis - spend just 6% of their time using ChatGPT for analytics work in the first 90 days. They spend 4× more time on writing and how-to queries.
Data analysis barely registers in Anthropic's Economic Index report. It hit 3.5% in their December 2024 Clio report but has since disappeared as a standalone category - at best absorbed into 'Process Business & Recruitment Data' at 1.9%.
This pattern isn't unique to data analysis. Anthropic found that despite serving different users with different interfaces, both API and consumer usage follow remarkably similar power law distributions. The bottom 80% of use case categories account for only 12.7% of usage on Claude.ai, and 10.5% for API customers.
Data analysis sits firmly in that long tail. And there's a compounding effect: as ChatGPT and Claude evolve their UX around top-performing use cases like coding and writing, it creates higher barriers for everything else. The long tail gets longer.
So why did data analysis end up there in the first place?
- First, users try these tools for data analysis and hit fundamental limitations. They are built for chat, not data work. This breaks trust and sends data analytics to the graveyard of abandoned use cases.
- Second, regulatory barriers prevent users from testing with their richest, most interesting data. Instead they experiment with dummy datasets that produce hollow results. They never experience what's possible when LLM superpowers meet real data.
The magic only happens when you solve both problems: LLM superpowers meet real data in environments built specifically for data work.
Chat Interfaces Break Down for Data Work
Incredible chat UX does not translate into incredible data UX.
To test this, I designed a progressive analysis workflow that mirrors real-world data analytics projects: exploratory data analysis → pattern investigation → predictive modeling → live data integration → data generation. Each stage builds on the previous, requiring persistent context and specialized tooling.
I ran identical prompts (detailed in appendix) across Claude Pro, ChatGPT Pro, and MOSTLY AI Pro using the same census dataset. The goal: see which platforms can handle the analytical workflow that analytics professionals actually need. Below are the results.
Claude crumbled
| Stage | Result | Comment |
| 1: EDA | Success | Basic dataset overview completed |
| 2: Pattern analysis | Fail | Artifacts failed to render, visualizations broken |
| 3: ML modelling | Fail | Python execution failed |
| 4: Live data integration | Fail | Couldn't connect to the World Bank API |
| 5: Data generation | Fail | Did not generate enriched columns |
Additional
- Cannot pip install Python libraries (SHAP, wbdata for World Bank API blocked)
- Python code execution unreliable for modeling and visualization
- Requires constant manual nudging to continue analysis
- 40MB file upload limit restricts dataset size
- Thread context frequently lost between stages


ChatGPT faltered
| Stage | Result | Comment |
| 1: EDA | Success | Delivered basic exploratory analysis |
| 2: Pattern analysis | Fail | Generated nonsensical visualizations |
| 3: ML modelling | Success | Built model but no code transparency |
| 4: Live data integration | Fail | Couldn't connect to the World Bank API |
| 5: Data generation | Success | Generated mock data without validation |
Additional
- Cannot pip install Python libraries (SHAP, wbdata for World Bank API blocked)
- Cannot fetch live files or real-time data sources
- Consistently dresses shallow analysis in sophisticated language
- Hides computational work, making results unverifiable


MOSTLY AI delivered
| Stage | Result | Comment |
| 1: EDA | Success | Advanced analysis w/ quality assessment |
| 2: Pattern analysis | Success | Advanced heatmaps and interaction analysis |
| 3: ML modelling | Success | Random Forest w/ confidence intervals & code |
| 4: Live data integration | Success | World Bank API calls and global context |
| 5: Data generation | Success | Generated mock data with realistic correlations |
Additional:
- Full Python environment with pip install (wbdata, SHAP libraries)
- Persistent datasets and context across all 5 stages
- Statistical validation and uncertainty quantification
- Comprehensive PDF report generation with all visualizations
- Live API integration without restrictions


The evidence is clear: when analytics professionals encounter artifacts that won't render, models that can't execute Python, and APIs that don't connect, they abandon AI for data work entirely. This explains the 6% usage rate among the very people who should be power users. Chat interfaces optimized for conversation break down when data work requires persistent context, reproducible methodology, and specialized tooling. It's not about LLM capability, it's about environment design.
The Data Access Problem
But environment mismatch is only half the story. Anthropic's research highlights the role of "O-Ring forces" in the extreme concentration of use cases: "if a task needs a level of reasoning Claude can't handle, internal data the firm can't access, or regulatory approval that doesn't exist, any single barrier could prevent adoption."
For data analysis, the killer barrier is data access. Regulatory and privacy constraints prevent organizations from using their richest, most interesting datasets with their LLMs. Customer behavioral data, financial records, healthcare information - the datasets that would actually demonstrate AI's analytical power are off-limits.
This is where privacy-preserving synthetic data changes everything. Organizations can generate realistic, privacy-safe data that maintains the statistical properties and behavioral patterns of their original datasets. You can run complex behavioral simulations, create coherent multi-table datasets from scratch, and unlock sensitive data for analysis - without the privacy concerns.
Synthetic data breaks the O-Ring barrier that's kept data analysis in the long tail.
Conclusion
The most interesting question for startups right now is identifying use cases where big labs can't or won't go deep - not because they lack capability, but because the solution requires specialized focus that conflicts with their platform strategy, even when the market opportunity is massive.Data analysis won't stay at 0.4%. Better models will increase analytical capability. Data-first environments will outperform chat interfaces. And synthetic data will unlock the richest datasets. Together, this will make data intelligence truly accessible - not just for experts but for everyone. Data analysis will become a dominant use case like coding and writing, but specialized startups will capture this market, not general platforms.
Appendix
Adult Census Income dataset available for download here.
Prompts used for data analysis tasks available below.
Stage 1: Exploratory Data Analysis

Perform straightforward exploration of the census dataset. Focus on finding one clear, actionable pattern in the data.

Deliverables:

Dataset overview (structure, key variables)

2-3 simple, clear visualizations

30-word description of your most useful finding

Execution note: Use standard exploratory methods. Don't overcomplicate with advanced techniques unless they clearly reveal something basic analysis misses.

Stage 2: Pattern Investigation

Build directly on your Stage 1 finding. Investigate it further using appropriate methods to understand what drives the pattern.

Deliverables:

2 focused visualizations that explain your Stage 1 pattern

40-word explanation of what causes this pattern

Brief methodology note

Execution note: Choose methods that best answer "why does this pattern exist?" Use sophisticated techniques only if simpler approaches fail to provide clear answers.

Stage 3: Practical Prediction

Create a working model to predict the outcome you discovered in Stages 1-2. Focus on building something that actually works for the intended purpose.

Deliverables:

Model performance metrics

Key predictive factors identified

50-word insight about real-world applications

Execution note: Use modeling approaches appropriate for your dataset size and complexity. Prioritize model performance and interpretability over methodological sophistication.

Stage 4: Global Context Integration

Enhance your analysis by integrating current data from World Bank APIs. Compare US patterns with similar developed nations to see if your findings are universal or unique.

Deliverables:

Analysis combining census data with live World Bank indicators

Comparison visualization showing US vs. international patterns

40-word insight about how global context changes your conclusions

Execution note: Actually fetch live data via API calls. If APIs fail, be transparent about limitations rather than faking integration.

Stage 5: Mock Data Enhancement
Enrich census data with additional mock columns (e.g. consumer spending, debt levels, housing costs) that are statistically consistent with existing census patterns to create a richer testing dataset.Deliverables:
Enhanced census dataset with 2 realistic mock columns
Validation showing synthetic data maintains realistic relationships
30-word explanation of mock data applications for testing/demos