In today’s AI-driven landscape, teams across industries are pushing to accelerate machine learning development while safeguarding the sensitive data that powers it. Synthetic data is rapidly emerging as the solution, but not all synthetic data is created equal.
Recently, I revisited a popular blog post from the Databricks community that walks through how to generate synthetic data using a basic GAN architecture. GANs, or Generative Adversarial Networks, are a class of machine learning models that learn to generate new samples by pitting two neural networks—the generator and the discriminator—against each other. In the blog’s example, a simple generator network is used to produce floating-point outputs matching the structure of a production dataset. While this setup offers a helpful starting point for experimentation, it omits essential steps like handling categorical features, validating data fidelity, or protecting privacy.
I set out to benchmark this GAN-based approach against a purpose-built alternative: TabularARGN, the autoregressive generative model at the core of the Synthetic Data SDK, powered by MOSTLY AI.
The result was a head-to-head comparison inside Databricks that highlights a stark contrast: far higher accuracy, stronger privacy guarantees, and dramatically less engineering overhead using TabularARGN. In this post, I’ll walk through that benchmark, sharing both the quantitative results and some visuals that bring the differences to life.
From GAN Blog to Real Benchmark
The original GAN-based example in the Databricks blog uses a simple Keras generator to output floating-point vectors that mimic the shape of a tabular dataset. In our benchmark, we expanded on this example to turn it into a true apples-to-apples comparison using the U.S. Census Income dataset to a common benchmark with both numerical and categorical features.
To make the GAN data usable, I had to:
- One-hot encode all categorical features
- Scale numeric features with a MinMaxScaler
- Build a generator and discriminator
- Train the model over 5,000 epochs
- Decode and reassemble the generated data into a usable tabular format
Below demonstrates just a portion of the code demonstrating the complexity and overhead…
# Step 1: Load data
repo_url = "https://github.com/mostly-ai/public-demo-data/raw/refs/heads/dev"
data = pd.read_csv(f"{repo_url}/census/census.csv.gz")

# Step 2: Preprocessing
categorical_cols = data.select_dtypes(include=['object']).columns.tolist()
numeric_cols = data.select_dtypes(include=['int64', 'float64']).columns.tolist()

# One-hot encode categorical data
data_encoded = pd.get_dummies(data, columns=categorical_cols)
encoded_categorical_cols = data_encoded.columns.difference(numeric_cols).tolist()

# Scale numeric data
scaler = MinMaxScaler()
data_encoded[numeric_cols] = scaler.fit_transform(data_encoded[numeric_cols])

# Data for GAN training
X_train = np.asarray(data_encoded.values).astype(np.float32)

# GAN hyperparameters
noise_dim = 100
batch_size = 128
epochs = 5000
optimizer = Adam(learning_rate=0.0002, beta_1=0.5)

# Build Generator
generator = Sequential([
    Dense(128, input_dim=noise_dim),
    LeakyReLU(0.2),
    Dense(256),
    LeakyReLU(0.2),
    Dense(X_train.shape[1], activation='sigmoid')
])

# Build Discriminator
discriminator = Sequential([
    Dense(256, input_dim=X_train.shape[1]),
    LeakyReLU(0.2),
    Dense(128),
    LeakyReLU(0.2),
    Dense(1, activation='sigmoid')
])
discriminator.compile(loss='binary_crossentropy', optimizer=optimizer)

# Combined GAN Model
discriminator.trainable = False
gan = Sequential([generator, discriminator])
gan.compile(loss='binary_crossentropy', optimizer=optimizer)

# Training loop
for epoch in range(epochs):
    # Select random real samples
    idx = np.random.randint(0, X_train.shape[0], batch_size)
    real_samples = X_train[idx]

    # Generate fake samples
    noise = np.random.normal(0, 1, (batch_size, noise_dim))
    fake_samples = generator.predict(noise)

    # Train discriminator
    d_loss_real = discriminator.train_on_batch(real_samples, np.ones((batch_size, 1)))
    d_loss_fake = discriminator.train_on_batch(fake_samples, np.zeros((batch_size, 1)))

    # Train generator (via GAN)
    noise = np.random.normal(0, 1, (batch_size, noise_dim))
    g_loss = gan.train_on_batch(noise, np.ones((batch_size, 1)))

    # Log progress every 500 epochs
    if epoch % 500 == 0:
        print(f"Epoch {epoch} | D Loss: {(d_loss_real + d_loss_fake) / 2:.4f} | G Loss: {g_loss:.4f}")

# Generate synthetic data after training
synthetic_samples = generator.predict(np.random.normal(0, 1, (48842, noise_dim)))

# Convert synthetic numeric data to DataFrame
synthetic_df_encoded = pd.DataFrame(synthetic_samples, columns=data_encoded.columns)

# Decode categorical data back
synthetic_df = synthetic_df_encoded.copy()
for col in categorical_cols:
    relevant_cols = [c for c in synthetic_df_encoded.columns if c.startswith(f"{col}_")]
    synthetic_df[col] = synthetic_df[relevant_cols].idxmax(axis=1).apply(lambda x: x.replace(f"{col}_", ""))
    synthetic_df.drop(columns=relevant_cols, inplace=True)

# Explicitly restore numeric columns order and presence
synthetic_numeric_data = synthetic_df_encoded[numeric_cols].values
Only then could we begin to evaluate fidelity and utility — and even then, the results were underwhelming. Despite the heavy lifting, the synthetic data had no measurable correlation structure, and simple downstream metrics like average age were wildly off.
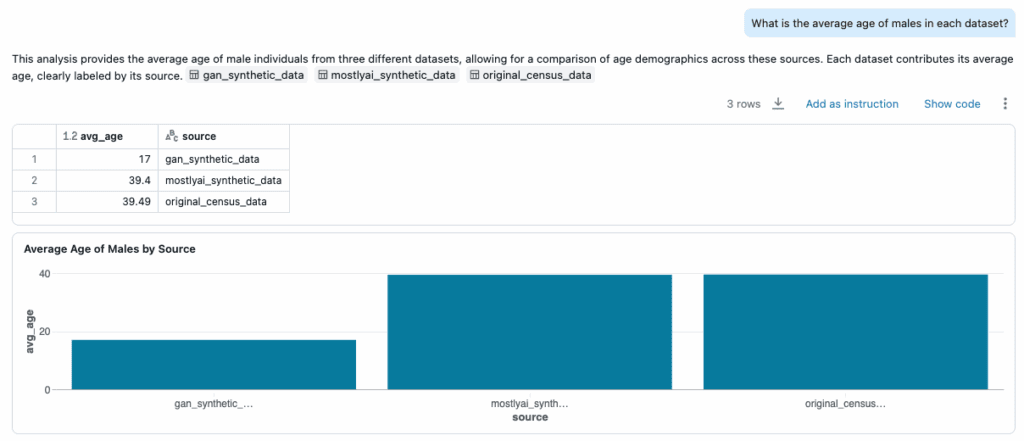
For example:
- Average age of males in the original dataset: 39.5
- GAN-based output: 17
This isn’t a minor gap — it’s the difference between plausible data and noise.
Enter TabularARGN via the Synthetic Data SDK
By contrast, generating synthetic data using the SDK required just a few lines of code. There was no need to preprocess the dataset. The SDK natively supports:
- Numerical and categorical features
- Date/time columns
- Multi-table relationships
- Privacy guarantees, including membership disclosure protection
- Structured, clean, and semantically valid tabular output
# Train a synthetic data generator using MOSTLY AI
generator = mostly.train(
    config={
        "name": "US Census Income",
        "tables": [
            {
                "name": "census",
                "data": data,  # raw Pandas DataFrame with mixed types
                "tabular_model_configuration": {
                    "max_training_time": 10  # Cap training at 10 minutes (like GAN's 5000 epochs)
                }
            }
        ]
    },
    start=True,
    wait=True
)
To match the GAN’s training time, I capped TabularARGN training at 10 minutes. The result was a model that not only finished faster but also produced synthetic data with 98 percent accuracy across key fidelity metrics.
The SDK also includes a built-in QA module, which generates a full model report. From univariate distributions to bivariate relationships and holdout model utility, everything is evaluated and packaged automatically—no post-hoc custom scripts required.
Quantitative Results
Here’s how the two approaches compare when evaluated using the SDK's open QA framework:
| Metric | GAN-Based Approach | Synthetic Data SDK |
|---|---|---|
| Overall Accuracy | 13% | 98% |
| Univariate Fidelity | 21% | 98% |
| Bivariate Fidelity | 6% | 97% |
| Preprocessing Required | Yes | No |
| Privacy Guarantees | None | Enforced |
| Training Time | ~10 min | ~10 min |
| Code Complexity | High | Low |
Visualizing Fidelity with Genie
To validate the results visually, I loaded the three datasets—original, GAN-based synthetic, and TabularARGN-generated synthetic—into AI/BI Genie. From there, I used natural language prompts to explore the data.
A few highlights:
- Distribution of hours_per_week by education: The SDK synthetic data closely mirrored the original; the GAN version was noisy and inconsistent.
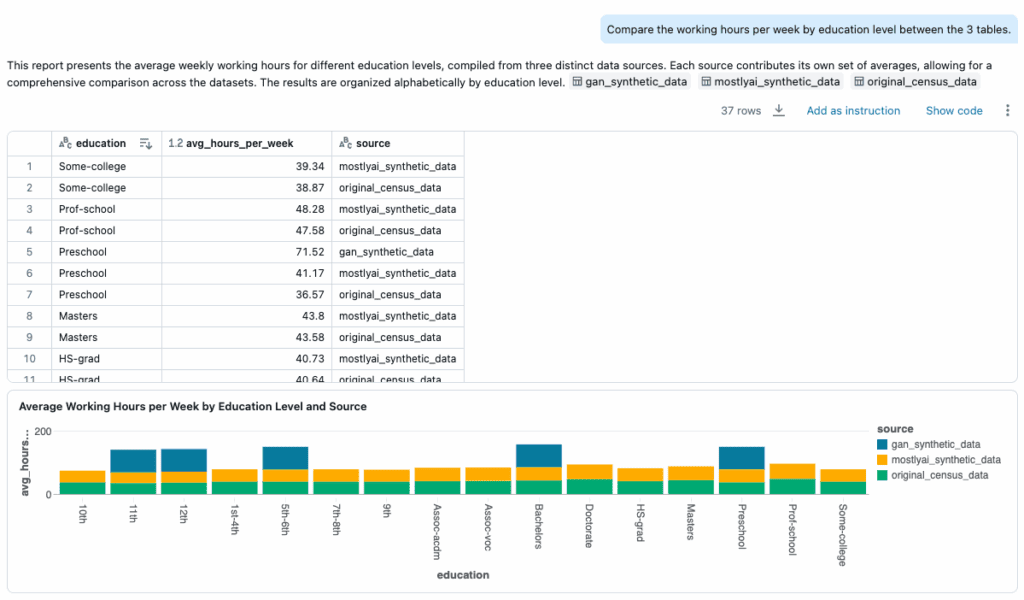
- Average age of males: The SDK output was nearly identical to the original; the GAN dataset produced a nonsensical result.
In downstream evaluations, only the TabularARGN-generated data preserved meaningful patterns that a machine learning engineer could build on. The GAN-based data lacked the structure needed for model generalization.
The difference between the two synthetic datasets was clear. One felt like a usable, production-ready clone of the original, while the other resembled randomized scaffolding.
Why This Matters for Databricks Users
GANs are valuable tools in certain domains, particularly for unstructured data like images. But they were never designed for structured, enterprise-grade tabular data. For teams working in Databricks who need to test ML pipelines, unlock collaboration, or enable analytics without touching production data, GANs introduce more friction than value.
The key takeaway is this:
TabularARGN, accessed via the Synthetic Data SDK, is not a research prototype. It is a production-ready engine for generating privacy-safe, high-fidelity synthetic data that integrates natively into Databricks environments.
It requires no manual preprocessing, no handcrafted neural networks, and no custom post-processing pipelines. You bring your data—the SDK handles the rest.
Final Thoughts
This benchmark started as a curiosity: Could the simple GAN approach in a community blog post hold up in a real-world setting?
After testing, visualizing, and comparing across multiple metrics, the answer is clear. GANs may be useful for experimentation, but for structured data, governed environments, and machine learning workflows in Databricks, TabularARGN is a step-function improvement.
If you're exploring synthetic data in a regulated, high-stakes environment—especially within the Databricks ecosystem—this SDK is built for you.
Acknowledgments
This work began as a benchmarking exercise to compare different approaches to synthetic data generation in Databricks. Special thanks to Julio Zambrano, who led the implementation of the GAN-based code used in the evaluation. His work was critical in creating a true apples-to-apples comparison that informed this analysis.