Smart data imputation with AI-generated synthetic data is superior to all other methods out there. Synthetic data generated with MOSTLY AI is highly representative, highly realistic, granular-level data that can be considered ‘as good as real’. While maintaining complete protection of each data subject's privacy, it can be openly processed, used, and shared among your peers. MOSTLY AI’s synthetic data serves various use cases and the initiatives that our customers have so far achieved, prove and demonstrate the value that our synthetic data platform has to offer.
To date, most of our customers' use cases centered around generating synthetic data for data sharing while maintaining privacy standards. However, we believe that there is more on offer for data consumers around the world. Poor-quality data is a problem for data scientists across all industries.
Real-world datasets have missing information for various reasons. This is one of the most common issues data professionals have to deal with. The latest version of MOSTLY AI's synthetic data generator introduces features that can be utilized by users to interact with their original dataset - the so-called 'data augmentation' features. Among those is our ‘Smart Imputation’ technique which can accurately recreate the original distribution while filling the gaps for the missing values. This is gold for analytical purposes and data exploration!
What is smart data imputation?
Data imputation is the process of replacing missing values in a dataset with non-missing values. This is of particular interest, if the analysis or the machine learning algorithm cannot handle missing values on its own, and would otherwise need to discard partially incomplete records.
Many real-world datasets have missing values. On the one hand, some of the missing values may exist as they may hold important information depending on the business. For instance, a missing value in the ‘Death Date’ column means that the customer is still alive or a missing value in the ‘Income’ column means that the customer is unemployed or under-aged. On the other hand, oftentimes the missing values are caused by an organization's inability to capture this information.
Thus, organizations look for methods to impute missing values for the latter case because these gaps in the data can result in several problems:
- Missing data occasionally causes results to be biased. This means that because your data came from a non-representative sample, your findings could not be directly applicable to situations outside of your study.
- Dataset distortion occurs when there is a great deal of missing data, which can change the distributions that people could see in real-world situations. Consequently, the numbers do not accurately reflect reality.
As a result, data scientists may employ rather simplistic methods to impute missing values which are likely to distort the overall value distribution of their dataset. These strategies include frequent category imputation, mean/median imputation, and arbitrary value imputation. Thoughtful consideration should be given to the fact that well-known machine learning libraries like scikit-learn have introduced data scientists to several univariate and multivariate imputation algorithms, including, respectively, "SimpleImputer" and "IterativeImputer."
Finally, the scikit-learn 'KNNImputer' class, which offers imputation for filling in missing data using the k-Nearest Neighbors approach, is a popular technique that has gained considerable attention recently.
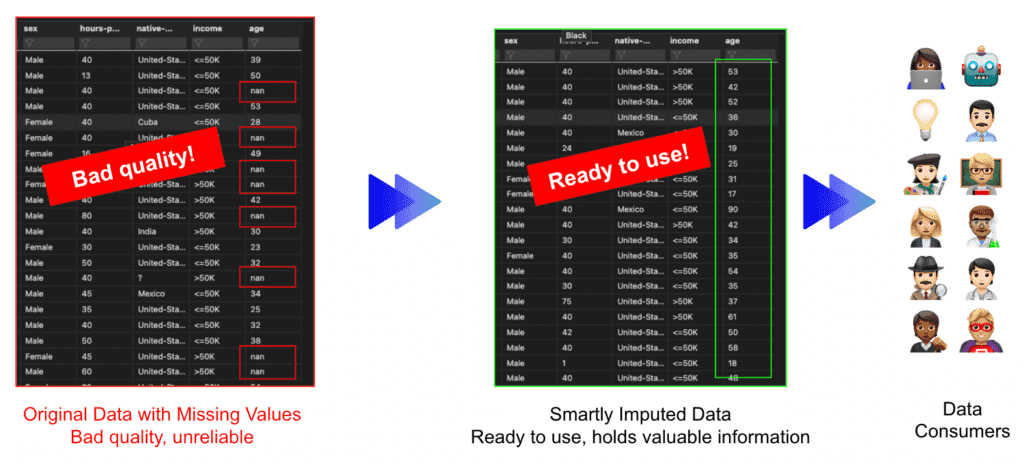
MOSTLY AI’s smart imputation technique seeks to produce precise and accurate synthetic data so that it is obvious right away that the final product is of "better" quality than the original dataset. At this point, it is important to note that MOSTLY AI is not yet another tool that merely replaces a dataset's missing values. Instead, we give our customers the ability to create entirely new datasets free of any missing values. Go ahead and continue reading if this piques your curiosity so you may verify the findings for yourself.
Evaluating smart imputation
We devise the below technique to compare the originally targeted distribution with the synthetic one to evaluate MOSTLY AI's smart imputation feature.
Starting with the well-known US-Census dataset, we use column ‘age’ as our targeted column. The dataset has approximately 50k records and includes 2 numerical variables and 9 categorical variables. The average age of the targeted column is 38.6 years, with a range of 17 to 90 years and a standard deviation of 13.7 years.
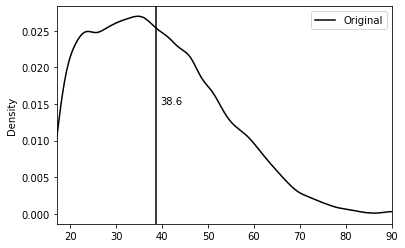
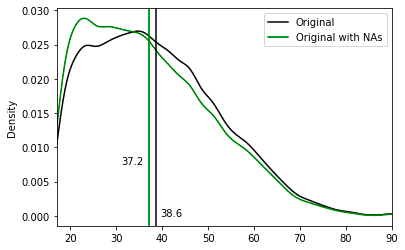
Our research begins by introducing semi-randomly some missing values into the US-Census dataset's "age" column. The goal is to compare the original distribution with the smartly imputed distribution and see whether we can correctly recover the original one.
We applied the following logic to introduce missing values in the original dataset, to artificially bias the non-missing values towards younger age segments. The age attribute was randomly set to missing for:
- 10% of all records
- 60% of records, whose education level was either ‘Doctorate', 'Prof-school' or ‘Masters’
- 60% of records, whose marital status was either ‘Widowed’ or 'Divorced'
- 60% of records, whose occupation level was set to ‘Exec-managerial’
It's important to note that by doing this, the algorithm won't be able to find any patterns or rules on where the missing values are located.
As a result, the 'age' column now has missing numbers that appear to be missing semi-randomly. The column's remaining non-missing values are therefore skewed in favor of younger people:
- Original age mean: 38.6
- Original age mean with missing values: 37.2
As a next step, we synthesized and smartly imputed the US-Census dataset with the semi-random missing values on the "age" column using the MOSTLY AI synthetic data platform.
We carried out two generations of synthetic data. The first one is for generating synthetic data without enabling imputation and as expected the synthetic dataset matches the distribution of the data used to train the model (Synthetic with NAs - light green). The second one is for generating synthetic data enabling MOSTLY AI’s Smart imputation feature for the ‘age’ column. As we can see, the smartly imputed synthetic data perfectly recovers the original distribution!
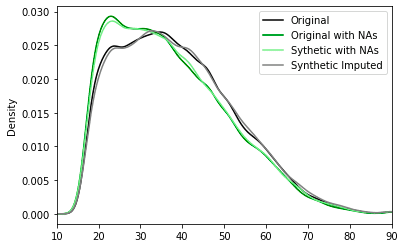
After adding the missing values to the original dataset, we started with an average age of 37.2 and used the "Smart imputation" technique to reconstruct the "age" column. The initial distribution of the US-Census data, which had an average age of 38.6, is accurately recovered in the reconstructed column, which now has an average age of 39.
These results are great for analytical purposes. Data scientists now have access to a dataset that allows them to operate without being hindered by missing values. Now let's see how the synthetic data generation method compares to other data imputation methods.
Data imputation methods: a comparison
Below we are describing 6 of the main imputation techniques for numerical variables and we are going to compare the results with our Smart Imputation algorithm. For each technique below we are presenting a general summary statistics of the ‘age’ distribution as well as a visual representation of the results against MOSTLY AI’s results.
Arbitrary value data imputation
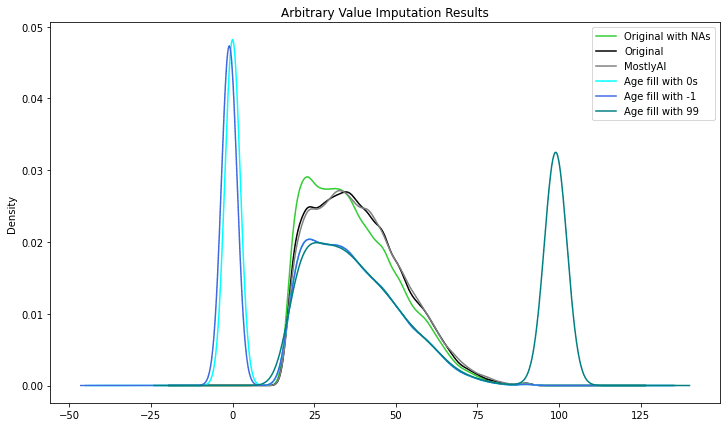
Arbitrary value imputation is a type of data imputation technique used in machine learning to fill in missing values in datasets. It involves replacing missing values with a specified arbitrary value, such as 0, 99, 999, or negative values. Instead of imputing the numbers using statistical averages or other methods, the goal is to flag the values.
This strategy is quite simple to execute, but it has a number of disadvantages. For starters, if the arbitrary number utilized is not indicative of the underlying data, it can inject bias into the dataset. For example, if the mean is used to fill in missing values in a dataset with outliers or extreme values, the imputed values may not accurately reflect the underlying distribution of the data.
Using an arbitrary value can limit dataset variability, making it more difficult for machine learning algorithms to find meaningful patterns in the data. As a result, forecast accuracy and model performance may suffer.
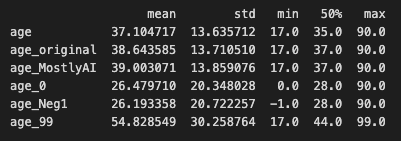
As you can see, the variable was given new peaks, drastically altering the initial distribution.
Start/End of Distribution data imputation
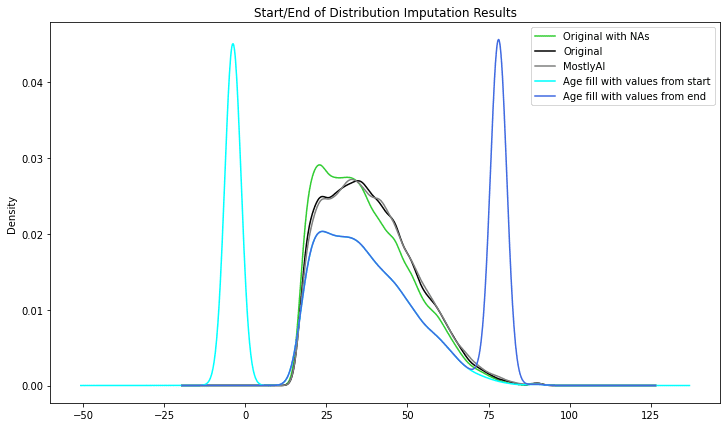
Start/End of Distribution data imputation is a form of data imputation technique used to fill in missing values in datasets. It involves replacing missing values with values at the beginning or end of the distribution of non-missing values in the dataset.
If the missing values are numeric, for example, the procedure involves replacing the missing values with the lowest or maximum value of the dataset's non-missing values. If the missing values are categorical, the procedure involves filling in the gaps with the most often occurring category (i.e., the mode).
Similar to the previous technique, as an advantage, is a simple technique to implement and our ML models could capture the significance of any missing values. The main drawback is that we might end up with a distorted dataset as the mean and variance of distribution might change significantly.
Similar to the previous technique, the variable was given new peaks, drastically altering the initial distribution.

Mean/Median/Mode Imputation
Mean/Median/Mode imputation is probably the most popular data imputation method, at least among beginners. The Mean/Median/Mode data imputation method tries to impute missing numbers using statistical averages.
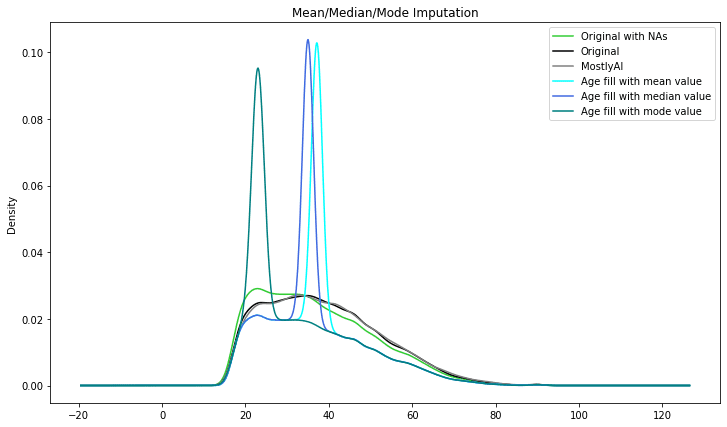
Mean data imputation involves filling the missing values with the mean of the non-missing values in the dataset. Median imputation involves filling the missing values with the median of the non-missing values in the dataset. Mode imputation involves filling the missing values with the mode (i.e., the most frequently occurring value) of the non-missing values in the dataset.
These techniques are straightforward to implement and beneficial when dealing with missing values in small datasets or datasets with a simple structure. However, if the mean, median, or mode is not indicative of the underlying data, they can add bias into the dataset.
The results start looking better than the previous techniques, however as can be seen the imputed distributions are still distorted.

Scikitlearn - SimpleImputer data imputation
Scikit-learn is a well-known Python machine learning library. The SimpleImputer class in one of its modules, sklearn.impute, provides a simple and efficient technique to impute missing values in datasets.
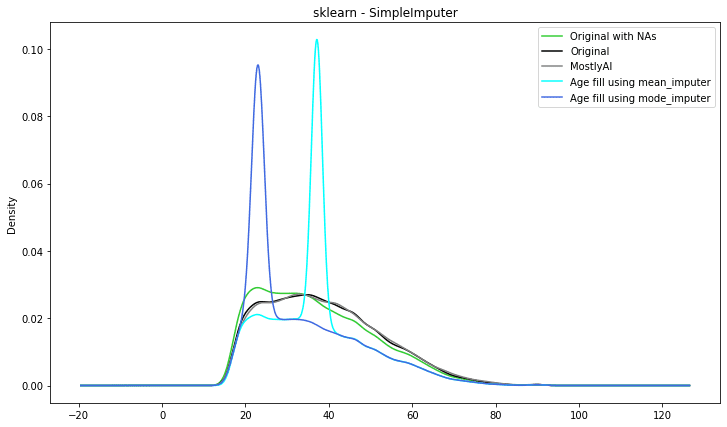
The SimpleImputer class can be used to fill in missing data using several methodologies such as mean, median, mode, or a constant value. It can also be used to fill in missing values by selecting the most common value along each column or row, depending on the axis. SimpleImputer is a univariate imputation algorithm that comes out of the box with the sci-kit learn library.
The results below are similar to the results of the previous technique:

Scikitlearn - IterativeImputer data imputation
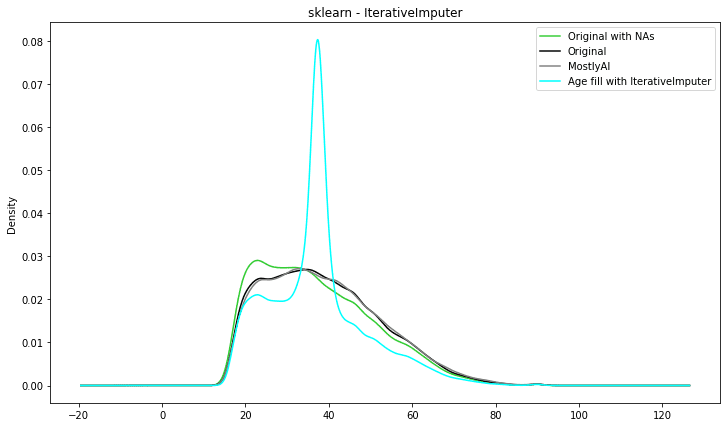
Another class in the Scikit-learn's sklearn.impute module that may be used to impute missing values in datasets is IterativeImputer. IterativeImputer, as opposed to SimpleImputer, uses a model-based imputation strategy to impute missing values by modelling the link between variables.
IterativeImputer estimates missing values using a machine learning model. A variety of models are supported by the class, including linear regression, Bayesian Ridge regression, k-nearest neighbours regression, decision trees, and random forests.
Entering the more sophisticated techniques you can see that the imputed distribution is getting closer to the original ‘age’ distribution.

Scikitlearn - KNNImputer data imputation
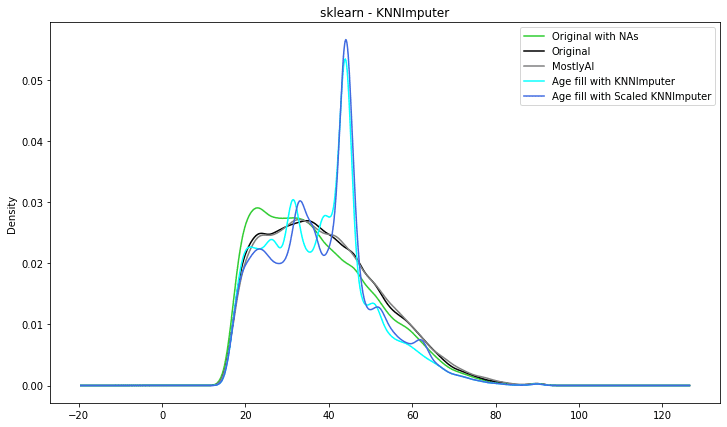
Let’s look at something a little more complex. K-Nearest Neighbors, or KNN, is a straightforward method that bases predictions on a specified number of nearest neighbours. It determines the separations between each instance in the dataset and the instance you want to classify. Here, classification refers to imputation.
It is simple to implement and optimize. In comparison to the other methods employed so far, it is also a little bit ‘smarter’. Unfortunately, it is prone to outliers. It can be used only on numerical variables hence only those used from the US-census dataset to produce the results below.
The summary statistics look very close to the original distribution. However, the visual representation is not that good. The imputed distribution is getting closer to the original one and visually it seems that KNNImputer produces the best results so far.

Comparison of data imputation methods: conclusion
Six different techniques were used to impute the US-census ‘age’ column. Starting with the simplest ones we have seen that the distributions are distorted and the utility of the new dataset drops significantly. Moving to the more advanced methodologies, the imputed distributions are starting to look like the original ones but are still not perfect.
We have plotted all the imputed distributions against the original as well as the distribution generated by MOSTLY AI’s Smart Imputation feature. We can clearly conclude that AI-powered synthetic data imputation captures the original distribution better.
We at MOSTLY AI are excited about the potential that ‘Smart Imputation’ and the rest of our 'Data Augmentation' and 'Data Diversity' features have to offer to our customers. More specifically, we would like to see more organizations using synthetic data across industries and to reduce the time-consuming task of dealing with missing data - time that data professionals can use to produce valuable insights for their organizations.
We are eager to explore these paths further with our customers to assist their ML/AI endeavours, at a fraction of the time and expense, since the explorations in this blog post have shown the potential to support such a scenario. If you are currently facing the same struggle of dealing with missing values in your data, check out MOSTLY AI's synthetic data generator to try Smart imputation on your own.

