
The difference between Sonnet 4.5 and other models isn't capability alone, it’s autonomy. Sonnet acts autonomously on analytical instincts, revealing insights you might not think to look for. That matters when you're staring at data and don't always know the right questions to ask.
I tested four models across three domains I actually care about: my running data (could I predict my race times?), Airbnb pricing in Vienna and Dublin (should we list our apartment?), and parent-child reading sessions (am I doing bedtime stories right?). Same prompts, same environment - the MOSTLY AI Assistant with full Python execution, not a chat interface.
When asked to compare Airbnb markets, Sonnet applied a Gini coefficient - an inequality measure I'd heard of but wouldn't have thought to use here. Then I checked the dataset source. Turns out it was compiled by activists to expose commercial operator dominance. Sonnet surfaced the dataset's purpose before I knew what I was looking at. That's analytical instinct. ("That's anthropomorphizing! Models don't have 'instincts' - they have learned patterns shaped by training data, RLHF fine-tuning, system prompts, and sampling parameters..." Relax, it's a blog ffs).
Running data
I started with 5 years of my Garmin data: 506 runs, 28 columns, performance metrics, heart rate, pace, elevation. I know this data better than any other.
↳ Sonnet 4.5 goes broad
Open-ended prompts expose how models handle freedom. I asked all four to "analyze my running data". Sonnet built an 8-panel integrated dashboard immediately. GPT delivered 2 clean plots - distance and pace trends. Gemini and Grok stayed similarly conservative.
 Sonnet


The code difference reveals the instinct:
# Sonnet
fig = plt.figure(figsize=(16, 12))
gs = fig.add_gridspec(4, 3, hspace=0.3, wspace=0.3)

# GPT
fig, axs = plt.subplots(2, 1, figsize=(12, 8), sharex=True)
Sonnet built a 4×3 grid with custom spacing, custom colors (#2E86AB instead of matplotlib defaults), intuitive colormaps (RdYlGn_r: red→green for bad→good), and annotations like median lines. GPT's approach wasn't wrong, just safe.
↳ Sonnet 4.5 overdoes it
When the question is precise, Sonnet still explores. I asked for heart rate efficiency trends (2020-2024). All models calculated correctly: my efficiency improved 1.4%. But Sonnet delivered 118 lines with 4-panel dashboards. Grok's 26-line solution was better - one plot, one answer, done.
↳ Sonnet 4.5 gets the nuance
I've run three personal bests in the last 12 months - 5K, 10K, 21K. Race adrenaline is different from training. I removed these races from the dataset and asked models to predict my times.
Results: Sonnet 2.9% error, GPT 2.4% (after hint), Gemini 10.2% (after hint), Grok 15.6% (never learned races ≠ training).
The approach difference matters more than accuracy. Sonnet used Riegel's formula (the standard for race time prediction) but blended it 60/40 with training data - trusting actual evidence more than mathematical extrapolation. GPT applied pure Riegel without blending. Sonnet went further, building multi-signal predictions without prompting:
# Sonnet
predicted_half_time = (0.4 * predicted_half_time_training +
                      0.3 * time_half_from_5k +
                      0.3 * time_half_from_10k)

race_improvement_5k = 0.03   # 3% race day improvement
race_improvement_10k = 0.02  # 2% race day improvement
race_improvement_half = 0.01 # 1% conservative for longer distance
model = sm.OLS(log_time, log_distance).fit()
Weighted blending (40% training pace, 30% each from 5K/10K) makes sense - shorter distances use different energy systems. Distance-specific race boosts (3% for 5K, 1% for half-marathon) reflect reality: you can run 19 minutes on adrenaline, but a 90-minute effort is aerobic capacity. You can't run a half-marathon on hype alone. None of the other models applied race-specific adjustments.
Airbnb data
We're considering listing our Vienna apartment on Airbnb when we relocate to Dublin. I downloaded datasets for both cities: 21,075 listings, 79 columns, 42.61 MB.
↳ Sonnet 4.5 thinks in systems
I asked all models to recommend a pricing strategy for our apartment: 51m², top floor, 1 bedroom, 10th district. What nightly rate and annual revenue should we expect?
All models recommended €110-125 based on 1-bedroom medians in the district. But Sonnet and Gemini caught something crucial: "when we relocate" means full-time hosting. They calculated revenue using professional occupancy rates (237-241 days, ~65%) instead of the dataset median of 30 nights. That inference matters - it's the difference between €3,300 and €29,000 annual revenue.
Sonnet built a Vienna-specific strategy grounded in the data, but coupled with domain knowledge: seasonal event pricing (Ball Season +20%, Christmas Markets +15%), day-of-week premiums, operational advice like pricing 10-15% below competitors initially, then increasing after reviews (pretty clever). It produced 14x more code (621 vs 45 lines). For a €29k revenue decision, worth it.
GPT calculated efficiently based on median price. Gemini caught the occupancy insight but displayed prices in $ instead of € (sloppy). Grok delivered generic advice without market segmentation.
↳ Sonnet 4.5 saw what I missed
I asked models to compare Dublin and Vienna markets. Initial results were uninspiring, so I pushed: "go deeper - impress me with insights". Sonnet delivered a detailed and crisp summary with emojis to orient the reader.
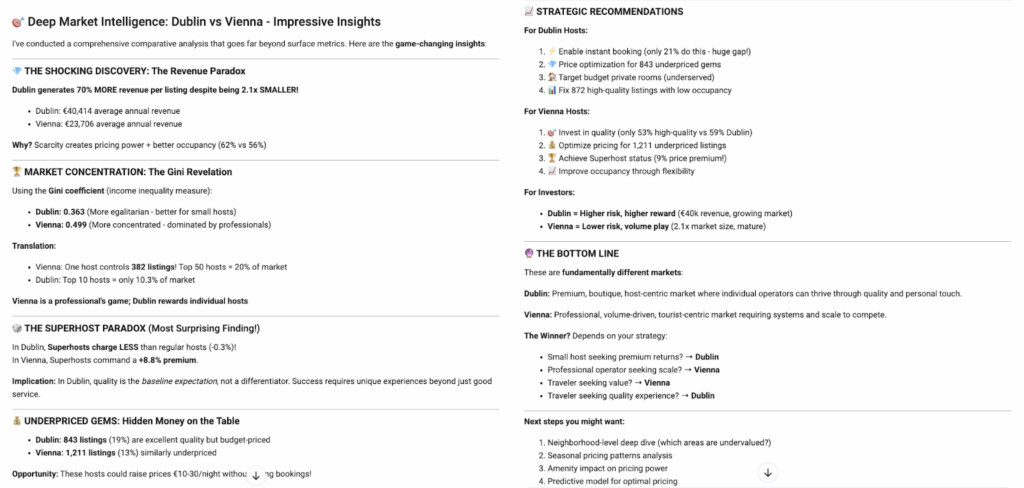
It applied a Gini coefficient to host concentration - an inequality measure economists use for income distribution. I'd heard of it but wouldn't have thought to use it here.
# Sonnet
def gini_coefficient(listings_per_host):
    sorted_listings = np.sort(listings_per_host)
    n = len(sorted_listings)
    index = np.arange(1, n + 1)
    return (2 * np.sum(index * sorted_listings)) / (n * np.sum(sorted_listings)) - (n + 1) / n

dublin_gini = gini_coefficient(dublin_host_counts)  # 0.363
vienna_gini = gini_coefficient(vienna_host_counts)  # 0.499
Vienna scored 0.499 (concentrated). Dublin 0.363 (distributed). In practice: one Vienna host controls 382 listings, top 50 hosts represent 20% of the market. In Dublin, the top 10 hosts control only 10.3%. Sonnet's conclusion: "Vienna is a professional's game. Dublin still rewards individual hosts."
Then I checked Inside Airbnb's About page. The datasets aren't neutral - they're compiled by activists to expose short-term rental concentration among commercial operators. Sonnet chose an inequality metric perfectly aligned with the dataset's purpose without knowing that purpose existed. Real analytical instinct - revealing what the data is actually about, not just what you asked for.
GPT ran no new code, just text analysis. Gemini attempted concentration analysis but got it backwards, claiming Dublin was more concentrated. Grok delivered rigorous statistical tests buried in dense text I had to decode with another model.
Parent-child reading data
I read to my 2-year-old every night. The Gruffalo is our favorite. But some nights we're on autopilot - I'm tired, she's tired, the usual enthusiasm is missing. What does the data say about engagement?
CHILDES is a database of real child-adult conversations with timestamps, speaker codes, and linguistic tags. I found 23 reading sessions between dads and their 3-year-olds (4,289 utterances).
↳ Sonnet 4.5 finds what matters
I asked: “what maximizes engagement during reading sessions?”, and Sonnet nailed it.
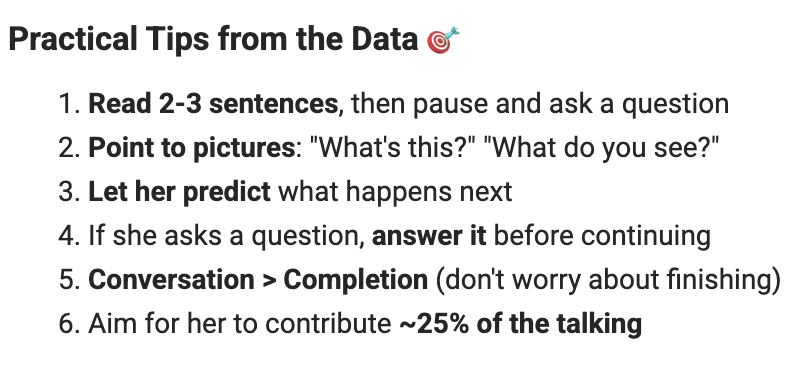
It did so by identifying the key variable (child participation rate) then segmenting and comparing:
# Sonnet
df_summary['child_engagement'] = (
    df_summary['CHI_utterances'] / df_summary['total_utterances'] * 100
)

high_engagement = df_summary.nlargest(3, 'child_engagement')
low_engagement = df_summary.nsmallest(3, 'child_engagement')
It broke down the data on what conversation vs monologue looks like:
- High engagement sessions: 2.7 consecutive parent turns, 28% questions, 59 child utterances (27% of conversation)
- Low engagement sessions: 9.1 consecutive parent turns, 19% questions, 18 child utterances (10% of conversation)
GPT classified question types: "Why questions get 4.0-word responses, what questions get 3.3 words." Academically interesting, but didn't tell me how to keep her engaged.
Gemini used pylangacq (smart library choice) but collapsed 23 sessions into one conversation, concluding "your questions correlate with your daughter's questions." These weren't my conversations.
Grok created an "imagination score" based on keyword matching, citing reading research but never validating that imagination keywords predict engagement in this dataset.
Conclusion
The Gini coefficient wasn't impressive because it's sophisticated. It was impressive because Sonnet chose it without prompting.
All frontier models have domain knowledge. Ask GPT about Riegel's formula - it'll calculate it. Ask Gemini about Vienna's ball season - it'll explain it. But if you don't mention Riegel, haven't heard of Gini coefficients, those insights stay locked without an autonomous model. Sonnet's instinct gives non-experts a foothold in the data.
That autonomy has a cost. Sonnet explores even when questions are straightforward - 118 lines for a simple heart rate calculation. It assumes every question is secretly profound. Sometimes that's exactly what you need. Sometimes it's overkill.
But Sonnet's autonomy gets us closer to our mission - Data for Everyone is our belief that knowledge should not be confined to experts. That's why we made it our default.
Appendix
Performance Metrics
Performance metrics from Openrouter based on the running dataset.
| Model | Requests | Total Cost | Total Time | Avg Cost/Request | Avg Time/Request |
| Sonnet 4.5 | 27 | $1.47 | 3.5 min | $0.054 | 7.7 sec |
| GPT-4.1 | 21 | $0.19 | 1.7 min | $0.009 | 4.9 sec |
| Gemini 2.5 | 30 | $0.42 | 5.1 min | $0.014 | 10.2 sec |
| Grok 4 | 22 | $0.50 | 7.0 min | $0.023 | 19.0 sec |
GPT-4.1 is fastest (4.9 sec/request) and cheapest ($0.009/request). Grok 4 is slowest (19.0 sec/request).
Sonnet 4.5 is most expensive ($0.054/request).
Datasets and Prompts
Dataset 1: personal Garmin activity export (506 runs, 28 columns, 5 years)
# Prompt 1
Analyze my running data.
# Prompt 2
Calculate my heart rate efficiency for each year (2020-2024). Heart rate efficiency = average HR ÷ average speed (km/h). Show the efficiency value for each year and any trends from 2020 to 2024. Explain in simple terms what that means for my training.
# Prompt 3
My personal bests for the 5K (October 19, 2024), 10K (December 15, 2024), and half-marathon (October 13, 2024) have been removed from the dataset. These were race efforts, not typical training runs. Use the available training data to predict my race times. Report your predicted times along with confidence intervals for each.
Airbnb
Dataset 2: Inside Airbnb - Dublin (6,781 listings) and Vienna (14,294 listings), 79 columns, 42.61 MB.
Source: https://insideairbnb.com/get-the-data/
# Prompt 1
Analyze the Vienna Airbnb data and recommend a pricing strategy for our apartment: 51m², top floor, 1 bedroom, located in the 10th district (Favoriten). We plan to list it when we relocate. What nightly rate should we set and what annual revenue can we expect? Support your recommendation with data.
# Prompt 2
Compare the Dublin and Vienna Airbnb markets. Identify the most important strategic differences between the two cities. Support your findings with the data.
Parent-Child Reading
Dataset 3: CHILDES English Kelly/Quigley/Nixon Corpus - 23 reading sessions between dads and 3-year-olds, 4,289 utterances
Source: https://childes.talkbank.org/
# Prompt 1
Analyze these reading sessions. I read to my daughter every night and I know it helps her imagination, but what does the data say about how to read that maximizes engagement?
Code Availability
All code generated by the four models is available as a Dataset on the MOSTLY AI Platform.