
In this tutorial, you will learn how to perform conditional data generation. As the name suggests, this method of synthetic data generation is useful when you want to have more fine-grained control over the statistical distributions of your synthetic data by setting certain conditions in advance. This can be useful across a range of use cases, such as performing data simulation, tackling data drift, or when you want to retain certain columns as they are during synthesization.
You will work through two use cases in this tutorial. In the first use case, you will be working with the UCI Adult Income dataset in order to simulate what this dataset would look like if there was no gender income gap. In the second use case, you will be working with Airbnb accommodation data for Manhattan, which contains geolocation coordinates for each accommodation.
To gain useful insights from this dataset, this geolocation data will need to remain exactly as it is in the original dataset during synthesization. In both cases, you will end up with data that is partially pre-determined by the user (to either remain in its original form or follow a specific distribution) and partially synthesized.
It’s important to note that the synthetic data you generate using conditional data generation is still statistically representative within the conditional context that you’ve created. The degree of privacy preservation of the resulting synthetic dataset is largely dependent on the privacy of the provided fixed attributes.
The Python code for this tutorial is publicly available and runnable in this Google Colab notebook.
How does conditional data generation work?
We’ve broken down the process of conditional data generation with MOSTLY AI into 5 steps below. We’ll describe the steps here first, and in the following sections, you will get a chance to implement them yourself.
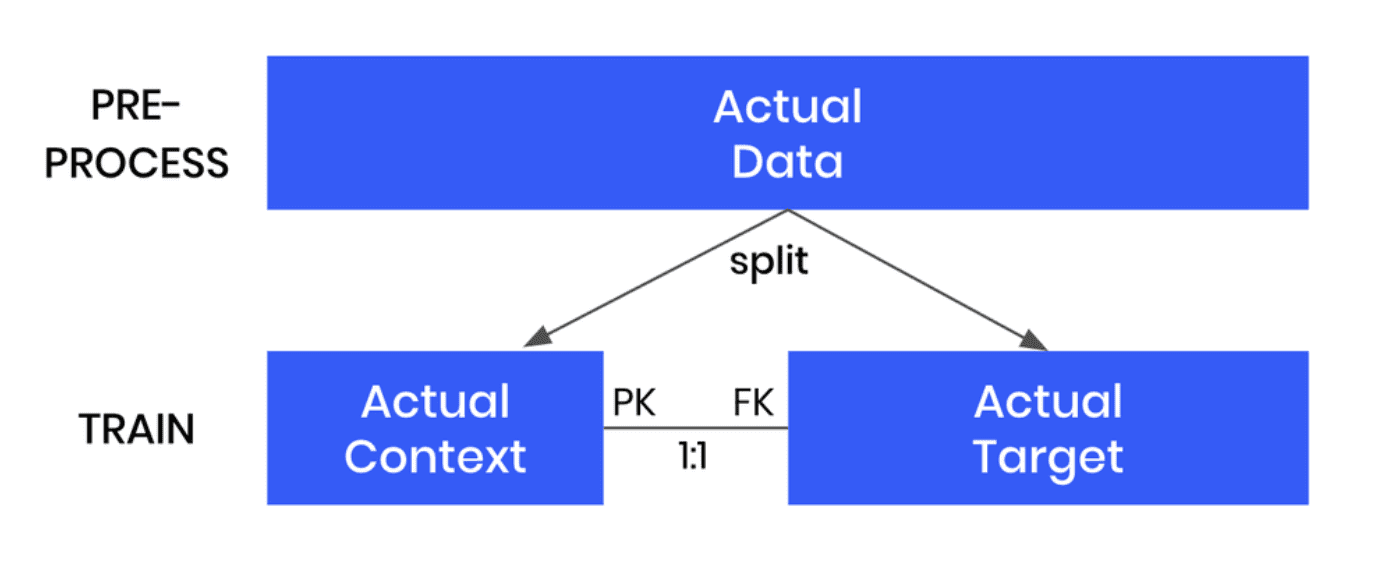
- We’ll start by splitting the original data table into two tables. The first table should contain all the columns that you want to hold fixed, the conditions based on which you want to generate your partially synthetic data. The second table will contain all the other columns, which will be synthesized within the context of the first table.
- We’ll then define the relationship between these two tables. The first table (containing the context data) should be set as a subject table, and the second table (containing the target data to be synthesized) as a linked table.
- Next, we will train a MOSTLY AI synthetic data generation model using this two-table setup. Note that this is just an intermediate step that will, in fact, create fully synthetic data since we are using the full original dataset (just split into two) and have not set any specific conditions yet.
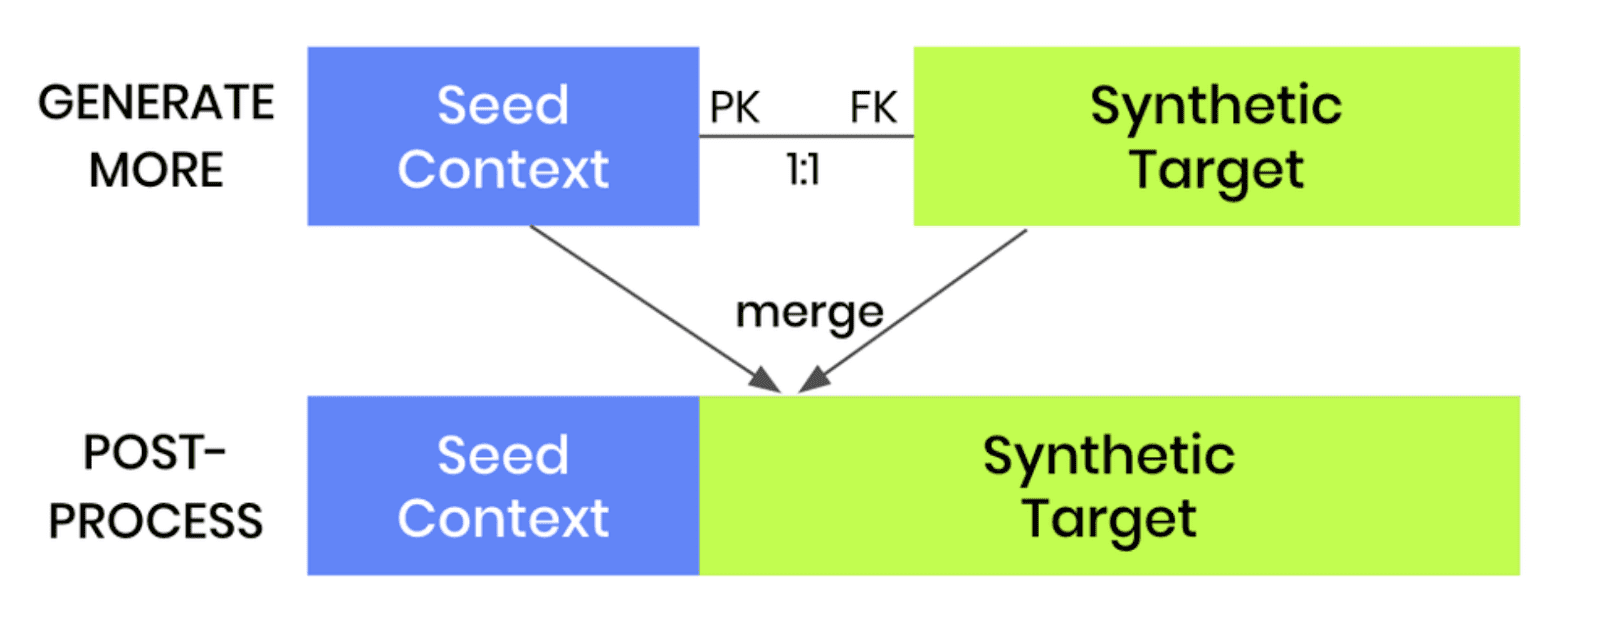
- Once the model is trained, we can then use it to generate more data by selecting the “Generate with seed” option. This option allows you to set conditions within which to create partially synthetic data. Any data you upload as the seed context will be used as fixed attributes that will appear as they are in the resulting synthetic dataset. Note that your seed context dataset must contain a matching ID column. The output of this step will be your synthetic target data.
- As a final post-processing step, we’ll merge the seed context with fixed attribute columns to your synthetic target data to get the complete, partially synthetic dataset created using conditional data generation.
Note that this same kind of conditional data generation can also be performed for two-table setups. The process is even easier in that case, as the pre-and post-processing steps are not required. Once a two-table model is trained, one can simply generate more data and provide a new subject table as the seed for the linked table.
Let’s see it in practice for our first use case: performing data simulation on the UCI Adult Income dataset to see what the data would look like if there was no gender income gap.
Conditional data generation for data simulation
For this use case, we will be using a subset of the UCI Adult Income dataset, consisting of 10k records and 10 attributes. Our aim here is to provide a specific distribution for the sex and income columns and see how the other columns will change based on these predetermined conditions.
Preprocess your data
As described in the steps above, your first task will be to enrich the dataset with a unique ID column and then split the data into two tables, i.e. two CSV files. The first table should contain the columns you want to control, in this case, the sex and income columns. The second table should contain the columns you want to synthesize, in this case, all the other columns.
df = pd.read_csv(f'{repo}/census.csv')
# define list of columns, on which we want to condition on
ctx_cols = ['sex', 'income']
tgt_cols = [c for c in df.columns if c not in ctx_cols]
# insert unique ID column
df.insert(0, 'id', pd.Series(range(df.shape[0])))
# persist actual context, that will be used as subject table
df_ctx = df[['id'] + ctx_cols]
df_ctx.to_csv('census-context.csv', index=False)
display(df_ctx.head())
# persist actual target, that will be used as linked table
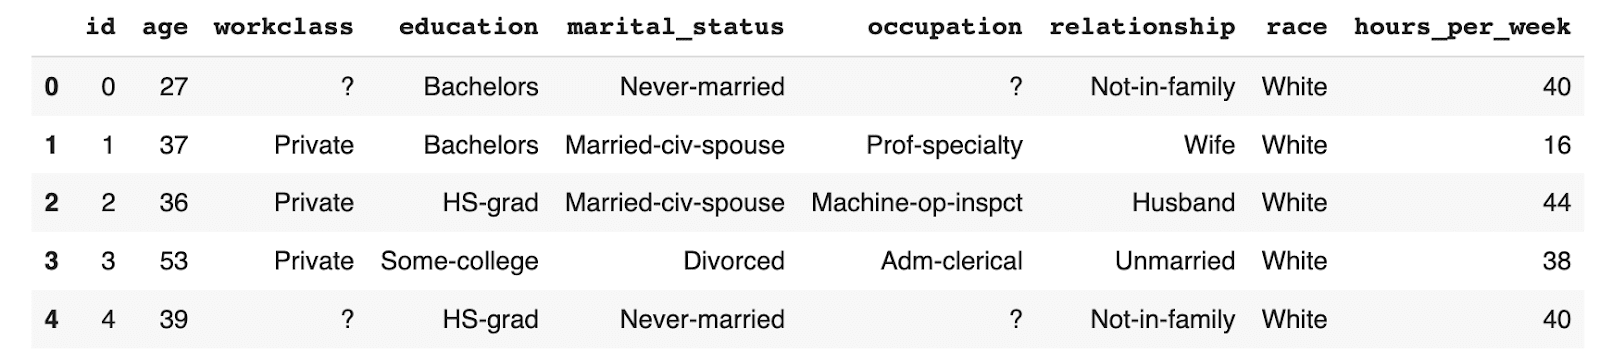
df_tgt = df[['id'] + tgt_cols]
df_tgt.to_csv('census-target.csv', index=False)
display(df_tgt.head())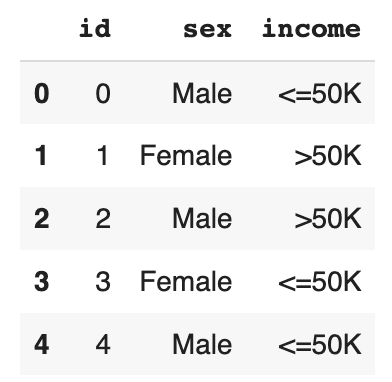
Save the resulting tables to disk as CSV files in order to upload them to MOSTLY AI in the next step. If you are working in Colab this will require an extra step (provided in the notebook) in order to download the files from the Colab server to disk.
Train a generative model with MOSTLY AI
Use the CSV files you have just created to train a synthetic data generation model using MOSTLY AI.
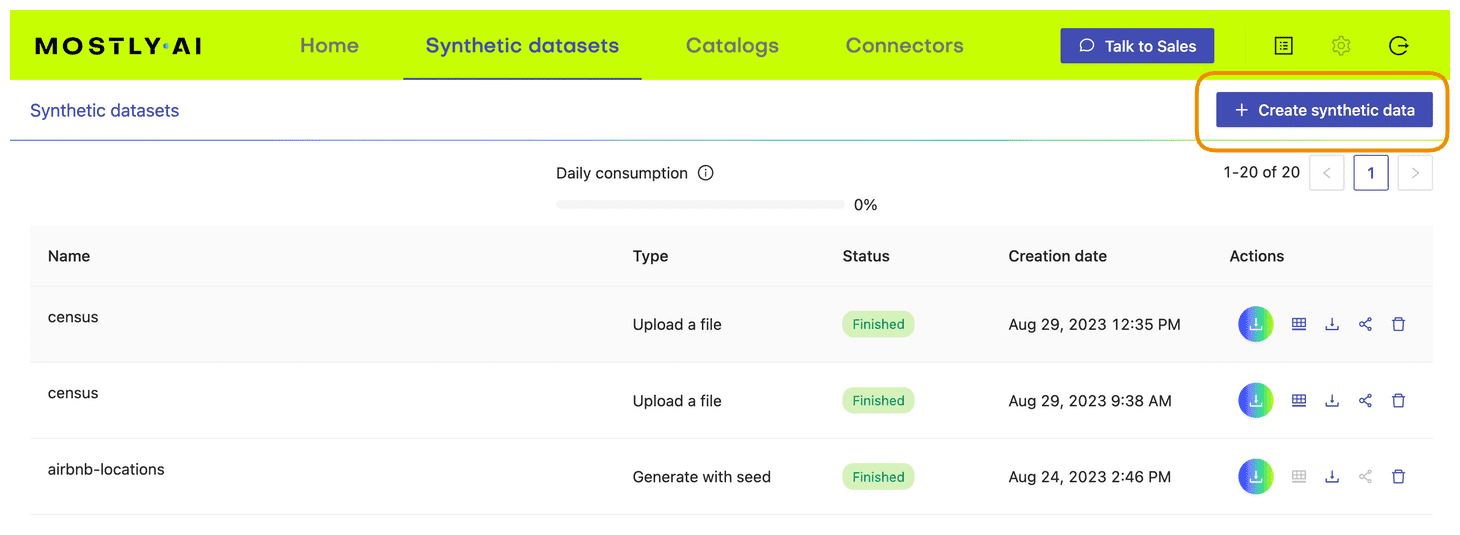
- Navigate to your MOSTLY AI account and go to the “Synthetic datasets” tab. Click on “Create synthetic data” to start a new job.
- Upload the census-context.csv (the file containing your context data).
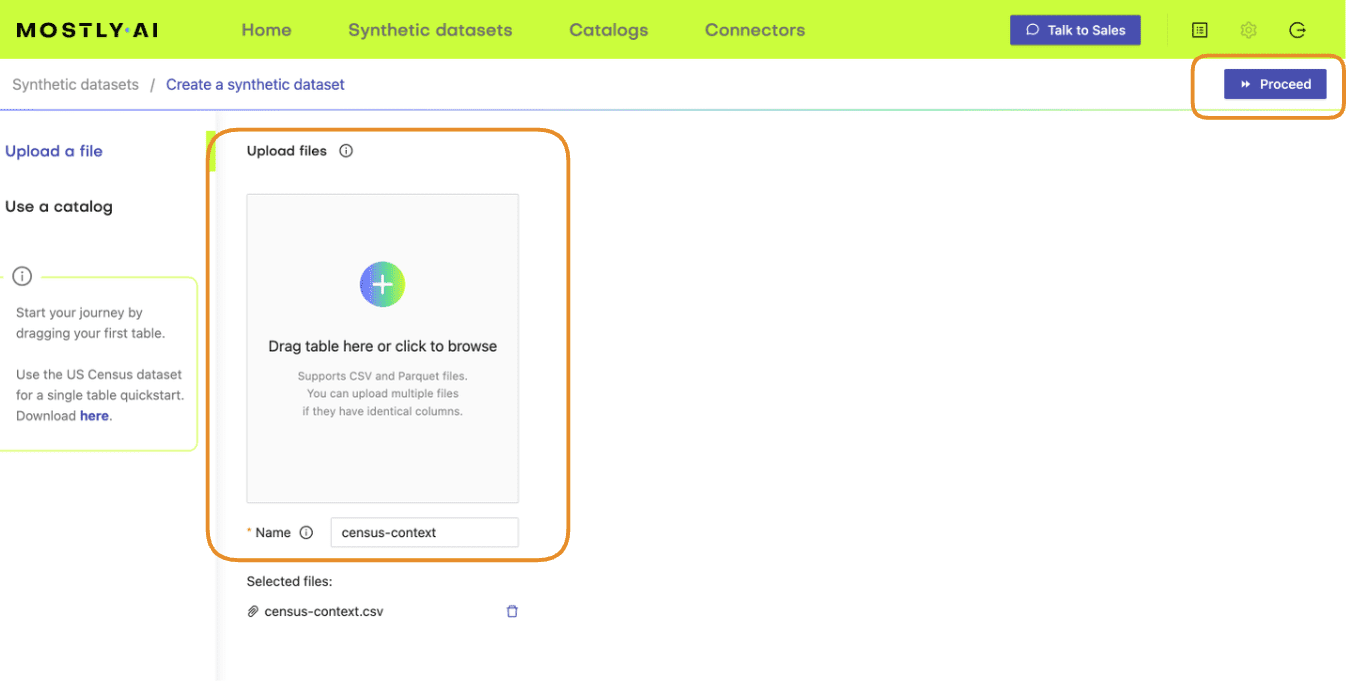
- Once the upload is complete, click on “Add table” and upload census-target.csv (the file containing your target data) here.
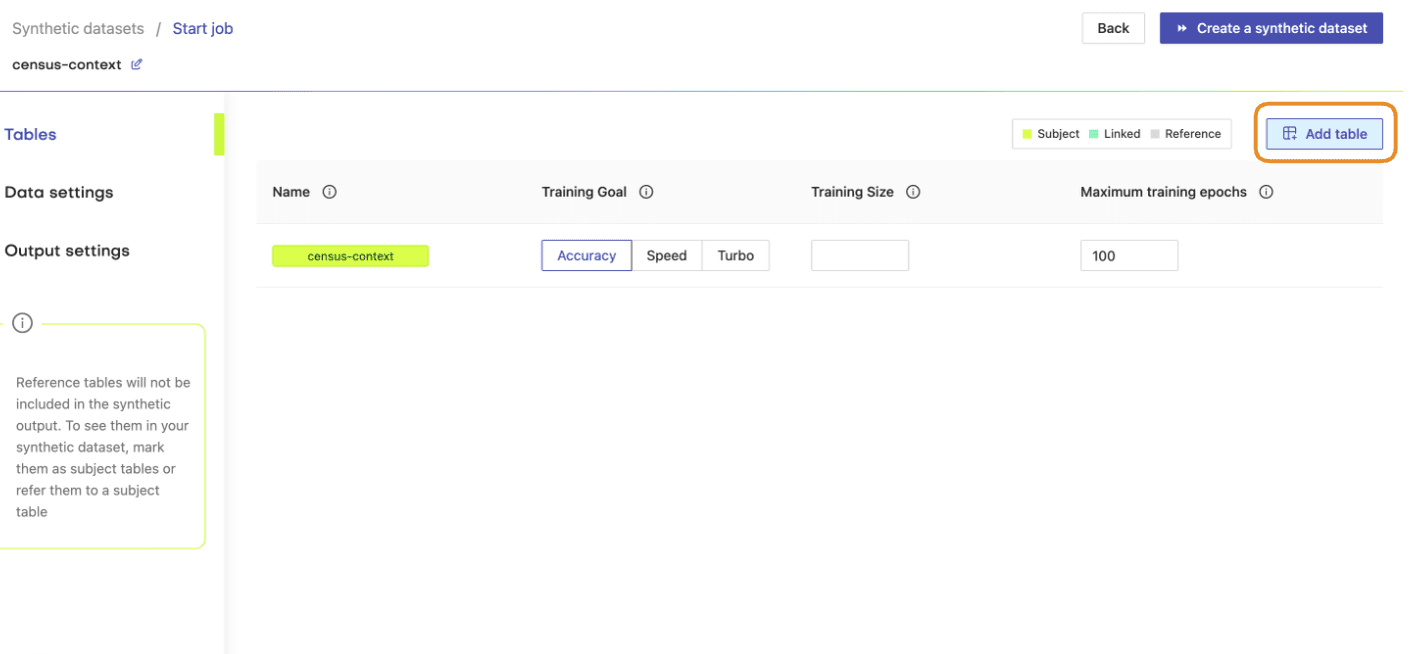
- Next, define the table relationship by navigating to “Data Settings,” selecting the ID column of the context table, and setting the following settings:
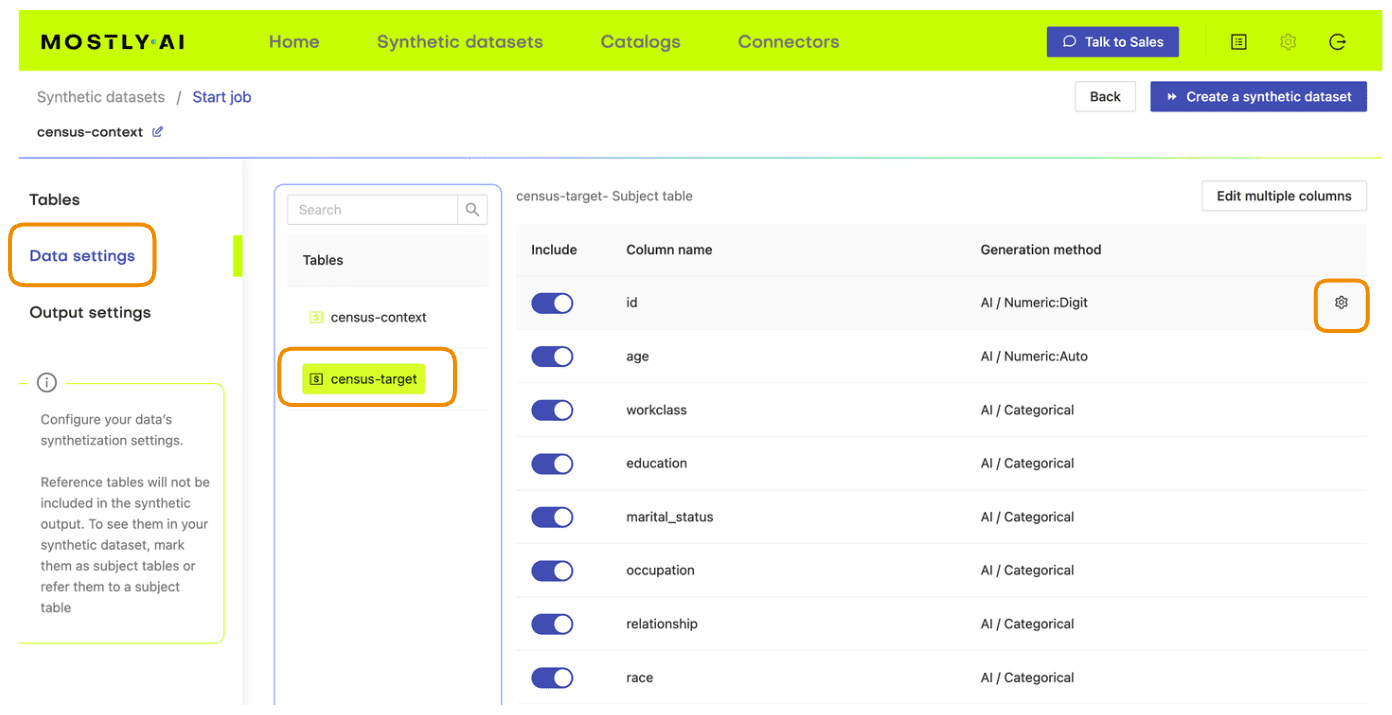
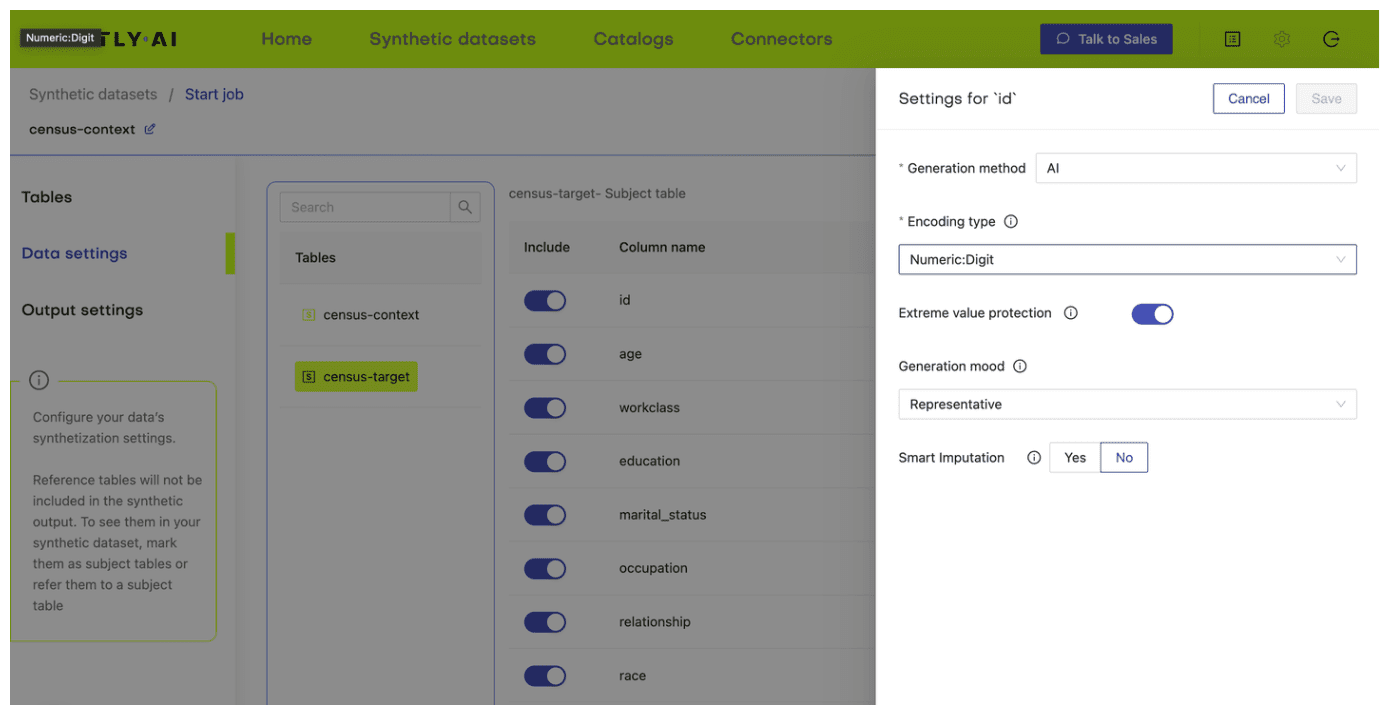
- Confirm that your census-context table is now set as the subject table and the
census-targetas linked table.
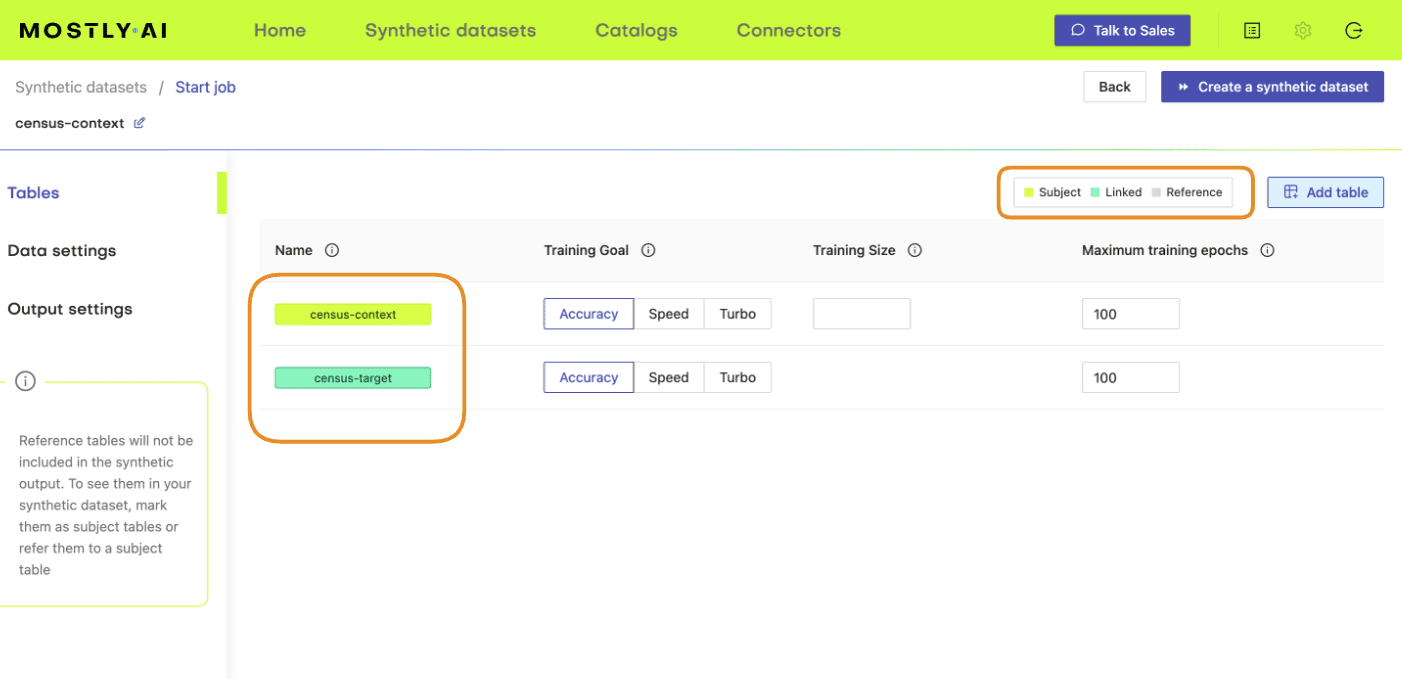
- Click “Create a synthetic dataset” to launch the job and train the model. As noted before, the resulting synthetic data is not of particular interest at the moment. We are interested in the model that is created and will use it for conditional data generation in the next section.
Conditional data generation with MOSTLY AI
Now that we have our base model, we will need to specify the conditions within which we want to create synthetic data. For this first use case, you will simulate what the dataset will look like if there was no gender income gap.
- Create a CSV file that contains the same columns as the context file but now containing the specific distributions of those variables you are interested in simulating. In this case, we’ll create a dataset containing an even split between male and female records as well as an even distribution of high- and low-income records. You can use the code block below to do this.
import numpy as np
np.random.seed(1)


n = 10_000
p_inc = (df.income=='>50K').mean()
seed = pd.DataFrame({
    'id': [f's{i:04}' for i in range(n)],
    'sex': np.random.choice(['Male', 'Female'], n, p=[.5, .5]),
    'income': np.random.choice(['<=50K', '>50K'], n, p=[1-p_inc, p_inc]),
})
seed.to_csv('census-seed.csv', index=False)
seed.sample(8)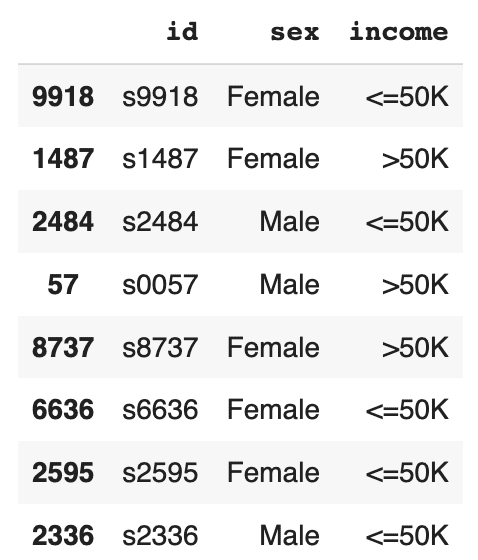
The resulting DataFrame contains an even income split between males and females, i.e. no gender income gap.
- Download this CSV to disk as
census-seed.csv
- In your MOSTLY AI account, click on the “Generate more data” button located to the right of the model that you have just trained.
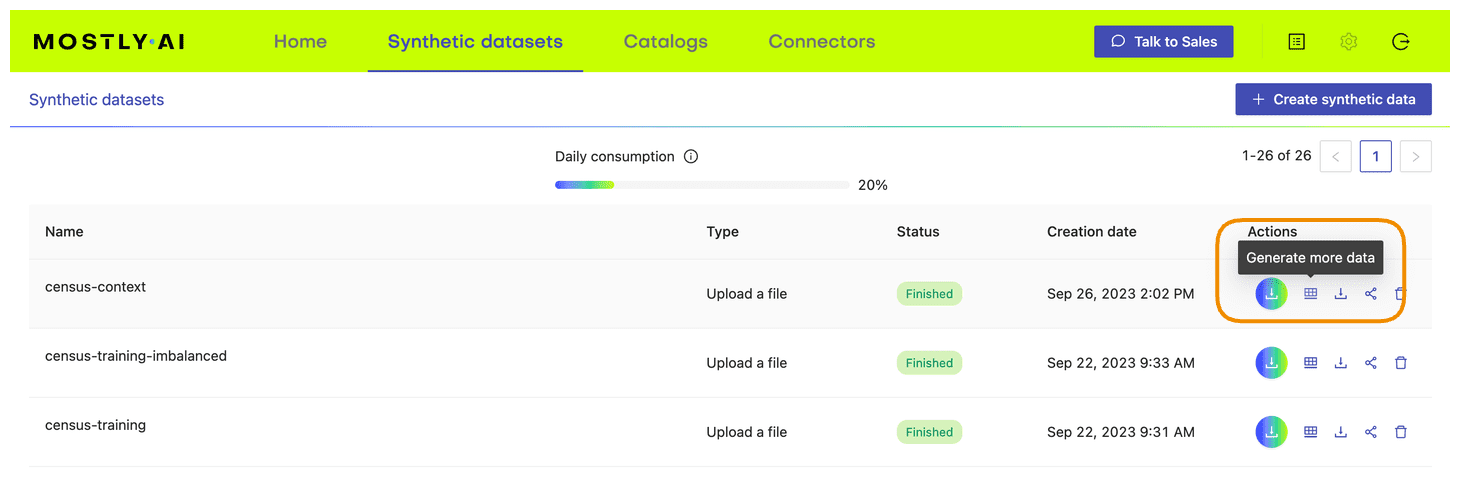
- Select the “Generate with seed” option. This allows you to specify conditions that the synthesization should respect. Upload
census-seed.csvhere.
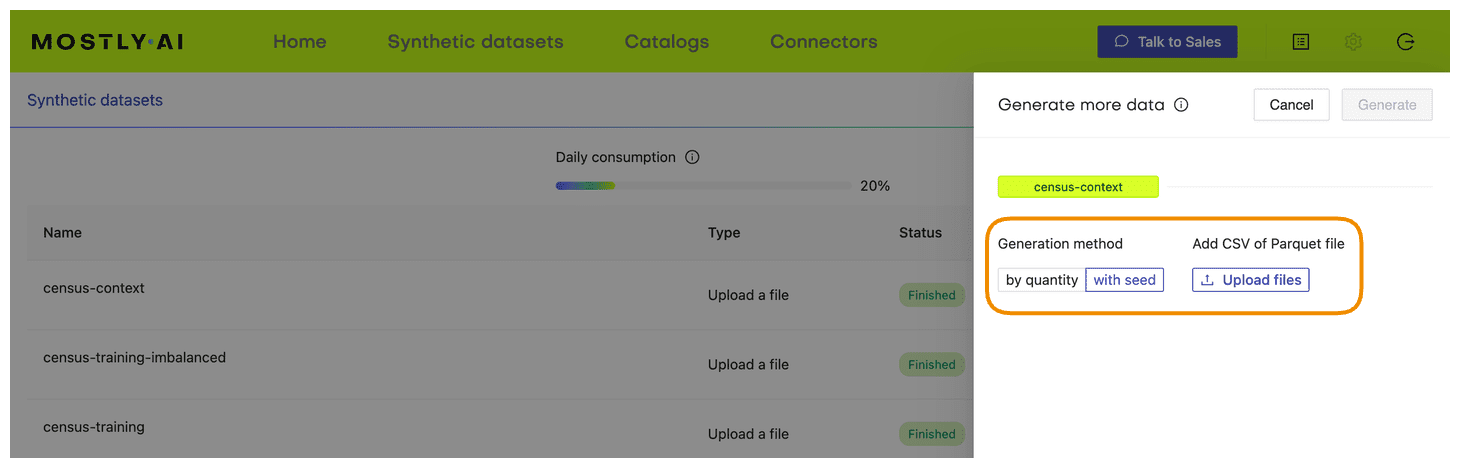
- Generate more data by clicking on “Generate”. Once completed, download the resulting synthetic dataset as CSV.
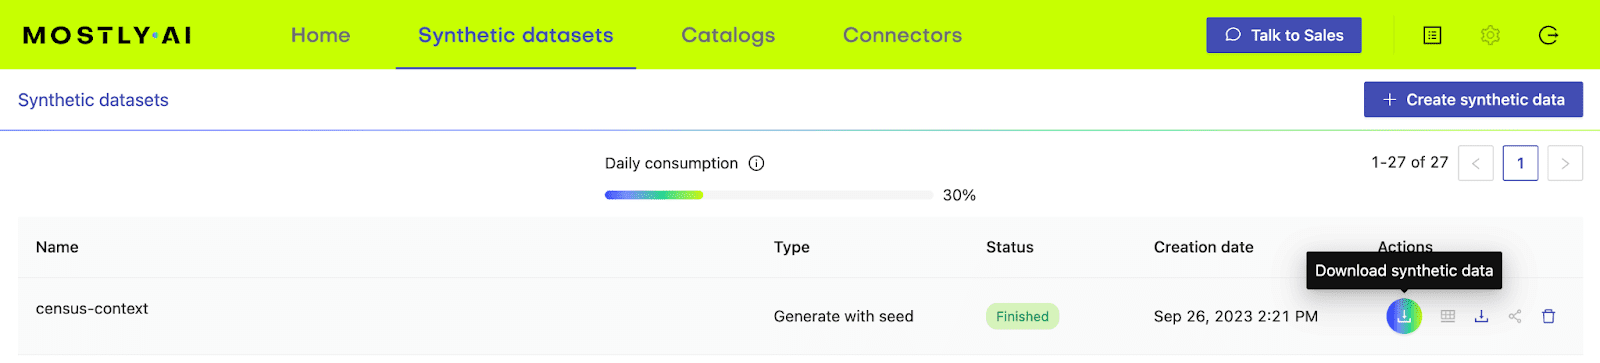
- Merge the synthetic target data to your seed context columns to get your complete, conditionally generated dataset.
# merge fixed seed with synthetic target to
# a single partially synthetic dataset
syn = pd.read_csv(syn_file_path)
syn = pd.merge(seed, syn, on='id').drop(columns='id')
Explore synthetic data
Let’s take a look at the data you have just created using conditional data generation. Start by showing 10 randomly sampled synthetic records. You can run this line multiple times to see different samples.
syn.sample(n=10)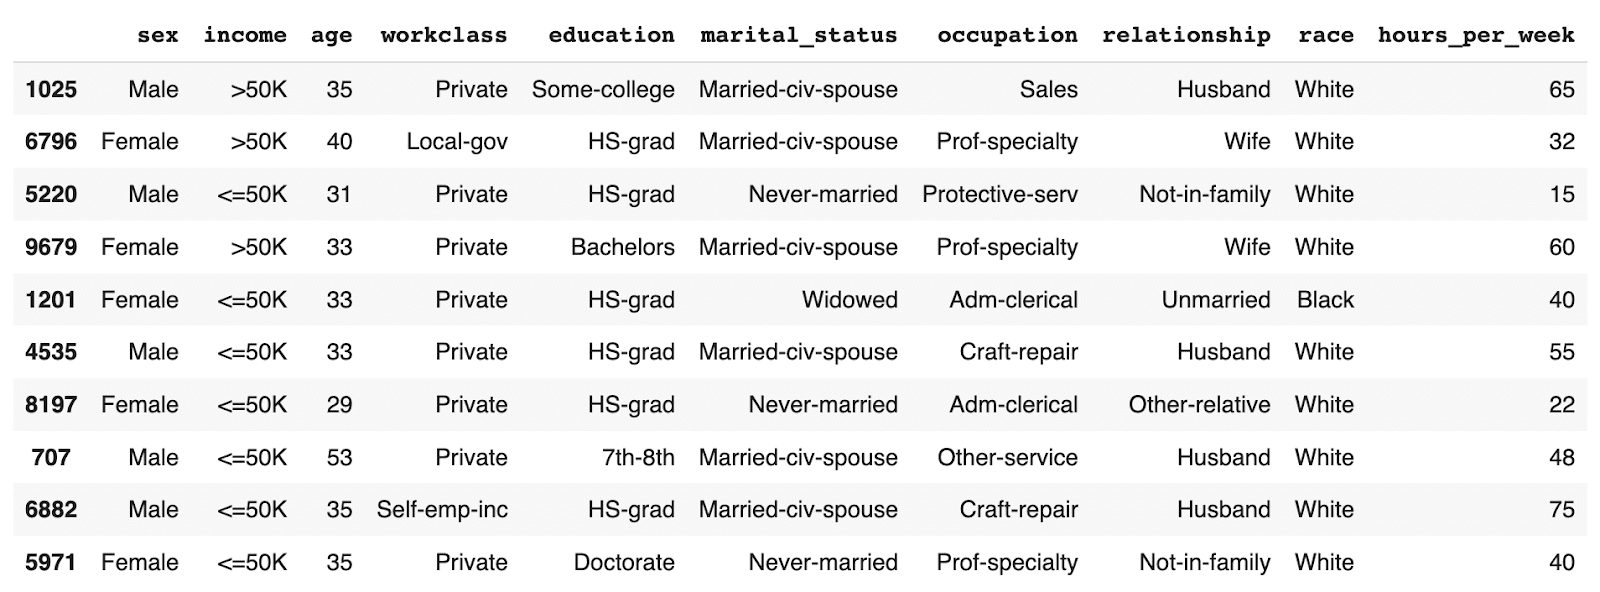
You can see that the partially synthetic dataset consists of about half male and half female records.
Let's now compare the age distribution of records from the original data against those from the partially synthetic data. We’ll plot both the original and synthetic distributions on a single plot to compare.
import matplotlib.pyplot as plt
plt.xlim(10, 95)
plt.title('Female Age Distribution')
plt.xlabel('Age')
df[df.sex=='Female'].age.plot.kde(color='black', bw_method=0.2)
syn[syn.sex=='Female'].age.plot.kde(color='#24db96', bw_method=0.2)
plt.legend({'original': 'black', 'synthetic': '#24db96'})
plt.show()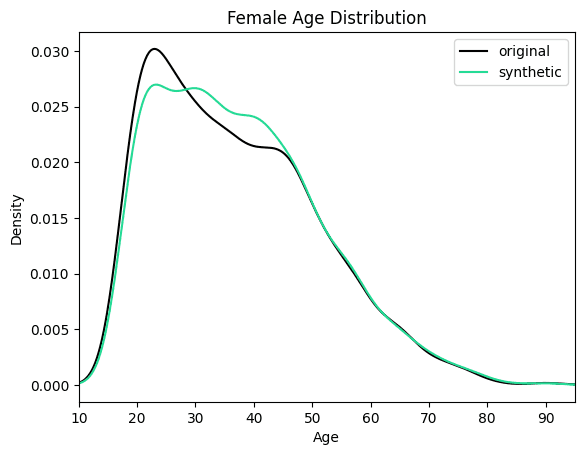
We can see clearly that the synthesized female records are now significantly older in order to meet the criteria of removing the gender income gap. Similarly, you can now study other shifts in the distributions that follow as a consequence of the provided seed data.
Conditional generation to retain original data
In the above use case, you customized your data generation process in order to simulate a particular, predetermined distribution for specific columns of interest (i.e. no gender income gap). In the following section, we will explore another useful application of conditional generation: retaining certain columns of the original dataset exactly as they are while letting the rest of the columns be synthesized. This can be a useful tool in situations when it is crucial to retain parts of the original dataset.
In this section, you will be working with a dataset containing the 2019 Airbnb listings in Manhattan. For this use case, it is crucial to preserve the exact locations of the listings in order to avoid situations in which the synthetic dataset contains records in impossible or irrelevant locations (in the middle of the Hudson River, for example, or outside of Manhattan entirely).
You need the ability to execute control over the location column to ensure the relevance and utility of your resulting synthetic dataset - and conditional data generation gives you exactly that level of control.
Let’s look at this type of conditional data generation in action. Since many of the steps will be the same as in the use case above, this section will be a bit more compact.
Preprocess your data
Start by enriching the DataFrame with an id column. Then split it into two DataFrames: airbnb-context.csv and airbnb-target.csv. Additionally, you will need to concatenate the latitude and longitude columns together into a single column. This is the format expected by MOSTLY AI, in order to improve its representation of geographical information.
df_orig = pd.read_csv(f'{repo}/airbnb.csv')

df = df_orig.copy()

# concatenate latitude and longitude to "LAT, LONG" format
df['LAT_LONG'] = (
    df['latitude'].astype(str) + ', ' + df['longitude'].astype(str)
)
df = df.drop(columns=['latitude', 'longitude'])

# define list of columns, on which we want to condition on
ctx_cols = ['neighbourhood', 'LAT_LONG']
tgt_cols = [c for c in df.columns if c not in ctx_cols]

# enricht with ID column
df.insert(0, 'id', pd.Series(range(df.shape[0])))

# persist actual context, that will be used as subject table
df_ctx = df[['id'] + ctx_cols]
df_ctx.to_csv('airbnb-locations.csv', index=False)
display(df_ctx.head())

# persist actual target, that will be used as linked table
df_tgt = df[['id'] + tgt_cols]
df_tgt.to_csv('airbnb-data.csv', index=False)
display(df_tgt.head())
Train generative model with MOSTLY AI
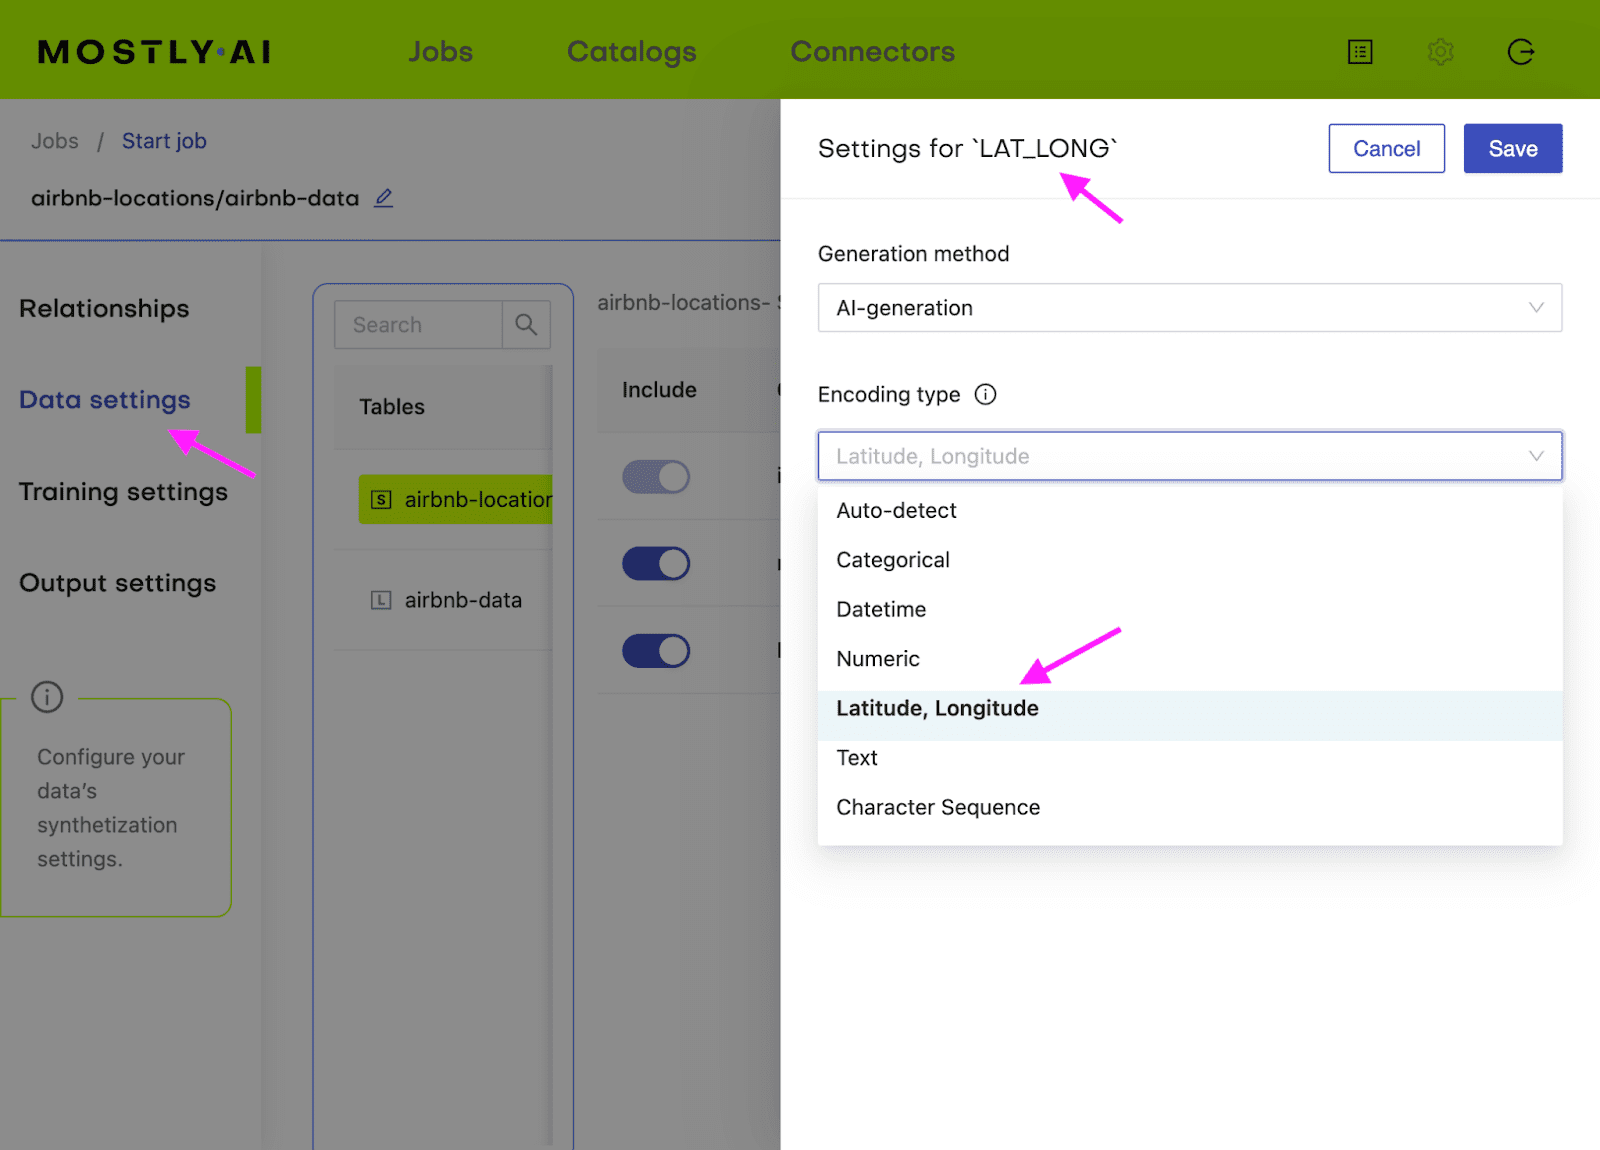
Follow the same steps as in the first use case to train a generative model with MOSTLY AI. Upload airbnb-locations.csv first, then add the airbnb-data.csv file and define the table relationship by setting the ID column of the airbnb-data table as the Foreign Key pointing to the ID column of the airbnb-locations file. Refer to the detailed steps in the first use case if you need a refresher on how to do that.
Additionally, you will need to configure the LAT_LONG column to the encoding type Lat, Long in order for MOSTLY AI to correctly process this geolocation data.
Generate more data with MOSTLY AI
Once the training has finished, you can generate your partially synthetic data. In the previous example, this is where we uploaded the seed context file that we generated. In this case, we actually want our fixed attributes to remain exactly as they are in the original dataset. This means you can simply re-upload the original airbnb-locations.csv as the seed file to the "generate more data" form. Once the data has been generated, download the data as a CSV file again. Merge the two files (seed and synthetic target) and split the LAT_LONG column back into separate latitude and longitude columns.
# merge fixed seed with synthetic target
# to a single partially synthetic dataset
syn = pd.read_csv(syn_file_path)
syn_partial = pd.merge(df_ctx, syn, on='id')

# split LAT_LONG into separate columns again
syn_partial = pd.concat([
    syn_partial,
    syn_partial.LAT_LONG.str.split(', ', n=2, expand=True).rename(columns={0: 'latitude', 1: 'longitude'}).astype(float),
], axis=1).drop(columns='LAT_LONG')

# restore column order
syn_partial = syn_partial[df_orig.columns]
Explore synthetic data
Let's compare the price distribution of listings across Manhattan. Note that while the locations in the partially synthetic data are actual locations, all other attributes, including the price per night, are randomly sampled by the generative model. Still, these prices remain statistically representative given the context, i.e. the location within Manhattan.
The code block below plots the price distribution of the original dataset as well as that of the partially synthetic dataset. We hope to see the exact same locations (so no listings in the middle of the Hudson River) and a price distribution that is statistically similar but not exactly the same.
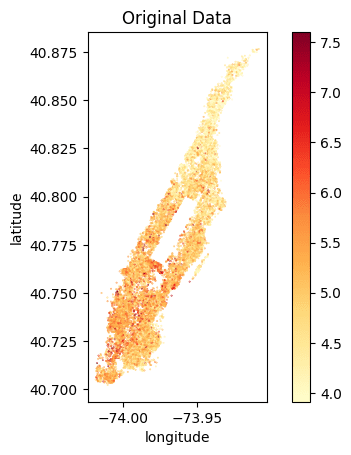
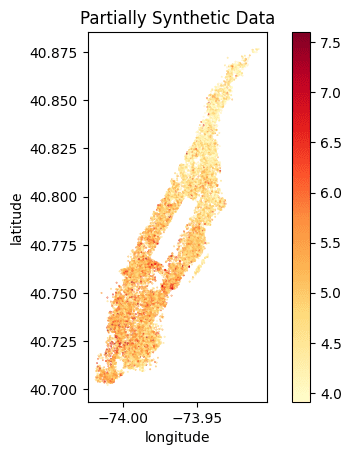
We can clearly see that the locations of the listings have been preserved and the price distribution is accurately represented. We can see a similar gradient of lower prices per night in the Northern tip of Manhattan as well as high prices per night at the Southern end of Central Park and the Financial District.
Of course, you could also create fully synthetic data for this use case, and this will yield statistically representative locations with their attributes. However, as these locations do not necessarily exist (e.g. they might end up in the Hudson River), the demonstrated approach allows you to combine the best of both worlds.
Conditional data generation with MOSTLY AI
In this tutorial, you have learned how to perform conditional data generation. You have explored the value conditional generation can provide by working through two use cases: one in which you simulated a specific distribution for a subset of the columns (the Adult Income dataset with no gender income gap) and another in which you retained certain columns of the original dataset (the locations of the Airbnb listings). In both cases, you were able to execute more fine-grained control over the statistical distributions of your synthetic data by setting certain conditions in advance.
The result is a dataset that is partially pre-determined by the user (to either remain in its original form or follow a specific distribution) and partially synthesized. You can now put your conditional data generation skill to use for data simulation, to tackle data drift, or for other relevant use cases.
What’s next?
In addition to walking through the above instructions, we suggest experimenting with the following to get an even deeper understanding of conditional data generation:
- use a different set of fixed columns for the US Census dataset
- generate a very large number of records for a fixed value set, e.g. create 1 million records of 48-year-old female Professors
- perform a fully synthetic dataset of the Airbnb Manhattan dataset