As we wrap up 2023, the corporate world is abuzz with the next technological wave: Enterprise AI. Over the past few years, AI has taken center stage in conversations across newsfeeds and boardrooms alike. From the inception of neural networks to the emergence of companies like Deepmind at Google and the proliferation of Deepfake videos, AI's influence has been undeniable.
While some are captivated by the potential of these advancements, others approach them with caution, emphasizing the need for clear boundaries and ethical guidelines. Tech visionaries, including Elon Musk, have voiced concerns about AI's ethical complexities and potential dangers when deployed without stringent rules and best practices. Other advocates of AI skepticism include Timnit Gebru, one of the first people to sound alarms at Google, Dr. Hinton, the godfather of AI and even Sam Altman, CEO of OpenAI, voiced concerns, as well as the renowned historian Yuval Harari.
Now, Enterprise AI is knocking on the doors of corporate boardrooms, presenting executives with a familiar challenge: the eternal dilemma of adopting new technology. Adopt too early, and you risk venturing into the unknown, potentially inviting reputational and financial damage. Adopt too late, and you might miss the efficiency and cost-cutting opportunities that Enterprise AI promises.
What is Enterprise AI?
Enterprise AI, also known as Enterprise Artificial Intelligence, refers to the application of artificial intelligence (AI) technologies and techniques within large organizations or enterprises to improve various aspects of their operations, decision-making processes, and customer interactions. It involves leveraging AI tools, machine learning algorithms, natural language processing, and other AI-related technologies to address specific business challenges and enhance overall efficiency, productivity, and competitiveness.
In a world where failing to adapt has led to the downfall of organizations, as witnessed in the recent history of the banking industry with companies like Credit Suisse, the pressure to reduce operational costs and stay competitive is more pressing than ever. Add to this mix the current macroeconomic landscape, with higher-than-ideal inflation and lending rates, and the urgency for companies not to be left behind becomes palpable.
Moreover, many corporate leaders still find themselves grappling with the pros and cons of integrating the previous wave of technologies, such as blockchain. Just as the dust was settling on blockchain's implementation, AI burst into the spotlight. A limited understanding of how technologies like neural networks function, coupled with a general lack of comprehension regarding their potential business applications, has left corporate leaders facing a perfect storm of FOMO (Fear of Missing Out) and FOCICAD (Fear of Causing Irreversible Chaos and Damage).
So, how can industry leaders navigate the world of Enterprise AI without losing their footing and potentially harming their organizations? The answer lies in combining traditional business processes and quality management with cutting-edge auxiliary technologies to mitigate the risks surrounding AI and its outputs. Here are the questions which QuantumBlack, AI by McKinsey, suggests boards to ask about generative AI.
Laying the foundation for Enterprise AI adoption
To embark on a successful Enterprise AI journey, companies need to build a strong foundation. This involves several crucial steps:
- Data Inventories: Conduct thorough data inventories to gain a comprehensive understanding of your organization's data landscape. This step helps identify the type of data available, its quality, and its relevance to AI initiatives.
- Assess Data Architectures: Evaluate your existing data structures and systems to determine their compatibility with AI integration. Consider whether any modifications or updates are necessary to ensure smooth data flow and accessibility.
- Cost Estimation: Calculate the costs associated with adopting AI, including labor for data preparation and model development, technology investments, and change management expenses. This step provides a realistic budget for your AI initiatives.
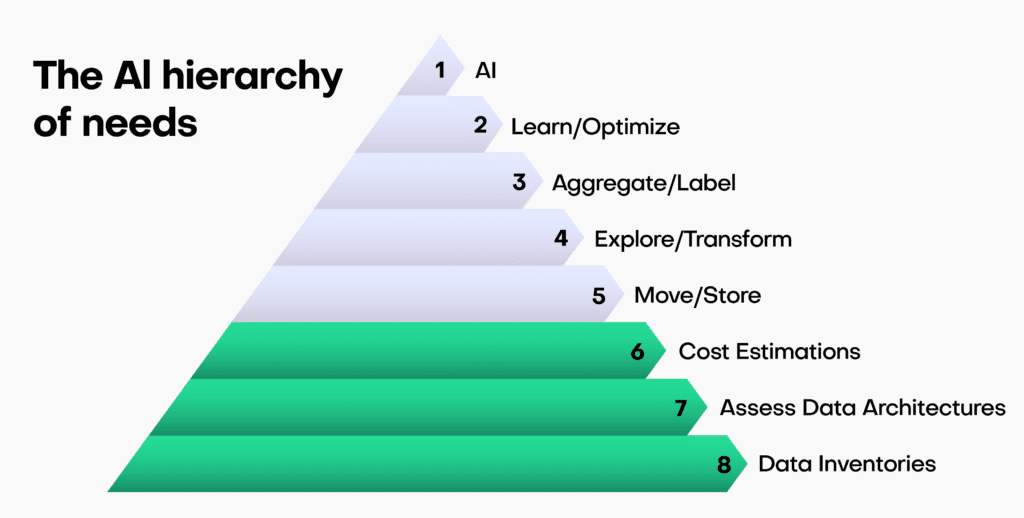
By following these steps, organizations can lay the groundwork for a successful AI adoption strategy. It helps in avoiding common pitfalls related to data quality and infrastructure readiness.
Leveraging auxiliary technologies in Enterprise AI
In a recent survey by a large telecommunications company, half of all respondents said they wait up to one month for privacy approvals before they can proceed with their data processing and analytics activities. Data Processing Agreements (DPAs), Secure by Design processes, and further approvals are the main reasons behind these high lead times.
The demand for quicker, more accessible, and statistically representative data makes the case that real and mock data just aren't good enough to meet these (somewhat basic) requirements.
On the other side, however, The Wall Street Journal has recently reported that big tech companies such as Microsoft, Google, and Adobe are struggling to make AI technology profitable as they attempt to integrate it into their existing products.
The dichotomy we see here can put decision-makers into a state of paralysis: the need to act is imminent, but the price of poor action is high. Trustworthy and competent guidance, along with a sound strategy, is the only way out of the AI rabbit hole and towards AI-based solutions that can be monetized and thereby target and alleviate corporate pain points.
One of the key strategies to mitigate the risks associated with AI adoption is to leverage auxiliary technologies. These technologies act as force multipliers, enhancing the efficiency and safety of AI implementations. Recently, European lawmakers specifically included synthetic data in the draft of the EU's upcoming AI Act, as a data type explicitly suitable for building AI systems.
In this context, MOSTLY AI's Synthetic Data Platform emerges as a powerful ally. This innovative platform offers synthetic data generation capabilities that can significantly aid in AI development and deployment. Here's how it can benefit your organization:
- Enhancing Data Privacy: Synthetic data allows organizations to work with data that resembles their real data but contains no personally identifiable information (PII). This ensures compliance with data privacy regulations, such as GDPR and HIPAA.
- Reducing Data Bias: The platform generates synthetic data that is free from inherent biases present in real data. This helps in building fair and unbiased AI models, reducing the risk of discrimination.
- Accelerating AI Development: Synthetic data accelerates AI development by providing a diverse dataset that can be used for training and testing models. It reduces the time and effort required to collect and clean real data.
- Testing AI Systems Safely: Organizations can use synthetic data to simulate various scenarios and test AI systems without exposing sensitive or confidential information.
- Cost Efficiency: Synthetic data reduces the need to invest in expensive data collection and storage processes, making AI adoption more cost-effective.
By incorporating MOSTLY AI's Synthetic Data Platform into your AI strategy, you can significantly reduce the complexities and uncertainties associated with data privacy, bias, and development timelines.
Enterprise AI example: ChatGPT's Code Interpreter
To illustrate the practical application of auxiliary technologies, let's consider a concrete example: Chat GPT's code interpreter in conjunction with MOSTLY AI’s Synthetic Data Platform. This innovative duo-tool plays a pivotal role in ensuring companies can harness the power of AI while maintaining safety and compliance. Business teams can feed statistically meaningful synthetic data into their corporate ChatGPT instead of real corporate data and thereby meet both data accuracy and privacy objectives.
Defining guidelines and best practices for Enterprise AI
Before diving into Enterprise AI implementation, it's essential to set clear guidelines and best practices. This involves:
- Scope and Planning Strategy: Define the scope of your AI implementation, aligning it with your organization's strategic objectives. Create a comprehensive plan that outlines the steps, timelines, and resources required for a successful AI deployment.
Embracing auxiliary technologies
In the context of auxiliary technologies, MOSTLY AI's Synthetic Data Platform is an invaluable resource. This platform provides organizations with the ability to generate synthetic data that closely mimics their real data, without compromising privacy or security.
Insight: The combination of setting clear guidelines and leveraging auxiliary technologies like MOSTLY AI's Synthetic Data Platform ensures a smoother and safer AI journey for organizations, where innovation can thrive without fear of adverse consequences.
The transformative force of Enterprise AI
In summary, Enterprise AI is no longer a distant concept but a transformative force reshaping the corporate landscape. The challenges it presents are real, as are the opportunities.
We've explored the delicate balance executives must strike when considering AI adoption, the ethical concerns that underscore this technology, and a structured approach to navigate these challenges. Auxiliary technologies like MOSTLY AI's Synthetic Data Platform serve as indispensable tools, allowing organizations to harness the full potential of AI while safeguarding against risks.
As you embark on your Enterprise AI journey, remember that the right tools and strategies can make all the difference. Explore MOSTLY AI's Synthetic Data Platform to discover how it can enhance your AI initiatives and keep your organization on the path to success. With a solid foundation and the right auxiliary technologies, the future of Enterprise AI holds boundless possibilities.
If you would like to know more about synthetic data, we suggest trying MOSTLY AI's free synthetic data generator, using one of the sample dataets provided within the app or reach out to us for a personalized demo!
The European Union’s Artificial Intelligence Act (“AI Act”) is likely to have a profound impact on the development and utilization of artificial intelligence systems. Anonymization, particularly in the form of synthetic data, will play a pivotal role in establishing AI compliance and addressing the myriad challenges posed by the widespread use of AI systems.
This blog post offers an introductory overview of the primary features and objectives of the draft EU AI Act. It also elaborates on the indispensable role of synthetic data in ensuring AI compliance with data management obligations, especially for high-risk AI systems.
Notably, we focus on the European Parliament’s report on the proposal for a regulation of the European Parliament and the Council, which lays down harmonized rules on Artificial Intelligence (the Artificial Intelligence Act) and amends certain Union Legislative Acts (COM(2021)0206 – C9-0146/2021 – 2021/0106(COD)). It's important to note that this isn't the final text of the AI Act.
The first comprehensive regulation for AI compliance
The draft AI Act is a hotly debated legal initiative that will apply to providers and deployers of AI systems, among others. Remarkably, it is set to become the world's first comprehensive mandatory legal framework for AI. This will directly impact researchers, developers, businesses, and citizens involved in or affected by AI. AI compliance is a brand new domain that will transform the way companies manage their data.
The choice: AI compliance or costly consequences
Much like the GDPR, failure to comply with the AI Act's obligations can have substantial financial repercussions: maximum fines for non-compliance under the draft AI Act can be nearly double those under the GDPR. Depending on the severity and duration of the violation, penalties can range from warnings to fines of up to 7% of the offender's annual worldwide turnover.
Additionally, national authorities can order the withdrawal or recall of non-compliant AI systems from the market or impose temporary or permanent bans on their use. AI compliance is set to become a serious financial issue for companies doing business in the EU.
Risk-based classification
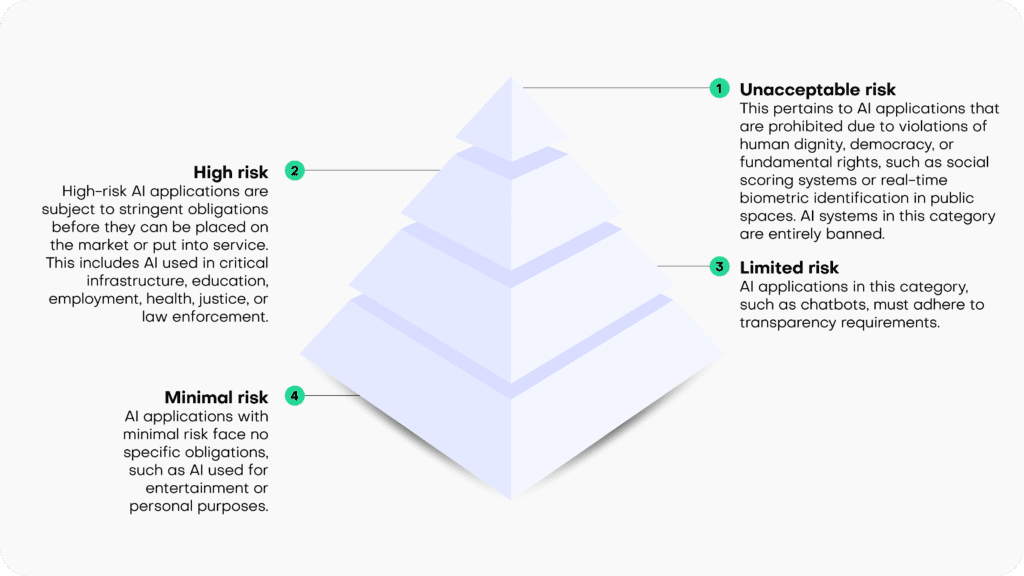
The draft EU AI Act operates on the principle that the level of regulation should align with the level of risk posed by an AI system. It categorizes AI systems into four risk categories:
- Unacceptable risk: This pertains to AI applications that are prohibited due to violations of human dignity, democracy, or fundamental rights, such as social scoring systems or real-time biometric identification in public spaces. AI systems in this category are entirely banned.
- High risk: High-risk AI applications are subject to stringent obligations before they can be placed on the market or put into service. This includes AI used in critical infrastructure, education, employment, health, justice, or law enforcement.
- Limited risk: AI applications in this category, such as chatbots, must adhere to transparency requirements.
- Minimal risk: AI applications with minimal risk face no specific obligations, such as AI used for entertainment or personal purposes.
Synthetic solutions for AI compliance
The draft AI Act focuses its regulatory efforts on high-risk AI systems, imposing numerous obligations on them. These obligations encompass ensuring the robustness, security, and accuracy of AI systems. It also mandates the ability to correct or deactivate the system in case of errors or risks, as well as implementing human oversight and intervention mechanisms to prevent or mitigate harm or adverse impacts, as well as a number of additional requirements.
Specifically, under the heading “Data and data governance”, Art. 10 sets out strict quality criteria for training, validation and testing data sets (“data sets”) used as a basis for the development of “[h]igh-risk AI systems which make use of techniques involving the training of models with data” (which likely encompasses most high-risk AI systems).
According to Art 10(2), the respective data sets shall be subject to appropriate data governance and management practices. This includes, among other things, an examination of possible biases that are likely to affect the health and safety of persons, negatively impact fundamental rights, or lead to discrimination (especially with regard to feedback loops), and requires the application of appropriate measures to detect, prevent, and mitigate possible biases. Not surprisingly, AI compliance will start with the underlying data.
Pursuant to Art 10 (3), data sets shall be “relevant, sufficiently representative, appropriately vetted for errors and as complete as possible in view of the intended purpose” and shall “have the appropriate statistical properties […]“.
Art 10(5) specifically stands out in the data governance context, as it contains a legal basis for the processing of sensitive data, as protected, among other provisions, by Art 9(1) GDPR: Art 10(5) entitles high-risk AI system providers, to the extent that is strictly necessary for the purposes of ensuring negative bias detection and correction, to exceptionally process sensitive personal data. However, such data processing must be subject to “appropriate safeguards for the fundamental rights and freedoms of natural persons, including technical limitations on the re-use and use of state-of-the-art security and privacy-preserving [measures]“.
Art 10(5)(a-g) sets out specific conditions which are prerequisites for the processing of sensitive data in this context. The very first condition, as stipulated in Art 10(5)(a) sets the scene: the data processing under Art 10 is only allowed if its goal, namely bias detection and correction “cannot be effectively fulfilled by processing synthetic or anonymised data”. Conversely, if an AI system provider is able detect and correct bias by using synthetic or anonymized data, it is required to do so and cannot rely on other “appropriate safeguards”.
The distinction between synthetic and anonymized data in the parliamentary draft of the AI Act is somewhat confusing, since considering the provision’s purpose, arguably only anonymized synthetic data qualifies as preferred method for tackling data bias. However, since anonymized synthetic data is a sub-category of anonymized data, the differentiation between those two terms is meaningless, unless the EU legislator attempts to highlight synthetic data as the preferred version of anonymized data (in which case the text of the provision should arguably read “synthetic or other forms of anonymized data”).
Irrespective of such details, it is clear that the EU legislator clearly requires the use of anonymized data for the processing of sensitive data as a primary bias detection and correction tool. It looks like AI compliance cannot be achieved without effective and AI-friendly data anonymization tools.
Recital 45(a) supports this (and extends the synthetic data use case to privacy protection and also addresses AI-system users, instead of only AI system providers):
“The right to privacy and to protection of personal data must be guaranteed throughout the entire lifecycle of the AI system. In this regard, the principles of data minimization and data protection by design and by default, as set out in Union data protection law, are essential when the processing of data involves significant risks to the fundamental rights of individuals.
Providers and users of AI systems should implement state-of-the-art technical and organizational measures in order to protect those rights. Such measures should include not only anonymization and encryption, but also the use of increasingly available technology that permits algorithms to be brought to the data and allows valuable insights to be derived without the transmission between parties or unnecessary copying of the raw or structured data themselves.”
The inclusion of synthetic data in the draft AI Act is a continuation of the ever-growing political awareness of the technology’s potential. This is underlined by a recent statement made by the EU Commission’s Joint Research Committee: “[Synthetic data] not only can be shared freely, but also can help rebalance under-represented classes in research studies via oversampling, making it the perfect input into machine learning and AI models."
Synthetic data is set to become one of the cornerstones of AI compliance in the very near future.
In this tutorial, you will learn how to use synthetic data to explore and validate a machine-learning model that was trained on real data. Synthetic data is not restricted by any privacy concerns and therefore enables you to engage a far broader group of stakeholders and communities in the model explanation and validation process. This enhances transparent algorithmic auditing and helps to ensure the safety of developed ML-powered systems through the practice of Explainable AI (XAI).
We will start by training a machine learning model on a real dataset. We will then evaluate and inspect this model using a synthesized (and therefore privacy-preserving) version of the dataset. This is also referred to as the Train-Real-Test-Synthetic methodology. We will then inspect the ML model using the synthetic data to better understand how the model makes its predictions. The Python code for this tutorial is publicly available and runnable in this Google Colab notebook.
Train model on real data
The first step will be to train a LightGBM model on a real dataset. You’ll be working with a subset of the UCI Adult Income dataset, consisting of 10,000 records and 10 attributes. The target feature is the income column which is a Boolean feature indicating whether the record is high-income (>50K) or not. Your machine learning model will use the 9 remaining predictor features to predict this target feature.
# load original (real) data
import numpy as np
import pandas as pd

df = pd.read_csv(f'{repo}/census.csv')
df.head(5)
And then use the following code block to define the target feature, preprocess the data and train the LightGBM model:
import lightgbm as lgb
from lightgbm import early_stopping
from sklearn.model_selection import train_test_split

target_col = 'income'
target_val = '>50K'

def prepare_xy(df):
    y = (df[target_col]==target_val).astype(int)
    str_cols = [
        col for col in df.select_dtypes(['object', 'string']).columns if col != target_col
    ]
    for col in str_cols:
        df[col] = pd.Categorical(df[col])
    cat_cols = [
        col for col in df.select_dtypes('category').columns if col != target_col
    ]
    num_cols = [
        col for col in df.select_dtypes('number').columns if col != target_col
    ]
    for col in num_cols:
        df[col] = df[col].astype('float')
    X = df[cat_cols + num_cols]
    return X, y

def train_model(X, y):
    cat_cols = list(X.select_dtypes('category').columns)
    X_trn, X_val, y_trn, y_val = train_test_split(
        X, y, test_size=0.2, random_state=1
    )
    ds_trn = lgb.Dataset(
        X_trn,
        label=y_trn,
        categorical_feature=cat_cols,
        free_raw_data=False
    )
    ds_val = lgb.Dataset(
        X_val,
        label=y_val,
        categorical_feature=cat_cols,
        free_raw_data=False
    )
    model = lgb.train(
        params={
            'verbose': -1,
            'metric': 'auc',
            'objective': 'binary'
        },
        train_set=ds_trn,
        valid_sets=[ds_val],
        callbacks=[early_stopping(5)],
    )
    return model
Run the code lines below to preprocess the data, train the model and calculate the AUC performance metric score:
X, y = prepare_xy(df)
model = train_model(X, y)
Training until validation scores don't improve for 5 rounds
Early stopping, best iteration is: [63] valid_0's auc: 0.917156
The model has an AUC score of 91.7%, indicating excellent predictive performance. Take note of this in order to compare it to the performance of the model on the synthetic data later on.
Explainable AI: privacy concerns and regulations
Now that you have your well-performing machine learning model, chances are you will want to share the results with a broader group of stakeholders. As concerns and regulations about privacy and the inner workings of so-called “black box” ML models increase, it may even be necessary to subject your final model to a thorough auditing process. In such cases, you generally want to avoid using the original dataset to validate or explain the model, as this would risk leaking private information about the records included in the dataset.
So instead, in the next steps you will learn how to use a synthetic version of the original dataset to audit and explain the model. This will guarantee the maximum amount of privacy preservation possible. Note that it is crucial for your synthetic dataset to be accurate and statistically representative of the original dataset. We want to maintain the statistical characteristics of the original data but remove the privacy risks. MOSTLY AI provides some of the most accurate and secure data synthesization in the industry.
Synthesize dataset using MOSTLY AI
Follow the steps below to download the original dataset and synthesize it via MOSTLY A’s synthetic data generator:
- Download
census.csvby clicking here, and then save the file to disk by pressing Ctrl+S or Cmd+S, depending on your operating system.

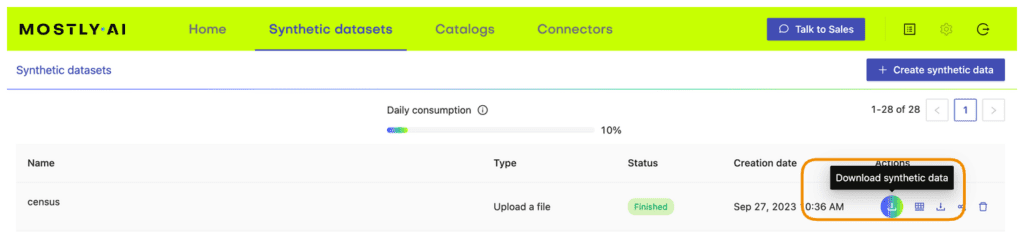
- Navigate to your MOSTLY AI account, click on the “Synthetic Datasets” tab, and upload
census.csvhere.
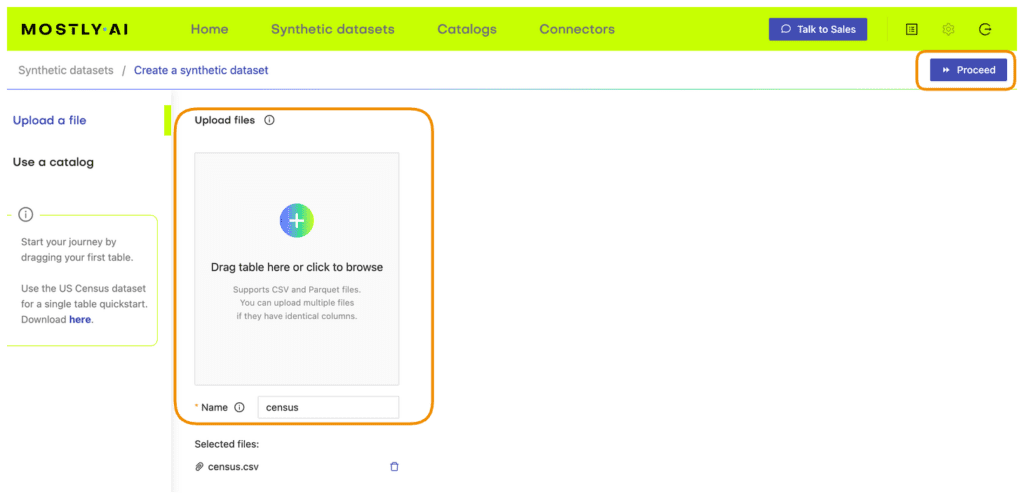
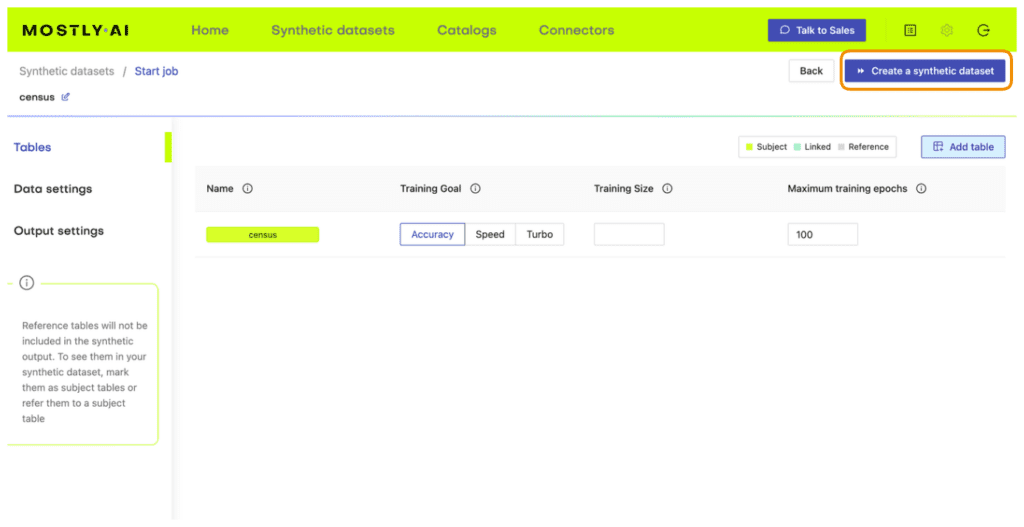
- Synthesize
census.csv, leaving all the default settings.
- Once the job has finished, download the generated synthetic data as a CSV file to your computer.
- Access the generated synthetic data from wherever you are running your code. If you are running in Google Colab, you will need to upload it by executing the next cell.
# upload synthetic dataset
if is_colab:
    import io
    uploaded = files.upload()
    syn = pd.read_csv(io.BytesIO(list(uploaded.values())[0]))
    print(f"uploaded synthetic data with {syn.shape[0]:,} records and {syn.shape[1]:,} attributes")
else:
    syn_file_path = './census-synthetic.csv'
    syn = pd.read_csv(syn_file_path)
    print(f"read synthetic data with {syn.shape[0]:,} records and {syn.shape[1]:,} attributes")
You can now poke around and explore the synthetic dataset, for example by sampling 5 random records. You can run the line below multiple times to see different samples.
syn.sample(5)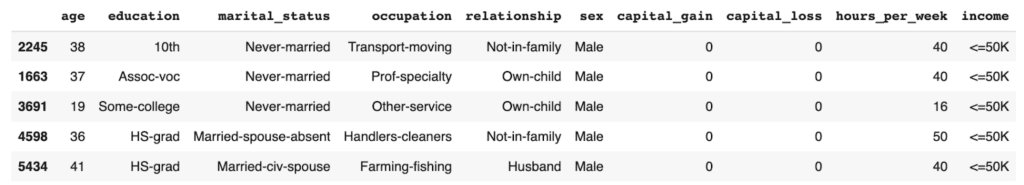
The records in the syn dataset are synthesized, which means they are entirely fictional (and do not contain private information) but do follow the statistical distributions of the original dataset.
Evaluate ML performance using synthetic data
Now that you have your synthesized version of the UCI Adult Income dataset, you can use it to evaluate the performance of the LightGBM model you trained above on the real dataset.
The code block below preprocesses the data calculates performance metrics for the LightGBM model using the synthetic dataset, and visualizes the predictions on a bar plot:
from sklearn.metrics import roc_auc_score, accuracy_score
import seaborn as sns
import matplotlib.pyplot as plt

X_syn, y_syn = prepare_xy(syn)
p_syn = model.predict(X_syn)
auc = roc_auc_score(y_syn, p_syn)
acc = accuracy_score(y_syn, (p_syn >= 0.5).astype(int))
probs_df = pd.concat([
    pd.Series(p_syn, name='probability').reset_index(drop=True),
    pd.Series(y_syn, name=target_col).reset_index(drop=True),
], axis=1)
fig = sns.displot(data=probs_df, x='probability', hue=target_col, bins=20, multiple="stack")
fig = plt.title(f"Accuracy: {acc:.1%}, AUC: {auc:.1%}", fontsize=20)
plt.show()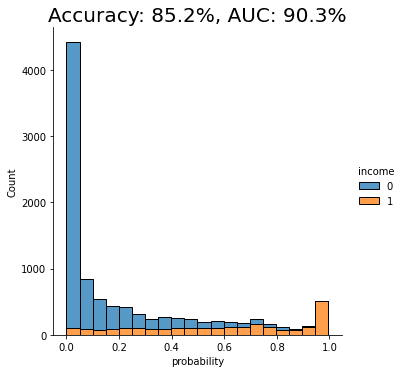
We see that the AUC score of the model on the synthetic dataset comes close to that of the original dataset, both around 91%. This is a good indication that our synthetic data is accurately modeling the statistical characteristics of the original dataset.
Explain ML Model using Synthetic Data
We will be using the SHAP library to perform our model explanation and validation: a state-of-the-art Python library for explainable AI. If you want to learn more about the library or explainable AI fundamentals in general, we recommend checking out the SHAP documentation and/or the Interpretable ML Book.
The important thing to note here is that from this point onwards, we no longer need access to the original data. Our machine-learning model has been trained on the original dataset but we will be explaining and inspecting it using the synthesized version of the dataset. This means that the auditing and explanation process can be shared with a wide range of stakeholders and communities without concerns about revealing privacy-sensitive information. This is the real value of using synthetic data in your explainable AI practice.
SHAP feature importance
Feature importances are a great first step in better understanding how a machine learning model arrives at its predictions. The resulting bar plots will indicate how much each feature in the dataset contributes to the model’s final prediction.
To start, you will need to import the SHAP library and calculate the so-called shap values. These values will be needed in all of the following model explanation steps.
# import library
import shap
# instantiate explainer and calculate shap values
explainer = shap.TreeExplainer(model)
shap_values = explainer.shap_values(X_syn)
You can then plot the feature importances for our trained model:
shap.initjs()
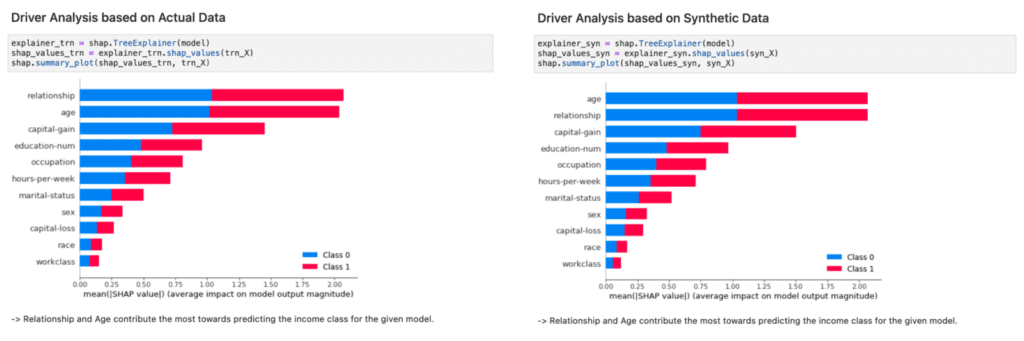
shap.summary_plot(shap_values, X_syn, plot_size=0.2)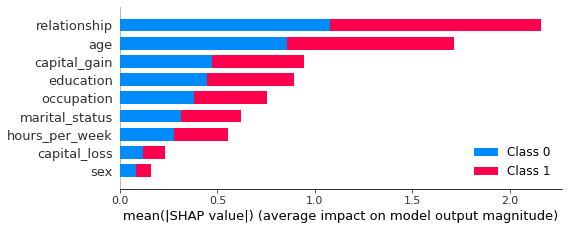
In this plot, we see clearly that both the relationship and age features contribute strongly to the model’s prediction. Perhaps surprisingly, the sex feature contributes the least strongly. This may be counterintuitive and, therefore, valuable information. Without this plot, stakeholders may draw their own (possibly incorrect) conclusions about the relative importance of the sex feature in predicting the income of respondents in the dataset.
SHAP dependency plots
To get even closer to explainable AI and to get an even more fine-grained understanding of how your machine learning model is making its predictions, let’s proceed to create dependency plots. Dependency plots tell us more about the effect that a single feature has on the ML model’s predictions.
A plot is generated for each feature, with all possible values of that feature on the x-axis and the corresponding shap value on the y-axis. The shap value is an indication of how much knowing the value of that particular feature affects the outcome of the model. For a more in-depth explanation of how shap values work, check out the SHAP documentation.
The code block below plots the dependency plots for all the predictor features in the dataset:
def plot_shap_dependency(col):
    col_idx = [
        i for i in range(X_syn.shape[1]) if X_syn.columns[i]==col][0]
    shp_vals = (
        pd.Series(shap_values[1][:,col_idx], name='shap_value'))
    col_vals = (
        X_syn.iloc[:,col_idx].reset_index(drop=True))
    df = pd.concat([shp_vals, col_vals], axis=1)
    if col_vals.dtype.name != 'category':
        q01 = df[col].quantile(0.01)
        q99 = df[col].quantile(0.99)
        df = df.loc[(df[col] >= q01) & (df[col] <= q99), :]
    else:
        sorted_cats = list(
            df.groupby(col)['shap_value'].mean().sort_values().index)
        df[col] = df[col].cat.reorder_categories(sorted_cats, ordered=True)
    fig, ax = plt.subplots(figsize=(8, 4))
    plt.ylim(-3.2, 3.2)
    plt.title(col)
    plt.xlabel('')
    if col_vals.dtype.name == 'category':
        plt.xticks(rotation = 90)
    ax.tick_params(axis='both', which='major', labelsize=8)
    ax.tick_params(axis='both', which='minor', labelsize=6)
    p1 = sns.lineplot(x=df[col], y=df['shap_value'], color='black').axhline(0, color='gray', alpha=1, lw=0.5)
    p2 = sns.scatterplot(x=df[col], y=df['shap_value'], alpha=0.1)

def plot_shap_dependencies():
    top_features = list(reversed(X_syn.columns[np.argsort(np.mean(np.abs(shap_values[1]), axis=0))]))
    for col in top_features:
        plot_shap_dependency(col)

plot_shap_dependencies()
Let’s take a closer look at the dependency plot for the relationship feature:
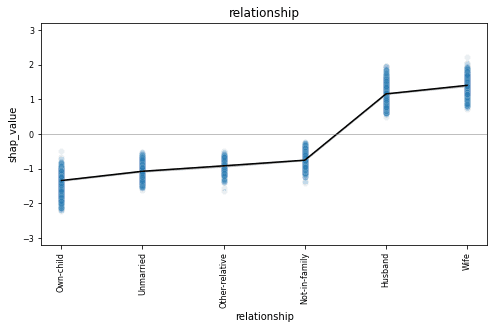
The relationship column is a categorical feature and we see all 6 possible values along the x-axis. The dependency plot shows clearly that records containing “husband” or “wife” as the relationship value are far more likely to be classified as high-income (positive shap value). The black line connects the average shap values for each relationship type, and the blue gradient is actually the shap value of each of the 10K data points in the dataset. This way, we also get a sense of the variation in the lift.
This becomes even more clear when we look at a feature with more discrete values, such as the age column.
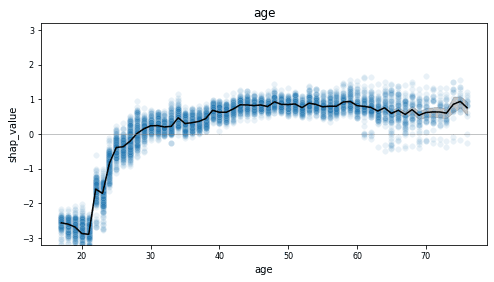
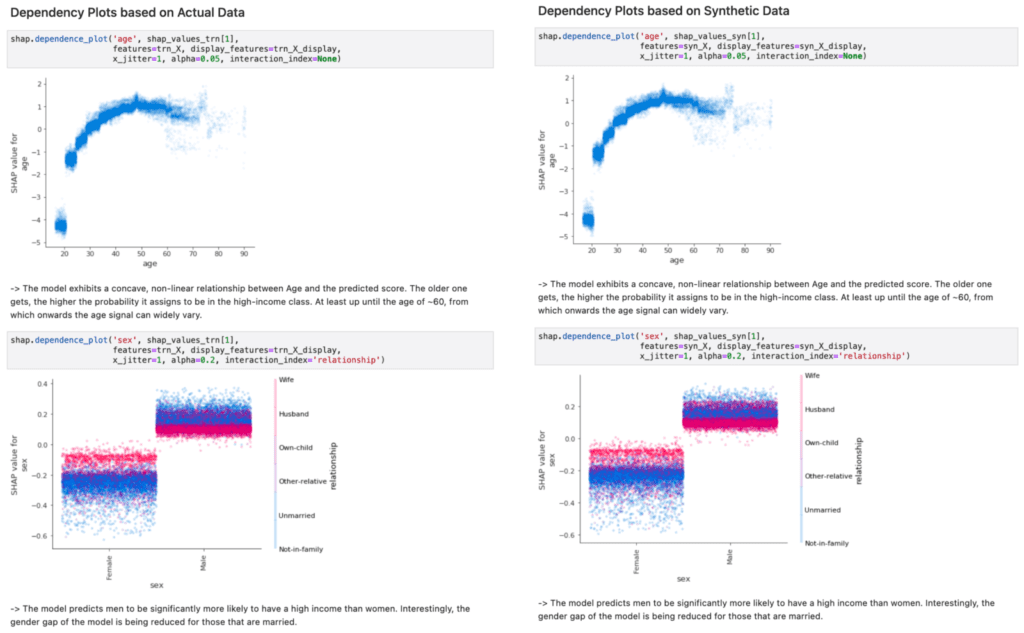
This dependency plot shows us that the likelihood of a record being high-income increases together with age. As the value of age decreases from 28 to 18, we see (on average) an increasingly lower chance of being high-income. From around 29 and above, we see an increasingly higher chance of being high-income, which stables out around 50. Notice the wide range of values once the value of age exceeds 60, indicating a large variance.
Go ahead and inspect the dependency plots for the other features on your own. What do you notice?
SHAP values for synthetic samples
The two model explanation methods you have just worked through aggregate their results over all the records in the dataset. But what if you are interested in digging even deeper down to uncover how the model arrives at specific individual predictions? This level of reasoning and inspection at the level of individual records would not be possible with the original real data, as this contains privacy-sensitive information and cannot be safely shared. Synthetic data ensures privacy protection and enables you to share model explanations and inspections at any scale. Explainable AI needs to be shareable and transparent - synthetic data is the key to this transparency.
Let’s start by looking at a random prediction:
# define function to inspect random prediction
def show_idx(i):
    shap.initjs()
    df = X_syn.iloc[i:i+1, :]
    df.insert(0, 'actual', y_syn.iloc[i])
    df.insert(1, 'score', p_syn[i])
    display(df)
    return shap.force_plot(explainer.expected_value[1], shap_values[1][i,:], X_syn.iloc[i,:], link="logit")

# inspect random prediction
rnd_idx = X_syn.sample().index[0]
show_idx(rnd_idx)
The output shows us a random record with an actual score of 0, meaning this is a low-income (<50K) record. The model scores all predictions with a value between 0 and 1, where 0 is a perfect low-income prediction and 1 is a perfect high-income prediction. For this sample, the model has given a prediction score of 0.17, which is quite close to the actual score. In the red-and-blue bars below the data table, we can see how different features contributed to this prediction. We can see that the values of the relationship and marital status pushed this sample towards a lower prediction score, whereas the education, occupation, capital_loss, and age features pushed for a slightly higher prediction score.
You can repeat this single-sample inspection method for specific types of samples, such as the sample with the lowest/highest prediction score:
idx = np.argsort(p_syn)[0]
show_idx(idx)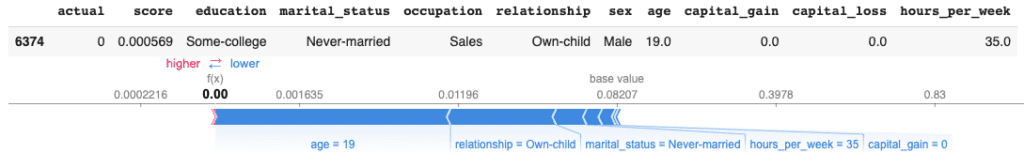
Or a sample with particular characteristics of interest, such as a young female doctorate under the age of 30:
idx = syn[
    (syn.education=='Doctorate')
    & (syn.sex=='Female')
    & (syn.age<=30)].sample().index[0]
show_idx(idx)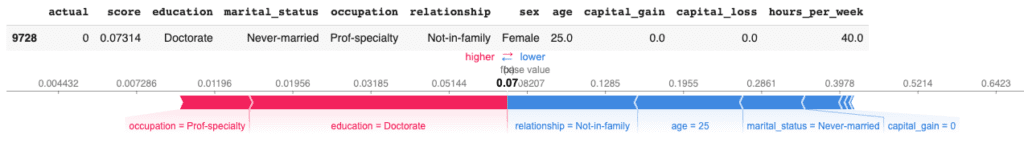
You can also zoom back out again to explore the shap values across a larger number of samples. For example, you can aggregate the shap values of 1,000 samples using the code below:
shap.initjs()
shap.force_plot(explainer.expected_value[1], shap_values[1][:1000,:], X.iloc[:1000,:], link="logit")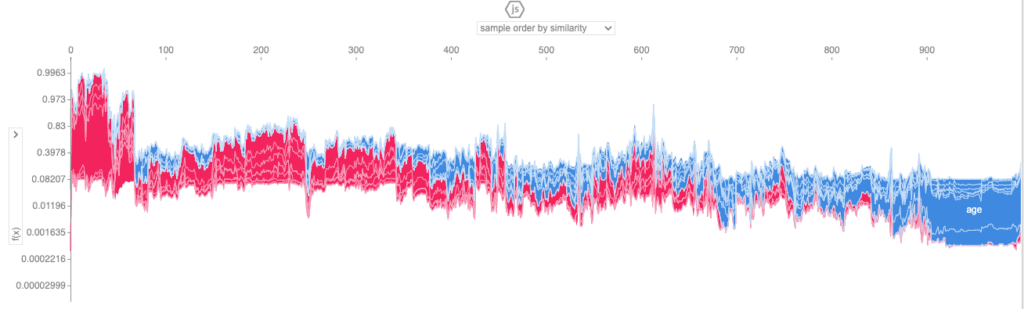
This view enables you to look through a larger number of samples and inspect the relative contributions of the predictor features to each individual sample.
Explainable AI with MOSTLY AI
In this tutorial, you have seen how machine learning models that have been trained on real data can be safely tested and explained with synthetic data. You have learned how to synthesize an original dataset using MOSTLY AI and how to use this synthetic dataset to inspect and explain the predictions of a machine learning model trained on the real data. Using the SHAP library, you have gained a better understanding of how the model arrives at its predictions and have even been able to inspect how this works for individual records, something that would not be safe to do with the privacy-sensitive original dataset.
Synthetic data ensures privacy protection and therefore enables you to share machine learning auditing and explanation processes with a significantly larger group of stakeholders. This is a key part of the explainable AI concept, enabling us to build safe and smart algorithms that have a significant impact on individuals' lives.
What’s next?
In addition to walking through the above instructions, we suggest experimenting with the following in order to get even more hands-on experience using synthetic data for explainable AI:
- replicate the explainability section with real data and compare results
- use a different dataset, eg. the UCI bank marketing dataset
- use a different ML model, eg. a RandomForest model
You can also head straight to the other synthetic data tutorials:
- Rebalancing your data for ML classification problems
- Optimize training size for synthetic data accuracy
- Evaluate synthetic data quality using downstream ML
AI algorithms require large volumes of up-to-date, high-quality training data to learn from. In many cases, the training data needs to be annotated by humans in order to help the machines make sense of it. However, in just as many cases, that very same training data should not or must not be provided to humans due to its privacy-sensitive nature.
This is particularly true when it comes to teaching machines to understand voice commands. For example, Amazon is reportedly employing thousands of workers across the world that continuously listen to Alexa conversations and transcribe and annotate their content. The fact that this made major headlines shows the increased sensitivity among the public towards this mass-scale sharing of personal data. Such practice, therefore, poses a severe regulatory and reputational risk for organizations.
But what options do exist for safely providing privacy-sensitive data for text annotation purposes? Encryption and monitoring certainly can’t prevent abuse, as in the end, it requires the annotators to access decrypted data again. Also, legacy data masking is known to have become largely ineffective to protect data due to the increased ease of re-identification. Thus, this calls for a truly privacy-preserving way to share granular-level, representative data at scale. This calls for synthetic text.
The need for data for AI training
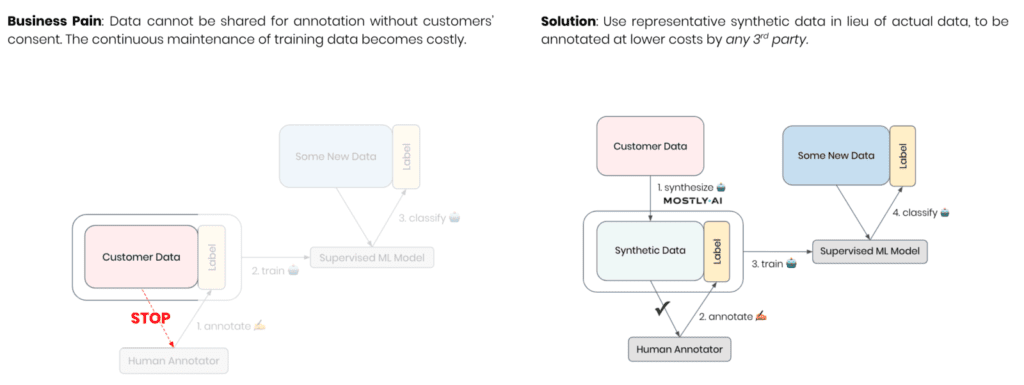
Let’s assume you are a leading organization that wants to provide voice interactions within your products or services. This will allow you to smartly react and adapt to your users and their voiced needs. The user experience of such functionality will depend on the algorithm’s ability to correctly detect users’ intent, which itself will rely on the availability of up-to-date, large-scale annotated training data. While it might be straightforward to get started on the AI journey with made-up data, the best data source is the actual commands voiced by the end users. However, these cannot be shared for annotation, at least not without explicit customers’ consent. Thus, the continuous maintenance of ground truth data for your algorithms becomes costly, dragging, and hard to scale across countries, languages, and dialects. The results will be felt by your customers, who remain misunderstood by your service and will start looking for smarter alternatives.
AI-generated synthetic data allows you to obtain an up-to-date statistical representation of your gathered customer interactions, which is not restricted and can be freely shared with annotators. This enables scaling the annotation process, both in data volume as well as data diversity, by collaborating with any 3rd party. The flexibility and agility of synthetic data will give you an edge in high-quality training data and ultimately an edge in a race to ever smarter products and services without putting the privacy of your customers at risk.
As-good-as-real synthetic text at the press of a button
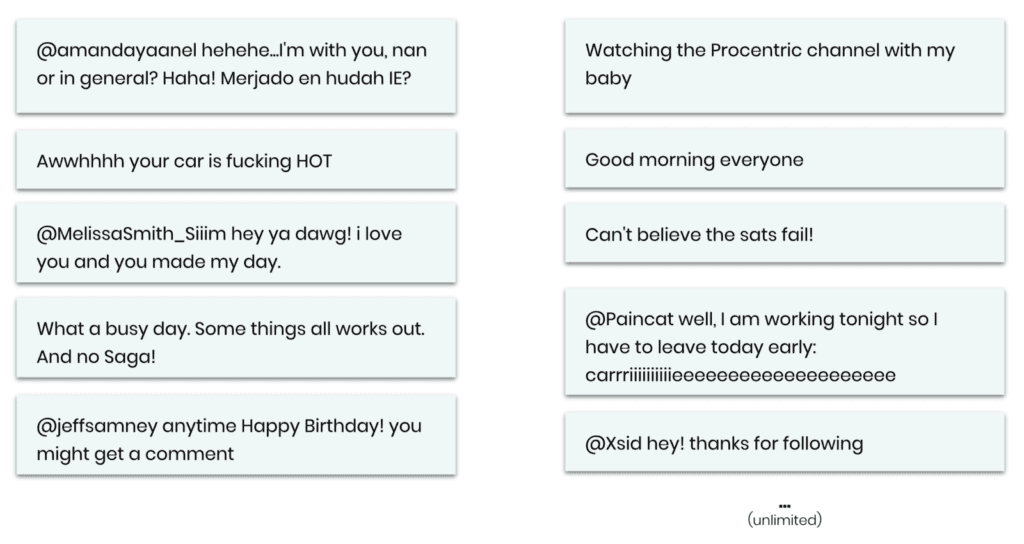
To demonstrate the efficiency of synthetic data for annotation, we will use a dataset of 1.6 million tweets [src] as our restricted customer data and consider the task of sentiment detection as our learning objective. So, let’s start out by taking a look at some of the actual messages that are contained in the dataset. And at the same time, let’s bring to our attention that this is the privacy-sensitive data that you or any of your colleagues are actually NOT supposed to look at.

Let’s then leverage MOSTLY AI’s category-leading synthetic data platform to create a statistical representation of the dataset. This provides you with an unlimited source of new unrestricted synthetic messages. This works for any language, any domain, and any content—with, as well as without, the additional context information on the user or the message itself.
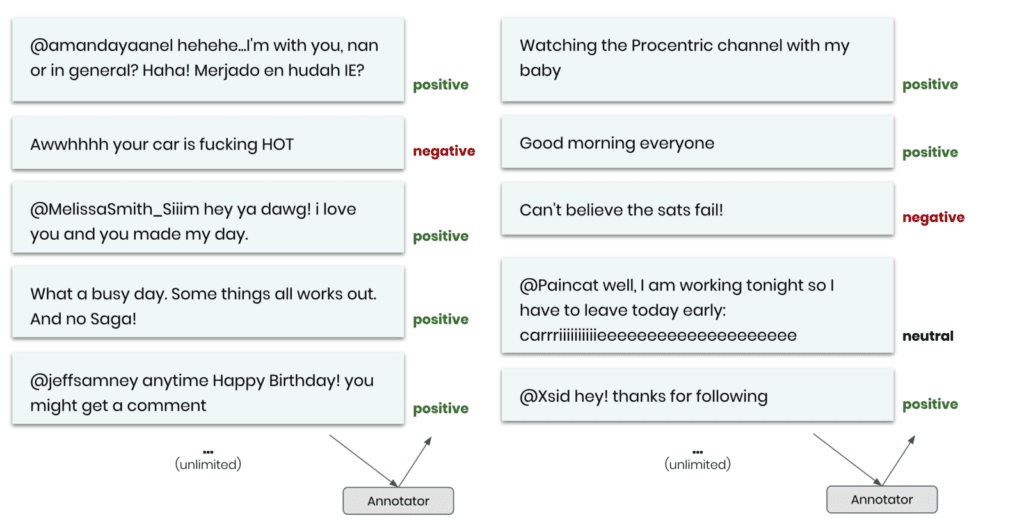
Simply studying, inspecting, and sharing these samples will tremendously help your whole organization to establish a deep understanding of your customers and how they interact with your services. But, further, these samples can now be shared with any number of annotators without risking anyone’s privacy. The key business question is then: Is the annotated synthetic data as good as the annotated original data when serving as training data for a supervised machine learning model?
As we don’t have human annotators readily available for our demonstration, we will make the case by using an existing sentiment classifier to perform the annotation. The task is then to train a downstream machine learning model that can correctly detect the sentiment for new and unseen data samples. We will thus measure our performance in terms of predictive accuracy on an annotated holdout dataset.
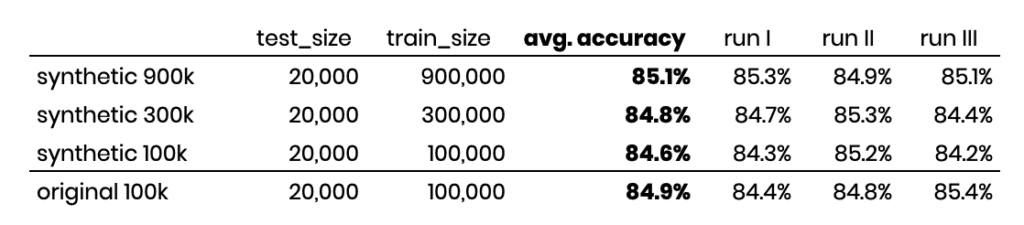
If we then train a capable text model on 100,000 annotated synthetic samples, we find an accuracy rate of 84.6% (measured for 20,000 actual holdout samples across three independent runs). This is nearly on par with the accuracy rate of 84.9% if we were to annotate the original, privacy-sensitive data. Thus, MOSTLY AI’s synthetic data serves as a privacy-safe alternative that doesn’t require giving up on high model accuracy. Even more, the ability to upsample, as well as to outsource annotation at lower costs, allows more training data to be annotated on a continuous basis, which ultimately results in even higher accuracy and thus better user experience.
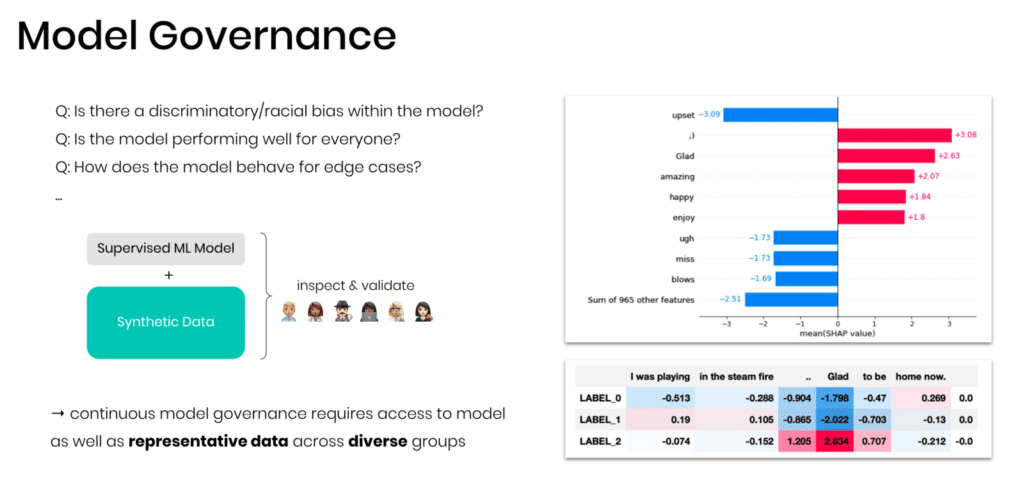
And an important side aspect is that the developed models can be inspected, validated, and governed with the help of synthetic data by anyone, including a diverse team of AI model validators. According to Gartner, these will play an increasingly important role in managing the AI risk within the enterprise. Synthetic data allows them to do exactly that but without being held back by privacy concerns.
Data privacy and data innovation can coexist
To conclude: Users expect smart services. Users expect to be understood. Yet, users expect that their privacy is not being sacrificed along the way. MOSTLY AI’s world-class synthetic data allows leading enterprises to achieve exactly that and make data protection and data innovation both work at the same time. Talk to us to learn more.
Have you missed the 6th Synthetic Data Meetup? Don't worry, an on-demand video of the event is here! Synthetic data is a game-changer for the simulation of residential energy demand. Watch the 6th Synthetic Data Meetup to learn more about important research our guest speaker, Max Kleinebrahm is working on at the Karlsruhe Institute of Technology, modeling residential energy systems using synthetic data!
What was the 6th Synthetic Data Meetup about?
Models simulating household energy demand based on occupant behavior have received increasing attention over the last years due to the need to better understand fundamental characteristics that shape residential energy.
In this Synthetic Data Meetup, hosted by Dr. Paul Tiwald, Head of Data Science at MOSTLY AI, we have presented deep learning methods ready to capture complex long-term relationships in occupant behavior that can provide high-quality synthetic behavioral data.
The generated synthetic dataset combines various advantages of individual empirically collected data sets and thus enables a better understanding of residential energy demand without collecting new data with great effort.
Our guest speaker was Max Kleinebrahm, Research Assistant at the Chair of Energy Economics at the Karlsruhe Institute of Technology in Germany. Max’s research interests are renewable energies, decentralized energy systems, energy self-sufficient residential buildings, and time series analysis of energy consumption and occupant behavior. In his PhD, he is investigating the dissemination of self-sufficient residential buildings in the future European energy system.
Play the Synthetic Data Meetup video to learn how household energy demand can be simulated with high-quality synthetic behavioral data!
Do you have a question? We are happy to talk synthetic data with you. Please feel free to contact us!
TL;DR AI governance requires access to models just as well as to data. However, in cases where the sensitive training data cannot be shared further, MOSTLY AI’s highly representative synthetic data serves as a drop-in replacement to enable model documentation, model validation, as well as model certification. These are key activities to establish trust in AI, particularly within industries, fundamentally dependent on the same people's trust they seek to serve.
The Importance of Explainability
With machine learning models being increasingly deployed for decision support within critical domains, such as finance, healthcare, or governmental services, the need to inspect, validate, and govern these algorithms rises just as well. This requires us, humans, to be in a position to understand models with respect to the what and the why. A quest that is commonly referred to as Explainable AI. The challenge is that the days of linear models or simple decision trees that are easily described and reasoned about are long counted. Nowadays, they are superseded by far more accurate, yet more complex learning algorithms that rely on large-scale training data to build their own model of the world together with its governing rules and relations. The consequence, however, is that no human being is capable of comprehending the complete decision boundaries of modern-day ML algorithms anymore, where ensemble methods and deep learning result in thousands, if not millions of model parameters. That certainly can’t mean that we shall give up on understanding the workings of an algorithm. The opposite is true. Anyone, independent of their technical background, should be able to “see” what drives a model decision so that we (as an individual, as an organization, as a society) can assess whether these indeed align with our intentions and value system. In fact, this is actually a historic opportunity to make decision processes transparent that otherwise have remained in the dark or were irrational, biased and inconsequent due to human judgment. And with growing regulatory pressure, and rising customer expectations, the wild wild west era of AI will come to an end, and Explainable AI will be a necessity for any organization soon.
Learning by Examples
So, how can these algorithms be made transparent to anyone? Given their complexity, neither disclosing the mathematical model, nor the implementation, nor the full training data will serve the purpose. Rather, it is easiest to learn about a system by observing as well as exploring its behavior. E.g., to gain an understanding of a sophisticated ML algorithm, one shall 1) observe its decisions across a variety of actual cases, and 2) explore its sensitivity with respect to modifications thereof. Particularly these what-if explorations help our understanding regarding what drives the decision of a model. This simple yet powerful concept of systematically exploring changes in model output given variations of input data is also referred to as local interpretability and can be performed domain- and model-agnostic at scale. I.e., the same principle can be applied to help us interpret credit scoring systems, sales demand forecasts, medical diagnostics, fraud detection systems, text classifiers, recommendation systems, and more.
One of the methods that popularized the approach is LIME, which stands for Local interpretable model-agnostic explanations. LIME has been quickly adopted since its introduction in 2016 by practitioners. Further enhanced methods, like SHAP and Anchors, continue to emerge, which all tremendously advance our understanding of how black-box models form their decisions. Yet, all of these approaches not only require access to the model but access to actual samples.
Demonstration
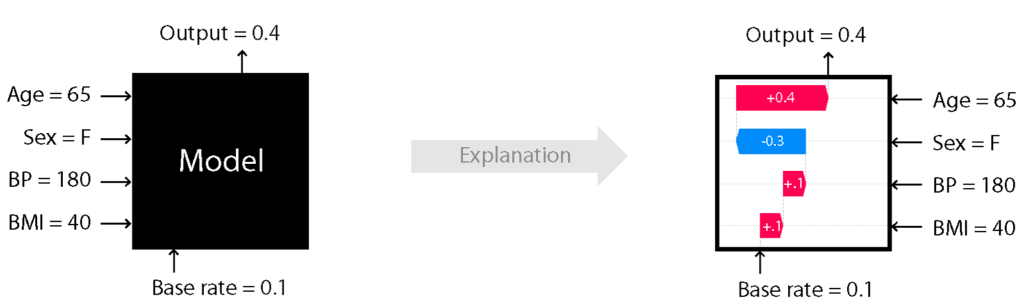
Let’s demonstrate the need for data for interpreting models with a concrete example of US Census income classification, taken from the excellent SHAP python package. In this example, a high-capacity machine learning model is trained on over 32’000 actual records to predict how likely individuals are or are not contained within the high-income class. That decision is based on 12 available attributes (occupation, gender, race, etc.), each contributing to the final model. While ML toolkits have made it increasingly easy to train powerful models that yield excellent predictive accuracy, they typically fall short in explaining how these models come up with their decisions. This is where approaches like SHAP step in that help interpret models.
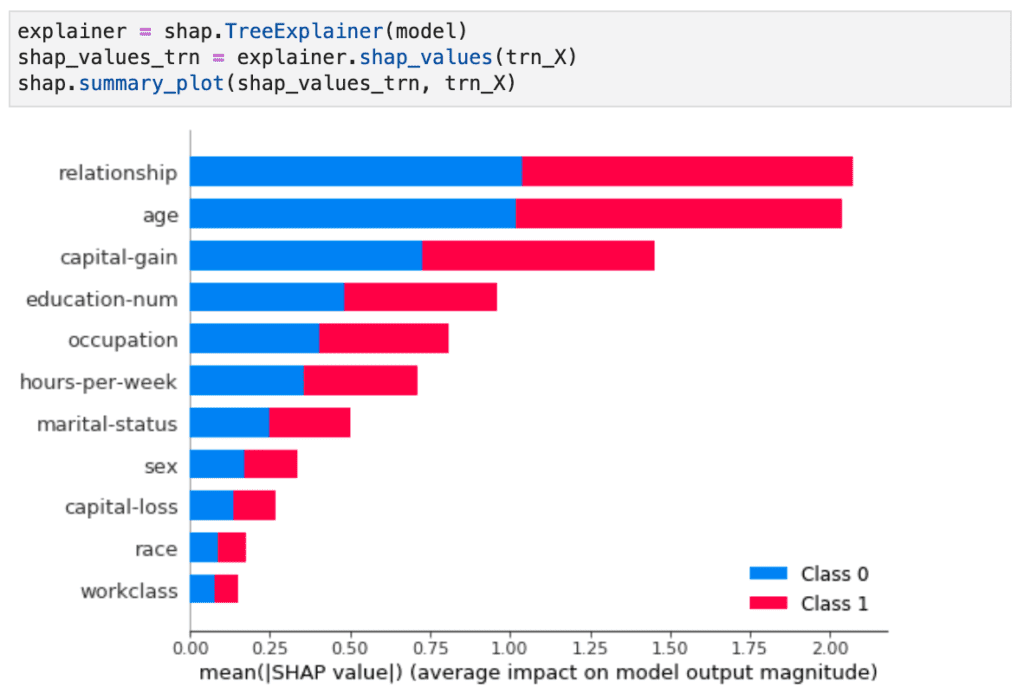
Figure 2 shows the basic workflow of instantiating a SHAP explainer within Python, by providing it with the model as well as the data. Or, to put it differently: no data → no explanations!
In the early days of ML adoption the model developers were also the ones who were tasked to interpret and validate “their” models. In these cases, the original training data is typically re-used for the explainer as well. However, with the significant real-world impact of deployed models on people’s lives, the development and the governance of AI models are increasingly separated to different teams, respectively to different organizations, like a certification body. Yet, this separation requires granular-level data to be shared, which due to the sensitivity of the underlying training data is oftentimes either too risky or outright forbidden. This is a fundamental barrier towards an urgently needed industry-wide adoption and enforcement of AI Governance. MOSTLY AI’s synthetic data to the rescue! As we’ve demonstrated before, it is highly representative and truly anonymous and serves as a drop-in replacement for actual data. As we’ll show in the following, not only to develop and test-drive ML models, but also to allow its behavior to be investigated for an unlimited amount of realistic and representative scenarios.
In Figure 3, we provide side-by-side comparisons of a range of model inspections. Once performed on top of the actual data used for model training on the left-hand side, and once performed on top of synthetic data on the right-hand side. As one can see, there is no notable difference between the results. And thus, the inspection, the documentation and the testing of models can be performed on top of MOSTLY AI’s synthetic data, within as well as across organizations, without putting the privacy of any actual customers at risk.
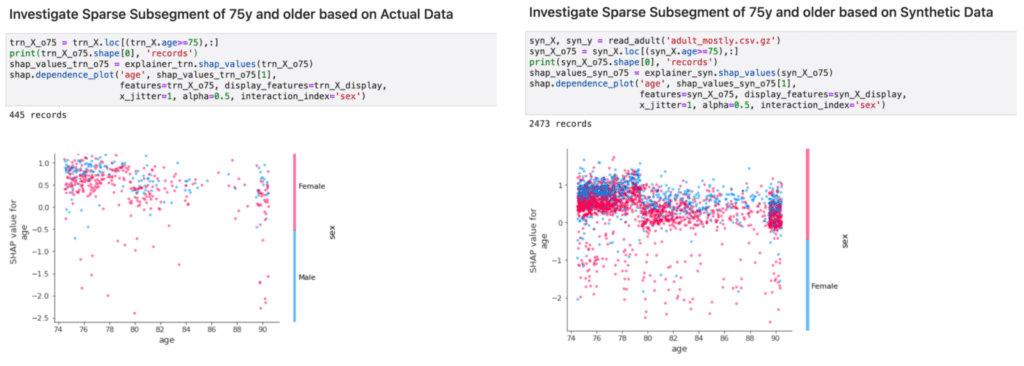
In addition, the ability to upsample, i.e., to generate an arbitrary amount of new representative records, allows to further inspect feature effects of the model on otherwise rare subsegments. This is of particular interest, as these minority groups are at risk of being overlooked due to their small population size. To strengthen that point, we demonstrate how the inspected model relates age and gender to the high-income category within the segment of 75 years and older citizens. Figure 4 shows that an upsampled synthetic dataset, that is 4 times larger than the original dataset, allows us to gather far more details on these otherwise small subsegments.
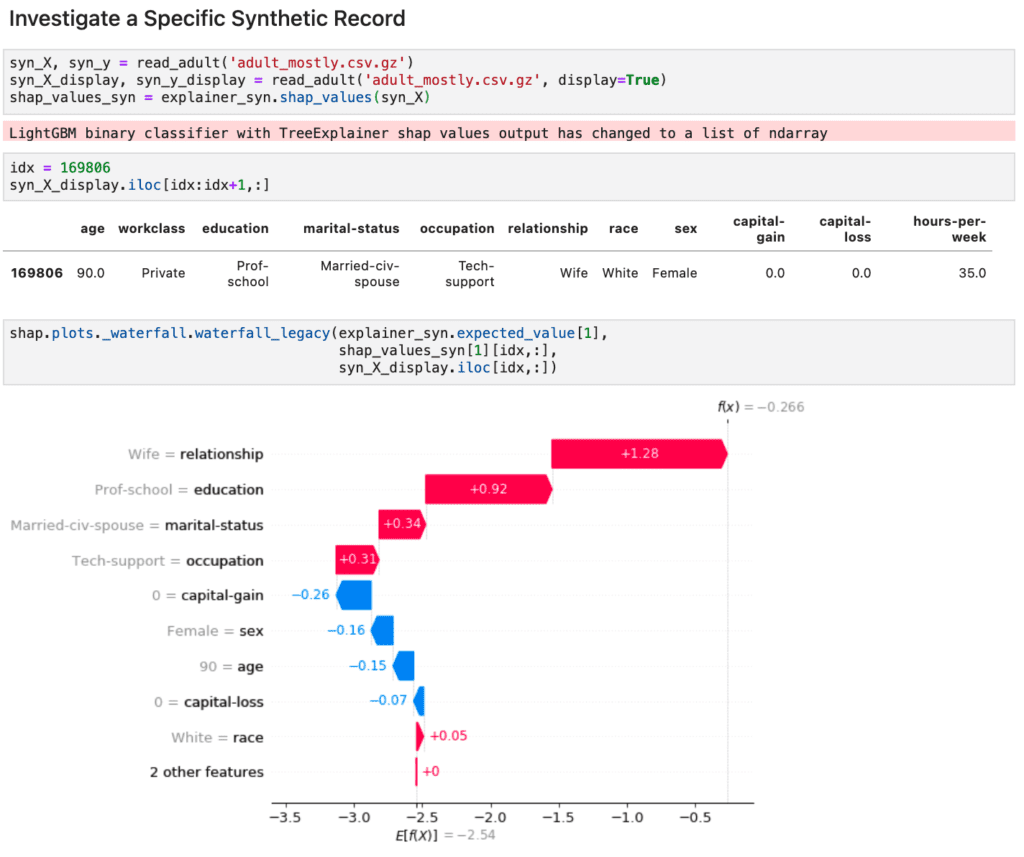
Finally, we can also inspect individual records with attribute combinations that didn’t necessarily exist within the provided original data. E.g., what if a 90 year old woman with the highest education level is still actively working? What type of score will the model provide in such a particular edge case that hasn’t been encountered yet as part of the model training? As shown in Figure 5, MOSTLY AI’s synthetic data also sheds light on these types of rare cases that are crucial to inspect to ensure a fair, responsible and robust AI to be deployed into production.
AI governance needs synthetic data
The need for AI governance is on the rise, yet it requires continuous access to typically highly sensitive data to be performed. We’ve demonstrated how MOSTLY AI’s world-leading and highly representative synthetic data serves as a perfect drop-in replacement for actual data to help interpret sophisticated ML models. This synthetic data enables our customers to participate in a much-needed collaborative cross-organizational AI ecosystem that spans from model developers through model testers to model validators. Going forward, we anticipate synthetic data to play a pivotal role in establishing transparency towards authorities, certification bodies as well as to customers - a major cornerstone of Ethical AI.
Curious to learn more? Please reach out to us to see how your organization can get started today!
At MOSTLY AI we take pride in offering the world’s most accurate synthetic data platform and that our AI-generated synthetic data is “as good as real”. It seems we might have been wrong on that one, and that it can be very well considered “better than real . The performance of machine learning models can be in fact improved by training on synthetic data in place of the real data. This is possible as the synthetic data helps these models to learn and understand patterns by 1) providing significantly more samples than otherwise available in the original data, and by 2) providing specifically more samples of any minority classes that would otherwise remain under-represented. Sounds too good to be true? Then read on!
So far, most of our customer use cases have focused on generating synthetic data to enable privacy-compliant data collaboration - whether that is across departments, across organizations, or across borders with internal and external partners. The generated synthetic data resembles the original data in shape and size, is statistically representative thereof, and yet fully anonymous. In other words, a dataset twin that can be freely utilized for any development, analytics, and machine learning tasks - without the otherwise privacy-related restrictions and risks attached.
But the benefits of synthetic data don’t stop there, and various other opportunities arise that we are genuinely excited about to explore further together with our most forward-thinking customers. While classic anonymization techniques are inherently destructive and seek to destroy information in an attempt to prevent re-identification, synthetic data generators are constructive by design. They are capable of creating new synthetic worlds from scratch, one data point at a time. These worlds can help to see and understand not only what is already happening, but also what could be possible, and thus can make analytics as well as any statistical models more robust and resilient.
While we’ve covered the aspects of privacy as well as fairness in previous blog posts, we will herewith focus on the benefits of amplifying as well as a rebalancing data to boost the predictive accuracy of downstream machine learning algorithms.
Generating More Training Data for Machine Learning
We start with a dataset of online shopping behavior, sourced from the UCI Machine Learning Repository. It consists of 12,330 sessions, each recorded with 17 features, and a binary target variable representing whether a purchase event took place or not. In total, only 1’908 (=15.5%) of the 12,330 sessions resulted in a transaction, and thus in revenues. The stated goal is to train a predictive model based on the available data that accurately estimates the purchase probability of a new customer session, based on the given 17 attributes.
To reliably assess the accuracy of the calculated purchase propensity scores, it is good practice to set a (randomly sampled) subset of the original data aside for the evaluation phase. This so-called holdout dataset must not be made available to the model’s training phase, as it is only used in a final step to calculate performance measures. These metrics then indicate how the models are likely to perform on new data going forward. The better the performance on the holdout dataset, the better the expected performance when deployed in production.
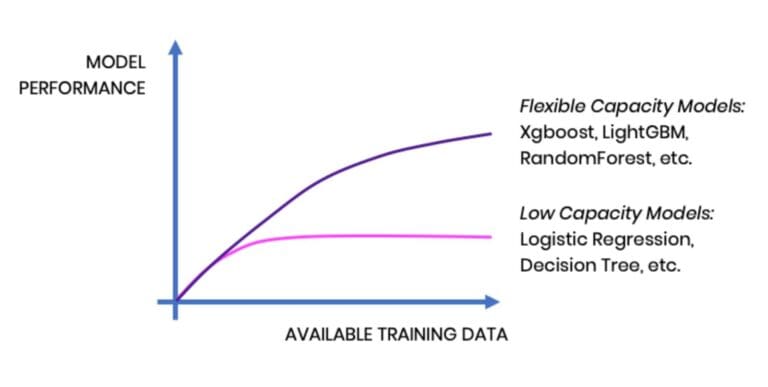
For predicting a single binary target variable based on a fixed set of features, a whole range of model classes is available nowadays. Logistic regression and decision trees remain popular, given their broad availability, fast computation, and easy interpretability. However, these models have a low and fixed model capacity and saturate quickly. In other words, they can’t get any smarter by feeding further training samples to them.
Modern ensemble models, on the other hand, like Random Forest, LightGBM, or XGBoost, have a flexible model capacity. They thus saturate at a much later point and do benefit from more training data becoming available. This is the reason for their state-of-the-art performance in numerous predictive tasks, as can be seen from open machine learning competitions like hosted on Kaggle. And thanks to open-source software implementations, these types of models are easily accessible and quickly gained in popularity over the last couple of years.
The idea is thus simple: By leveraging MOSTLY AI's synthetic data platform, we will create significantly more training data, and then benchmark downstream ML models that are trained on the synthetic data against the very same models trained on the original data. In both cases, the performance is evaluated on a true holdout dataset that was neither available for the training nor the synthesis.
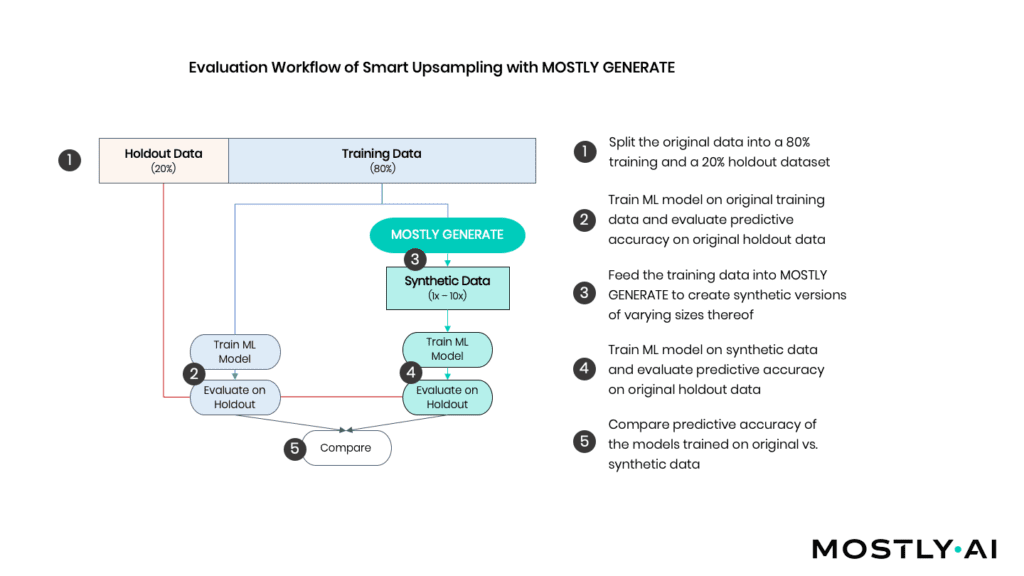
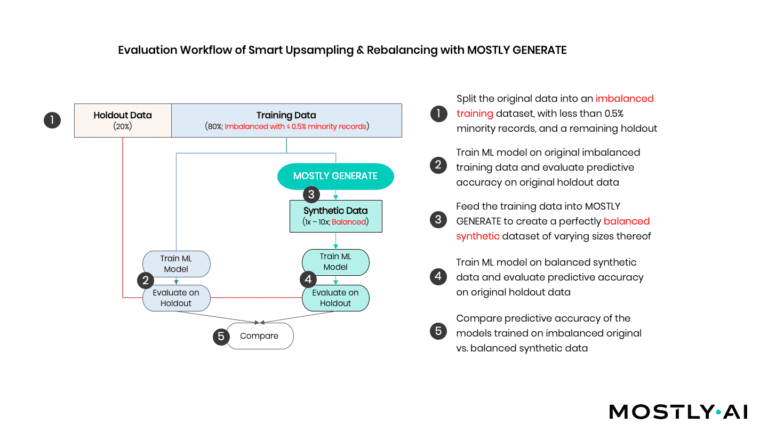
As depicted in Figure 2, we (1) start by randomly splitting the available sessions into an 80% training dataset (=9’864 records) and a 20% holdout dataset (=2’466 records). Various ML models are fitted to the training records that are then evaluated on the holdout (2). In addition, we use the training records to generate a synthetic dataset of 100’000 artificial records consisting of all 17 features and the target variable (3). Based on this amplified dataset, we train the same ML models and again evaluate against the holdout (4). Ultimately, we then compare the accuracy of the holdout of these distinct approaches (5).
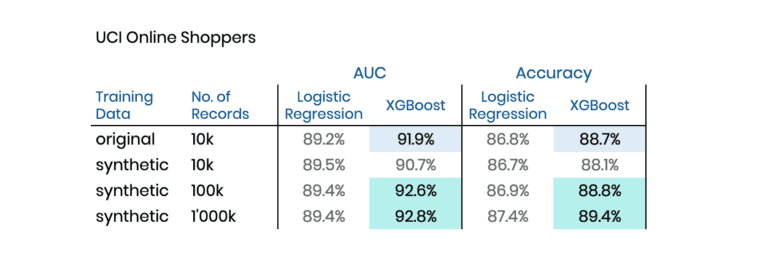
Table 1 reports the performance for two distinct and commonly used evaluation metrics, whereas higher values reflect better performance. And there you have it: Both models do perform better when trained on the (amplified) synthetic data than when trained on the original data! I.e., we are able to boost model performance by feeding it with synthetic data in place of the actual one.
Generating Balanced Training Data for Machine Learning
Next, we turn towards the demanding task of modeling heavily imbalanced datasets, which typically occurs whenever rare yet critical events, such as fraud, incidents, or diseases, need to be predicted. Even the aforementioned state-of-the-art algorithms can struggle in the presence of substantial class imbalances, as the crucial signals for the rare events can easily get drowned in a sea of other available data points.
Common simple heuristic approaches to handle class imbalances are to either downsample or the upsample the training data. The former simply discards samples from the so-called majority class, which effectively throws away available information to achieve class balance. And the latter would repeatedly add the same samples of the minority class multiple times, i.e., the same information is added redundantly. While, as we will see, this can be beneficial, it also increases the chances of memorizing the specific training subjects that are part of the minority class, which bears a significant privacy risk.
Again, the idea is simple. Instead of training on the original data, we will train our ML models on a synthetic, yet perfectly balanced dataset of significantly bigger volume. We will refer to this approach as “synthetic upsampling" (see Figure 3).
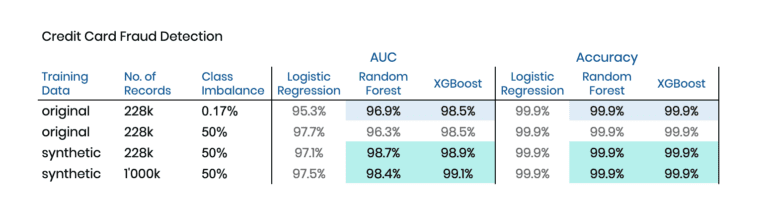
We start our empirical exploration with a dataset on Credit Card Fraud from a 2016 Kaggle competition, that is particularly challenging, as 1) only 0.17% of observations are fraud, and 2) nearly all of the 30 predictor features consist of non-interpretable, uncorrelated PCA (Principal Component Analysis) components. So, while there are 284’807 records in total, there are only 492 fraud cases to learn from. And since we are using 20% for holdout, that number gets even lower, making it even harder to detect patterns that help identify these few fraud cases reliably.
MOSTLY AI's synthetic data platform has the capability to conditionally create synthetic data, which allows us to control explicitly for how many fraud and non-fraud cases are to be generated. This makes it possible to create a perfectly balanced synthetic dataset of any size that we then use to train our downstream ML model on. Table 2 has the results of our experiments, which again show the boost in model performance by training on synthetic instead of the original data.
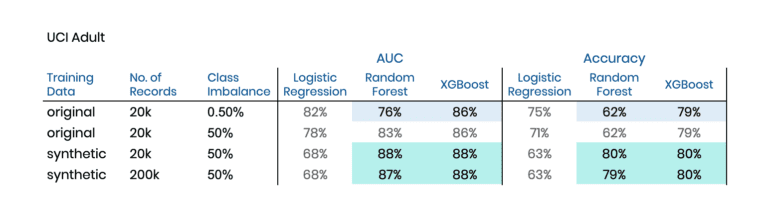
While these are encouraging results, we have to note that 1) the holdout dataset only had 115 fraud cases that could be used for evaluating the performance, and 2) that the overall predictive accuracy was already nearly perfect, and little was to be gained. Let’s, therefore, turn towards two further publicly available datasets, and let’s intentionally bias the training data so that we end up with an artificially imbalanced training data that has only 0.5% of minority cases. The advantage of this experimental setup is that there remain a significant number of “minority” cases within the holdout, making the evaluation measures more robust.
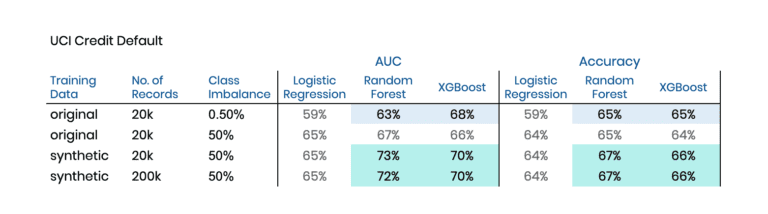
The two chosen datasets are the Adult dataset and the Credit Default dataset, both publicly available via the UCI Machine Learning Repository. Again we have binary prediction tasks at hand. In the former case, we will be predicting high-income citizens, based on 13 mixed-type features recorded for 48’842 subjects. And in the latter, the target is to predict a credit default event based on 23 features logged for 30’000 cases. In both cases, the biased training sample will be intentionally imbalanced, consisting of 19’900 majority cases and only 100 minority cases to learn and to synthesize from.
Table 3 and Table 4 contain the corresponding results of these explorations. And once again, we can see a significant lift by switching towards training on our AI-generated synthetic data. This lift occurs not only in comparison to the original data but also compared to an upsampled variant of the original data. For both datasets, the XGBoost model can be improved in terms of the area under the ROC curve (AUC) by two percentage points, and in terms of Accuracy by one percentage point. Further, it is interesting to note that the Random Forest model manages to get on par and even exceeds the performance of XGBoost when being trained on our balanced synthetic dataset.
Summary
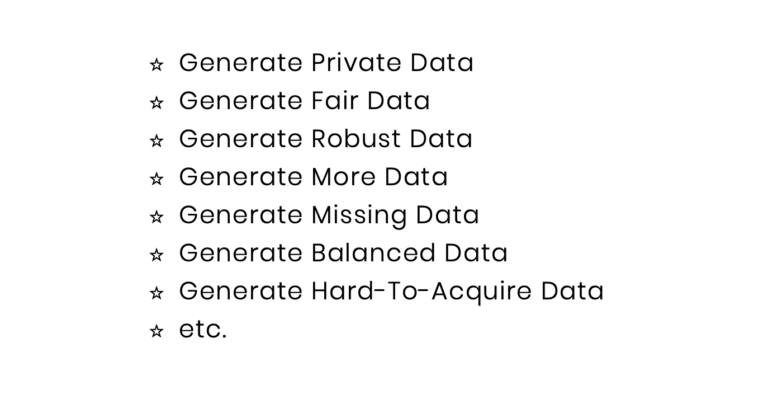
The availability of a sufficient amount of training data is critical for the success of any machine learning initiative. Yet sometimes it’s hard to get started, as initially, too little data might be available. Sometimes, it’s the most relevant cases that are missing in the historic data. Sometimes, it’s just too expensive or time-consuming to gather additional data points. As the explorations in this blog post have demonstrated, AI-generated synthetic data shows promise to support in all of these cases, which is why we are excited to explore these avenues further with our customers to help them succeed with their ML/AI initiatives, at a fraction of the time and at a fraction of the costs.
If you are currently involved in a ML/AI initiative within your organization, reach out to us to learn more - and embark on the exciting synthetic data journey today!
Intro
In part I of this mini-series we outlined the particular challenges for anonymizing behavioral data, and continued in part II with a first real-world case study on transactional e-commerce data. In this post, we will expand the study, present further sequential datasets, and demonstrate the unparalleled accuracy and thus utility of MOSTLY AI’s synthetic data platform for behavioral data. Its ability to retain the valuable statistical information finally allows organizations to meet privacy regulations (and customers’ expectations) and still reap the immense value of their behavioral data assets at scale.
Datasets
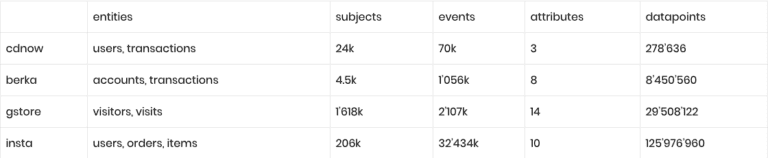
These are the datasets of our study:
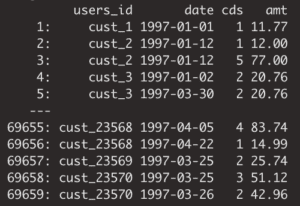
1. cdnow: 18-month of transaction records for CD purchases from a cohort of 23,570 customers. Each transaction contains information on the date of purchase, the number of CDs, as well as the total transaction amount. The dataset can be obtained from here
2. berka: This is one of the few freely available datasets on retail bank transactions. It has been released by a Czech bank for a machine learning competition in 1999, can be obtained from here, and consists of a bit over 1 million transactions with 6 attributes for a cohort of 4’500 bank customers.

3. gstore: This set contains Google Analytics 360 data and represents site traffic for the Google Merchandise online store. The original dataset can be obtained from here, and contains over 1.6 million visitors, together with 14 of their visit-specific attributes over a 26-month period.

4. insta: This Kaggle dataset consists of 3.2 million orders by over 200’00 grocery customers, with an average basket size of 10.1 items, ordering from a total assortment of 49’677 products across 21 grocery departments.

The following table summarizes the varying range of dataset sizes:
Bear in mind, that these are all drastically limited versions of the underlying real-world data assets. Many of the otherwise available attributes, on subject- as well as on item-level, were held back by data providers in order to anonymize the data. With synthetic data all of the originally available information could have been shared in a privacy-preserving manner.
For each of the four datasets, we used the latest enterprise version of MOSTLY AI's synthetic data platform to create corresponding synthetic versions thereof. With the click of a few buttons we generated hundreds of thousands of synthetic subjects and their data points. All of them being highly realistic, as well as statistically representative of the original data, but fully anonymous.
As we’ve made the case before, behavioral data is all about its inherent sequential structure. Just as a text loses its meaning when words are assembled in random order (see an example with the First Amendment of the US Constitution below), behavioral data loses its value if its composition, its consistency and coherence cannot be retained. Any data synthesization thus needs to ensure that not only representative events, but that representative subjects together with their representative events are being generated.
for freedom or for or of the respecting peaceably no right religion, abridging the make the law and to shall a the of speech, to exercise establishment or of people government grievances. or Congress redress of assemble, thereof; of the the press; an prohibiting petition
With that in mind, we will focus the analysis in this study on the valuable intertemporal relationships.
CDNOW
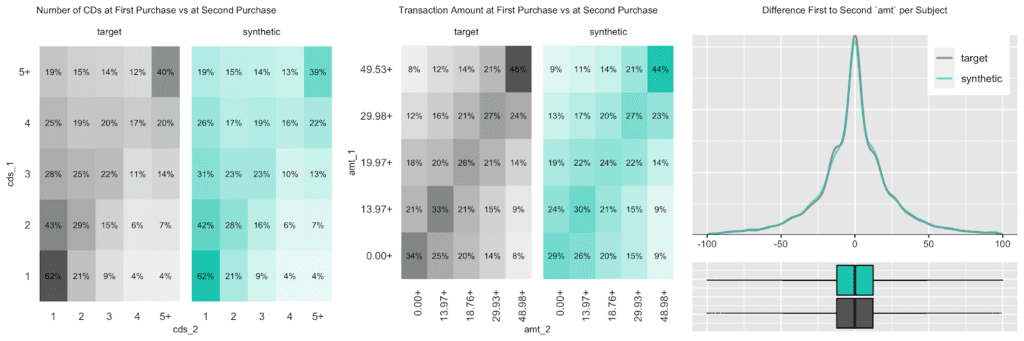
The customer base of this former online CD store exhibits a broad variety of behavioral patterns. While we have transactions range from zero dollars (presumably promotional offers) to over a thousand dollars, and from 1 to 99 CDs being purchased at a single time, one can expect that customers rather tend to be consistent, and that transactions by the same person are strongly correlated. I.e., a person making a high-value purchase once is likely to do so again. And indeed, as it turns out, this is the case, both when analyzing the original and when analyzing our artificially generated data. The following charts visualize these correlations, as well as the full distribution of the difference between a first and a second transaction amount, and how each of these statistics perfectly aligns between original and synthetic data.
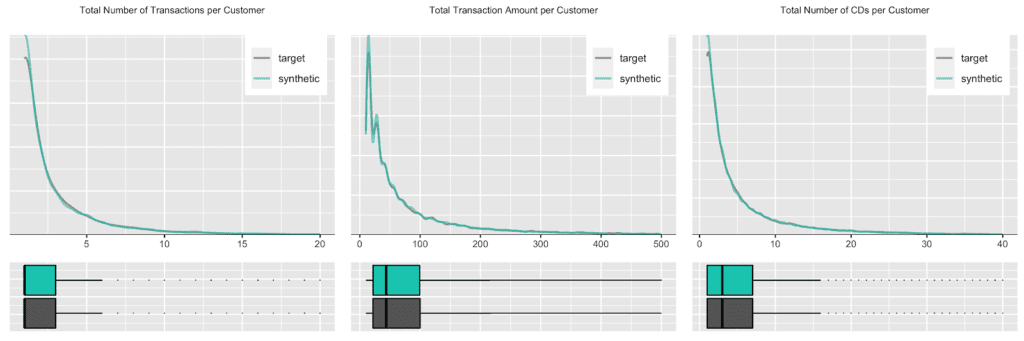
Due to this auto-correlation of succeeding transactions, it’s also common to observe a relatively small share of customers contribute to most of the total revenues of a company (and thus justifying different levels of acquisition and retention efforts). So, let’s validate this and move towards customer-level summary statistics, by aggregating over all the purchases for each customer. And indeed, in the presented dataset 20% of the most frequently buying customers of the actual cohort make up more than half (58%) of all transactions, and 20% of the most valuable customers contribute to 62% of all revenues. When querying the synthetic data, we can gain the same insights, with corresponding metrics being reported at 59% and 61% respectively. Yet, it’s not only single statistics but the full spectrum of these subject-level aggregates that is being accurately represented in the synthetic cohort, as can be seen in detail from the following plotted empirical distributions.
Next up, let’s investigate the share of customers that purchase a certain number of CDs, that had a given transaction amount spend, or that had a particular preceding inactivity period, at any one of their recorded transactions. E.g., while overall 45% of all transactions consisted of just a single CD, it is over two thirds (67%) of all customers that have had at least one single-CD purchase within their overall customer journey. Along the same line, it is 57% of customers that have exhibited a purchase hiatus longer than 135 days. Both statistics have been highlighted in the charts below, and show once again perfectly aligned results.
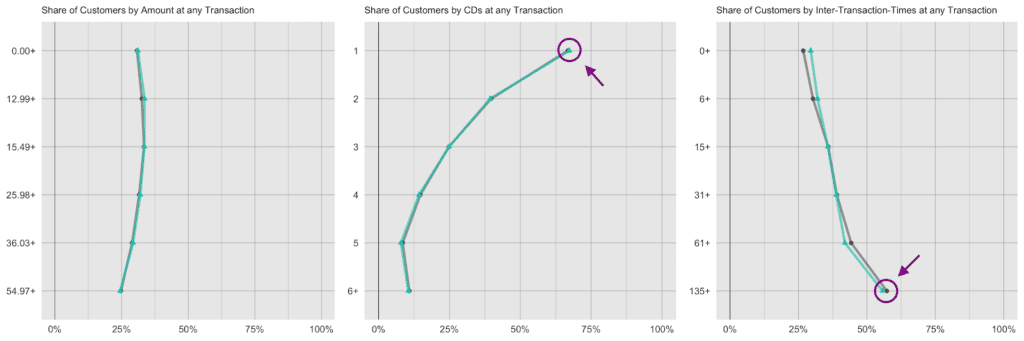
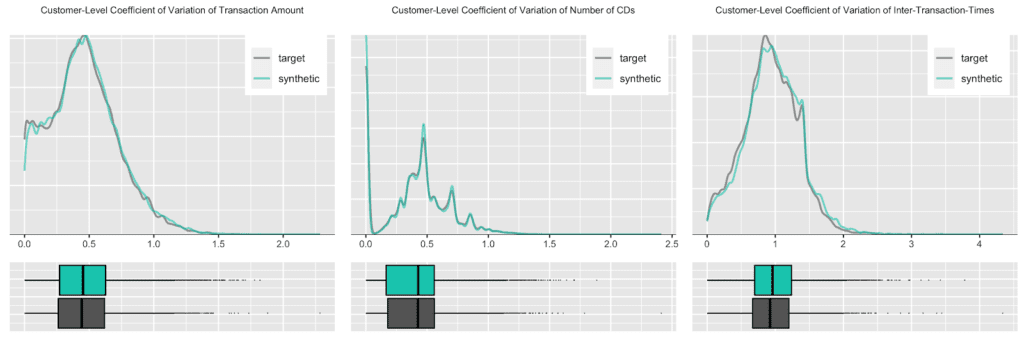
Further, let’s take yet another angle, and specifically, check for the consistency across all of the transactions of a customer. For that we will study the dispersion within attributes, and strengthen the test further by normalizing the standard deviation by its mean, resulting in the so-called coefficient of variation plotted below. In particular, the coefficient of variation for the intertransaction times being centered around 1 is an indication for exponentially distributed timing patterns. Once more, this same derived pattern can be seen for the actual as well as for the synthetic data.
In case your mind is boggling in the face of all these customer statistics, then don’t worry. The point that we are making here is that you can take any angle at the fully anonymous synthetic data in order to gain a deeper customer understanding, no matter whether it’s been anticipated or not before the actual synthesization process, and you will end up with highly aligned results.
BERKA
Our second case reflects a typical dataset structure within the finance industry. However, this publicly available set consists of only 4’500 accounts, while on the other hand each account has hundreds of data points. The challenge for a generic synthetic data solution thus is, to automatically extract generalizable relationships between all these data points based on a rather small sample.
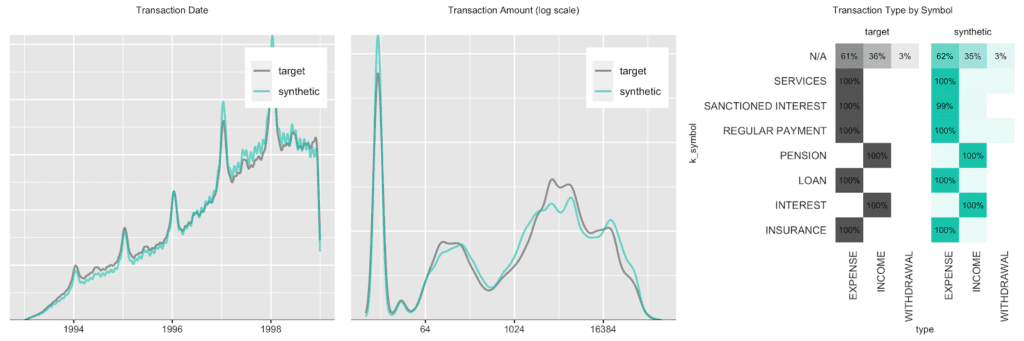
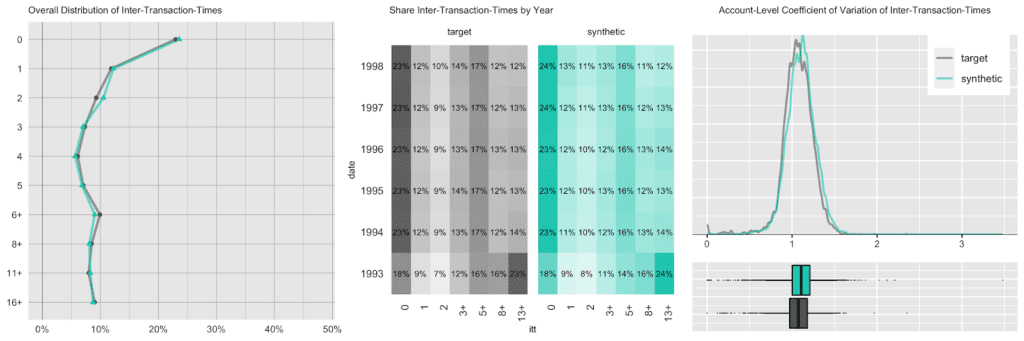
We start out with an overall transaction-level analysis to gain a basic understanding of the original and synthetic datasets, before we compare again subject-level (in this case account-level) statistics in more detail. Transactions are spread out across a period ranging from 1993 to 1998, with a steadily growing upward trend, coupled with a strong seasonal pattern at the beginning of each year, as well as increased activity at the end of each month. In addition, there are strong dependencies between the categorical attributes as shown by the heatmap.
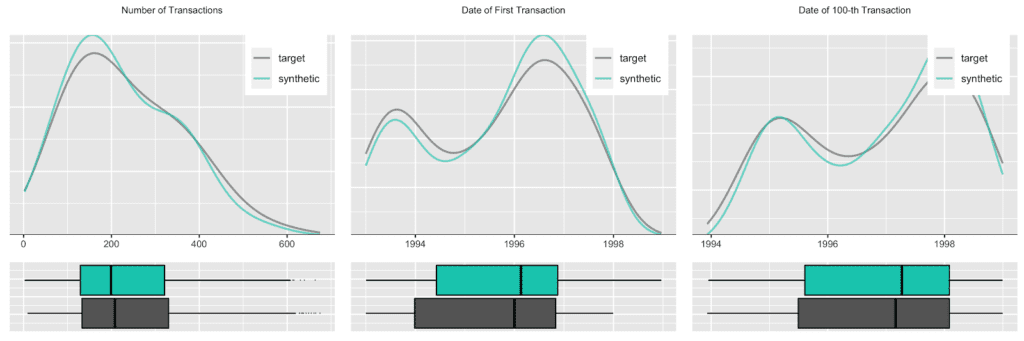
Accounts see a varying number of transactions, ranging from only a few up to 600 over the observed time period. Plotting the date of first transaction, i.e. the customer acquisition date, shows that the customer base has been steadily growing, with a particular strong year in 1996. Further, an analysis of the timing of the 100-th transaction remains consistent between the original and the synthetic data as well.
Next up we investigate the intertransacion times, which is a derived measure calculated as the elapsed number of days between two succeeding transactions. A value of 0 implies that a transaction has occurred on the same day as the previous transaction. The following charts take 3 different perspectives on this intertemporal metric. While, for example, overall a quarter of the transactions happened on the same date as a previous transaction, that pattern has been less pronounced in 1993, the initial year of the recording, as it had a significantly larger share of 13 days or longer periods of customer inactivity.
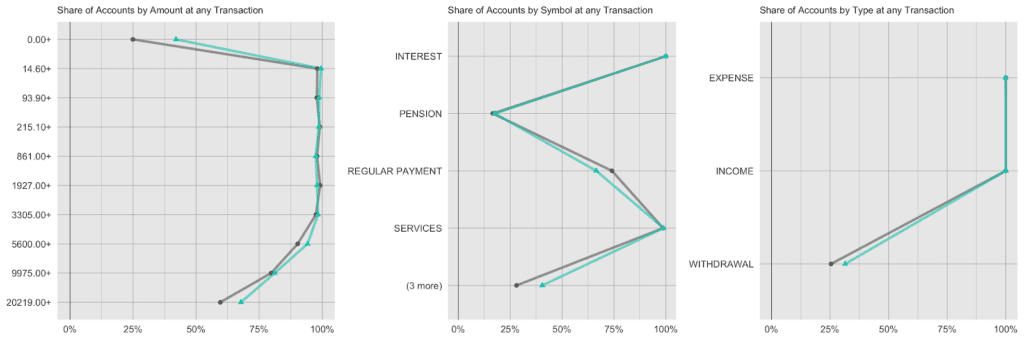
And lastly, we again look at the share of accounts that had a given amount/symbol/type at any of their transactions. E.g. while practically all accounts have had expenses and incomes recorded, the share of accounts with withdrawals is consistently low at around 25%, both for the real and the synthetic accounts.
GSTORE
It’s time to step up the game, and consider this online Merchandise store case with a significantly bigger population size, in this case, 1.6 million visitors, together with their visits. With this amount of data, the underlying generative deep neural network models of MOSTLY AI are able to fully leverage their capacity and retain information at a deeper level, as we will see next.
Visitors to the site are coming from over 200 different countries, with the US making up 40% of all visitors, India is second with a share of 7%, and UK, Canada, Germany follow the ranks. However, the exhibited behavior is distinctively different by country. US and Canadian visitors are the ones who are more likely to return multiple times to the site (20% likelihood vs. a 10% chance for the rest of the world) and are also the ones that actually end up making purchases at the store (as recorded by the attribute `transactionRevenue`). However, in that respect, a US visitor is still more than 3 times as likely to generate revenues than a Canadian visitor. Certainly a relevant insight for anyone looking to improve the store’s performance.
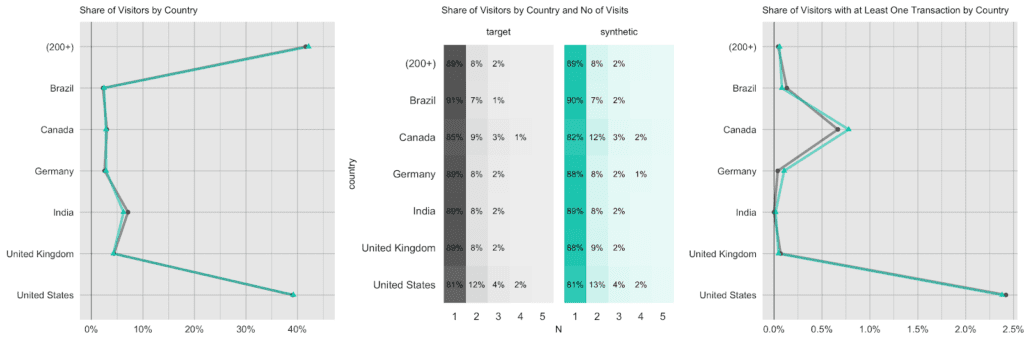
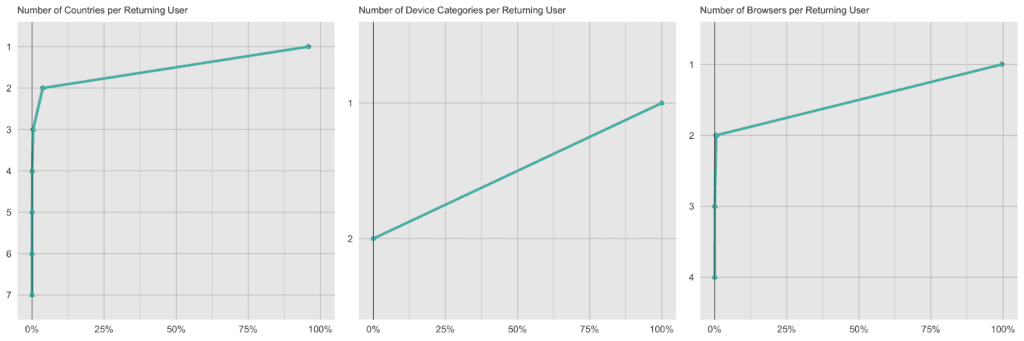
Each visitor is being identified in the dataset by a unique identifier. Typically, a visitor accesses the site with the same device, the same browser and within the same country, thus these attributes remain consistent across visits. However, there are exceptions to this rule, and we can detect these same exceptions again reliably in the synthetic data. 4.1% of returning visitors access the site from a different country, and 0.4% use a different browser in one of their later visits than they did in their first visit. For the synthetic data, these numbers are closely matched, with 4.4% and 0.6% each, i.e. it exhibits the same level of subject-level consistency over time as is present in original data.
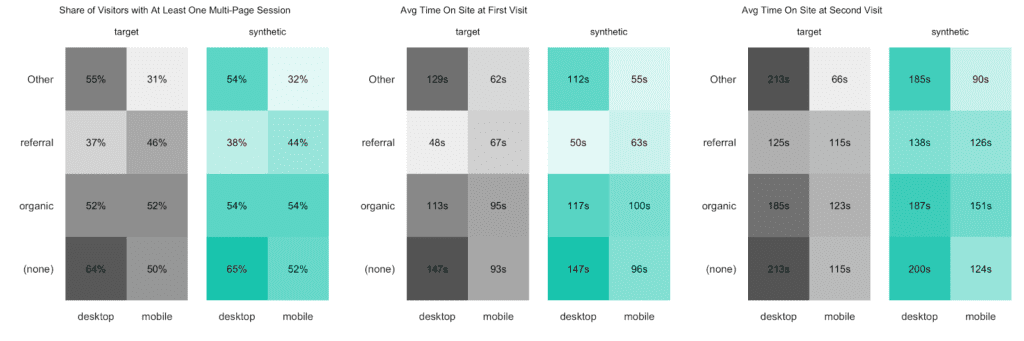
Finally, let’s dive even deeper into the data by cross-tabulating subject-level statistics by two categorical visit-level attributes. The following analysis indicates that the combination of the traffic source (of a visitor’s initial visit) and the device category is strongly, yet non-linearly related to the time spent on the site. While referrals result in shorter sessions for their first-time visit on the desktop than on the mobile, it is interestingly the other way around for organic traffic. For their second-time visit desktop users are then consistently spending more time on the site compared to mobile users. A non-trivial, yet persistent relationship worth investigating further.
INSTA
We will conclude our benchmark study with another large real-world dataset from the retail industry. This one consists of over 200k customers and their 32 million purchased product items.
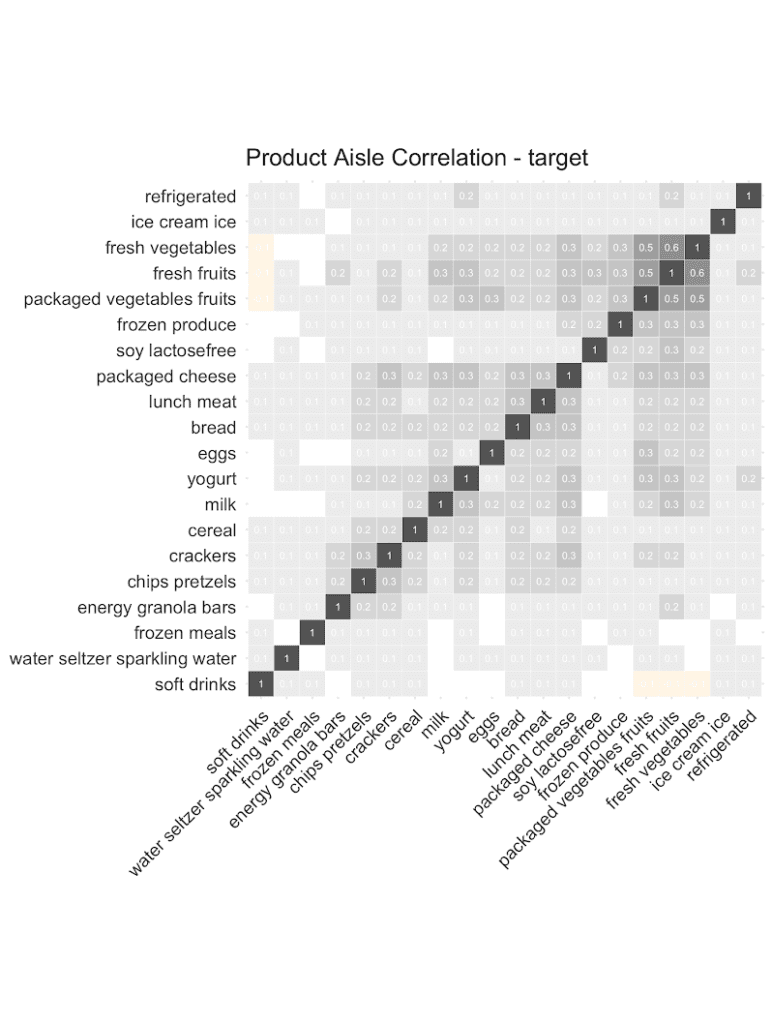
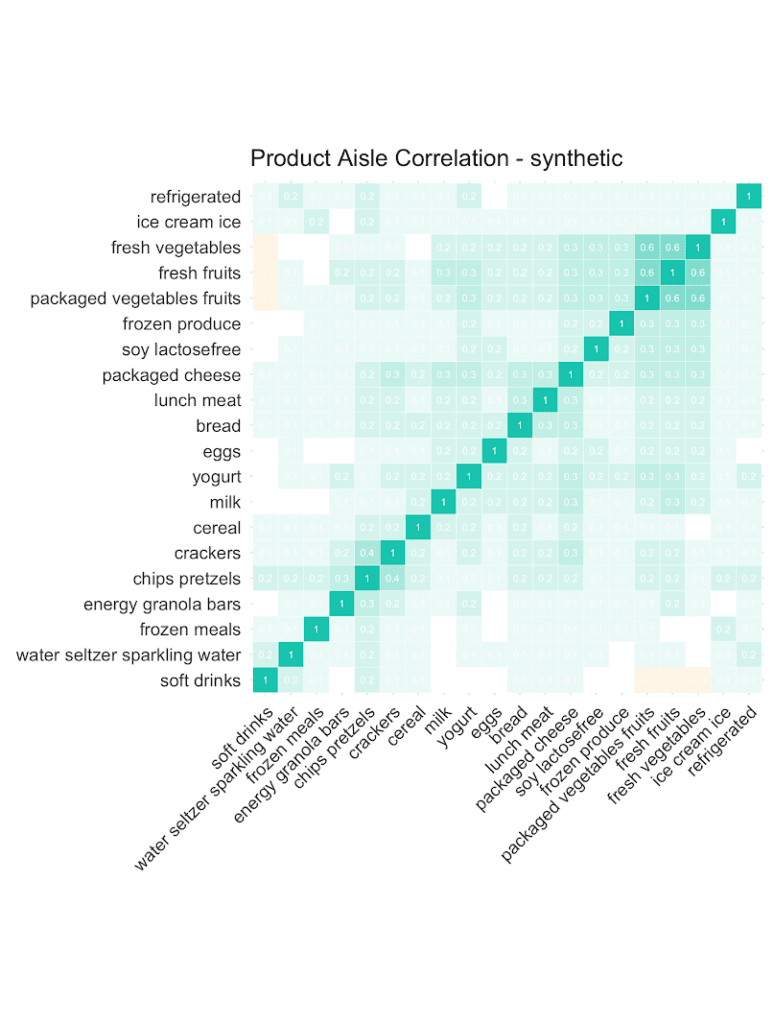
Let’s start out by checking the co-occurrences of popular product aisles: Purchases of chips are positively correlated with purchases of pretzels. And customers that buy fresh vegetables are more likely to add fresh fruits, and less likely to add soft drinks to their shopping list. And as can be seen from the following correlation plots, it’s the overall structure and relationships that are being very well retained in the synthetic data. This valuable information on basket compositions (in the context of a customer’s past purchase behavior) allows to build smart recommender systems that help users quickly add further items to their baskets, significantly improving their shopping experience. All possible in a fully privacy-preserving manner, with any internal teams or external partners developing these systems, thanks to our AI-based synthetic data solution.
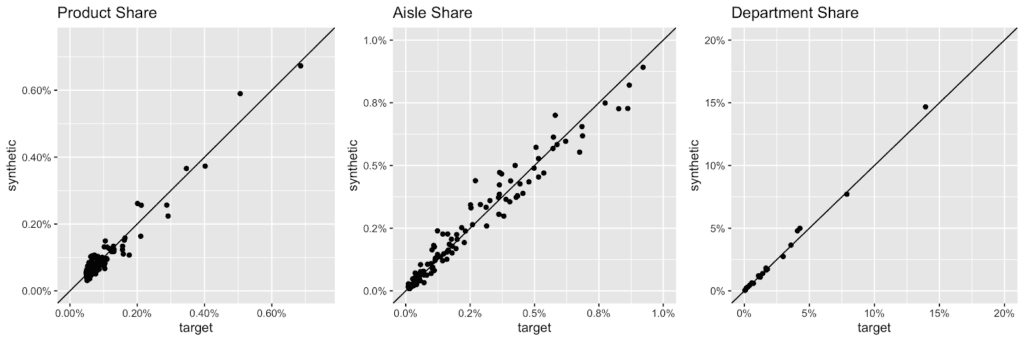
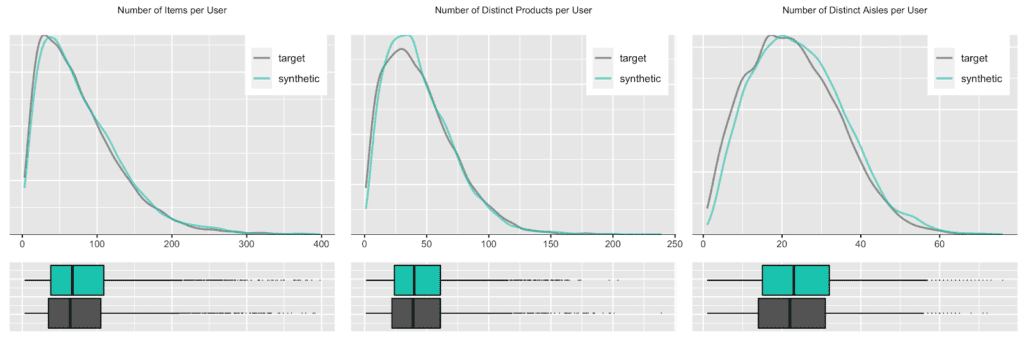
Overall, the grocery store has a very broad assortment with over 49’677 products across 134 aisles, and 21 departments being enlisted. Here are the actual and the synthetic shares of all products, of all aisles and of all departments plotted against each other.
But any given customer will only ever purchase from a small subset of the assortment, in particular as customers tend to repurchase the same items over and over again. Let’s thus check the distribution, in terms of number of distinct products and distinct product aisles being ever purchased by customers. And of course, as we are not just interested in an “average” customer, we will inspect the full distribution of these metrics, as visualized below. Once more, we can see a near-perfect alignment between the real world and our synthetic world. This is a particularly remarkable achievement, as the synthetic data generator needs to be aware of the complete product spectrum as well as the full purchase history when generating new synthetic orders, that are to be statistically representative and coherent.
Conclusions
This third blog post in our series on synthetic behavioral data turned out lengthy and technical, and contained lots (and lots and lots) of statistics. Thanks for bearing with us. But we intentionally wanted to go the extra mile to demonstrate the sheer power and unparalleled accuracy of MOSTLY AI's AI-powered synthetic data platform across a broad range of datasets. So, no matter whether your customer data is big or small, wide or tall, static or dynamic, numeric or categorical, our solution will be able to reliably pick up the patterns and provide you with a synthetic, statistically representative version thereof. One that captures all the value, and yet is fully anonymous, and thus unrestricted to utilize and leverage further.
Behavioral data is the new gold, but it requires more than a few people to make the most out of it. And yet, the era of privacy is here, and here to stay. So, reach out to us and learn more about how you can go synthetic, and become the superhero of your organization who can finally make both data sharing and data protection possible at the same time.
Credits: This work is supported by the "ICT of the Future” funding programme of the Austrian Federal Ministry for Climate Action, Environment, Energy, Mobility, Innovation and Technology.
Making The Case for Synthetic Behavioral Data
In the first part of this series, we’ve noted that only the most data-savvy organizations turn up on the winning side by knowing how to leverage their rapidly growing behavioral data assets. We further went on and identified two key obstacles for organizations to seize the arising opportunity:- Behavioral data is sequential, and thus complex to model and analyze.
- Behavioral data is privacy-sensitive and particularly difficult to anonymize. Thus it tends to be locked up.
Introducing the Dataset: CDNOW
In this blog post, we will work with the so-called CDNOW dataset, which represents purchase records of a former e-commerce site, that sold CDs online. The dataset contains the 18-month purchase history of a cohort of 23,570 customers, that the company acquired in the first quarter of 1997. As it’s one of the few publicly available, real-world transactional datasets, it has been extensively studied within the marketing literature and served as a canonical case study for developing behavioral models in non-contractual settings ([1], [2], [3], [4]). If you are interested, you can easily obtain the dataset as well via Bruce Hardie’s website.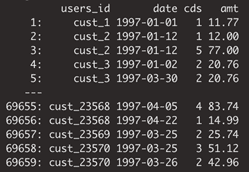
Poor Consumer Understanding Will Lead to Poor Business Decisions
These basic statistics already show that looking at the “Average Customer” does not reveal the looming problems of the e-commerce site, and don't reflect the full breadth of observable behavior in any customer base. Organizations that are truly interested in understanding their customers and their behaviors, and that wish to effectively address these, would rather ask questions like the following:- Which customers will come back?
- When will they come back?
- How often will they return?
- How much will they likely spend?
- Thus, what is their customer lifetime value going to be? (don't miss out on Pete Fader’s TEDx talk on customer-centricity)
- Does the very first purchase provide any indication of later actions?
- Are the most frequent customers the most valuable ones?
- At which particular dates are customers more active?
- Are weekend shoppers different from weekday shoppers?
- At which price points do specific customer groups like to act?
- How much time typically elapses between two purchases?
- Do customers come regularly or rather sporadically?
- And can we build predictive models based on these insights?
Generating a Synthetic Version of CDNOW


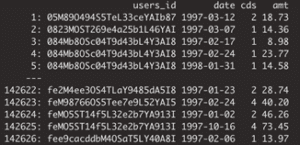
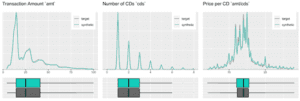

Synthetic Sequences Allow You to Draw the Same Conclusions As Real Ones

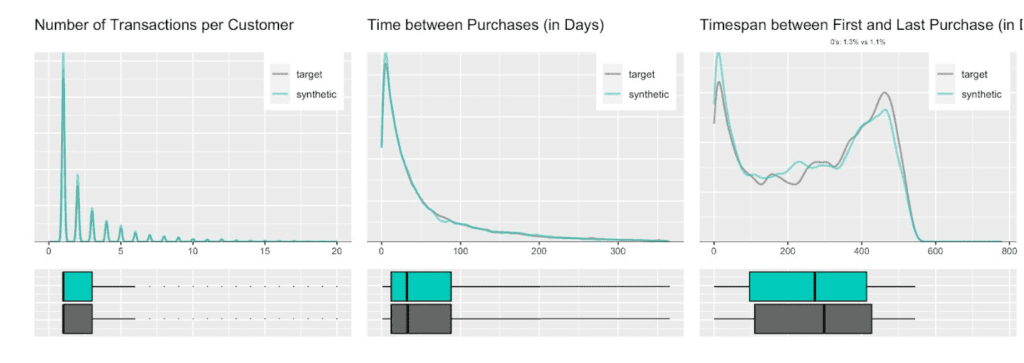
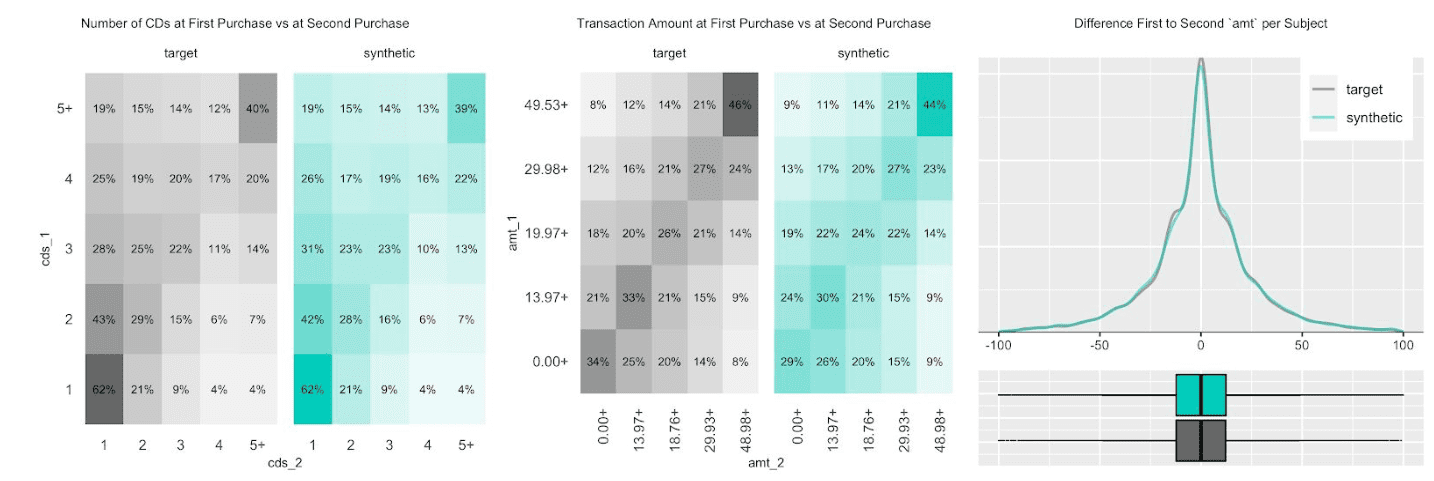
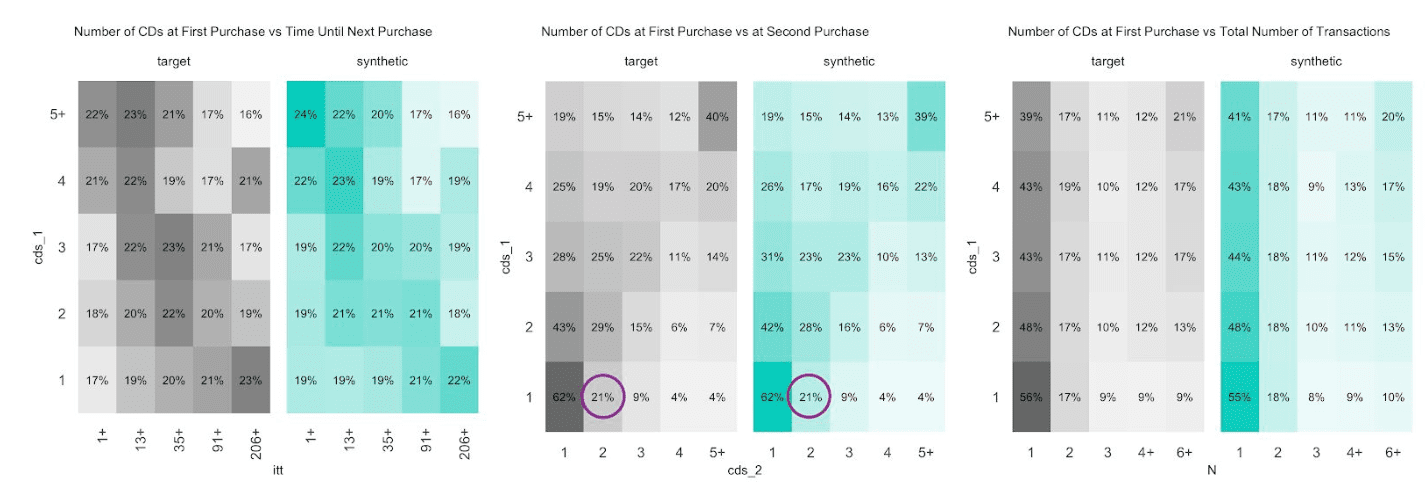
Fig 6. Various Distributions at Customer Level
Synthetic Predictions to Guide Business Decisions While Preserving Privacy
Let’s take this further, and do some predictive modeling on the individual customer level. We can, for example, easily fit the popular BG/NBD model (via the Buy-Till-You-Die R package) to a calibration period of 39 weeks of actual as well as of synthetic data, to see whether this yields comparable results. Note, that our generative model shares none of the intrinsic model assumptions of the BG/NBD model, but purely detects the patterns based on the empirical data. This being considered, it is even more impressive, that the four estimated BG/NBD parameters can be near perfectly recovered from the synthetic data, without ever seeing the actual data. The estimated purchase frequency, the estimated churn process, and their corresponding heterogeneity match closely. Thus, the models trained on synthetic data yield near-identical (and still very accurate) forecasts for the 39 week holdout period of actual consumer data (see figure 7 for further details).