Seeded generation
With seeded generation, you can create a new synthetic dataset that is conditioned on a seed dataset you provide. This is also known as conditional generation.
The seed dataset acts as context for the generation of the new synthetic dataset. With a seed dataset, you can define as context the columns, values, and their distributions that you want to use to conditionally generate the rest of the columns in the synthetic dataset.
The new synthetic dataset will still be statistically representative, but within the context of the seed dataset. The privacy of the new synthetic dataset then depends on the privacy of the provided seed.
A synthetic dataset generated with seed is partially synthetic.
- The columns in the seed dataset that you provide as context remain the same in the generated synthetic dataset.
- The rest of the columns (non-seed) are generated synthetically and are conditioned on the values in the seed dataset.
- If you use Personally Identifiable Information (PII) in the seed dataset, that information will be available “as-is” in the generated synthetic dataset. In such cases, treat the synthetic data with the same care you apply for personal data.
- The seed dataset is deleted immediately after the synthetic dataset is generated.
Generate a synthetic dataset with seed
For seeded generation, start a new synthetic dataset and provide a seed dataset.
Prerequisites
- A trained generator.
- A seed dataset with the characteristics listed below.
- The seed column names must match those in the table used for generator training.
- Seed categorical columns must contain the same categories as in the dataset used for training. For example,
FemaleandMalecategories in asexcolumn must match exactly the ones used for training. - Bear in mind that conditionally-generated numeric and datetime values are kept within the range of the original data. For example, if the column
ageranges between18and80in the original data, age15in a seed dataset will be clipped to18in the conditionally-generated data.
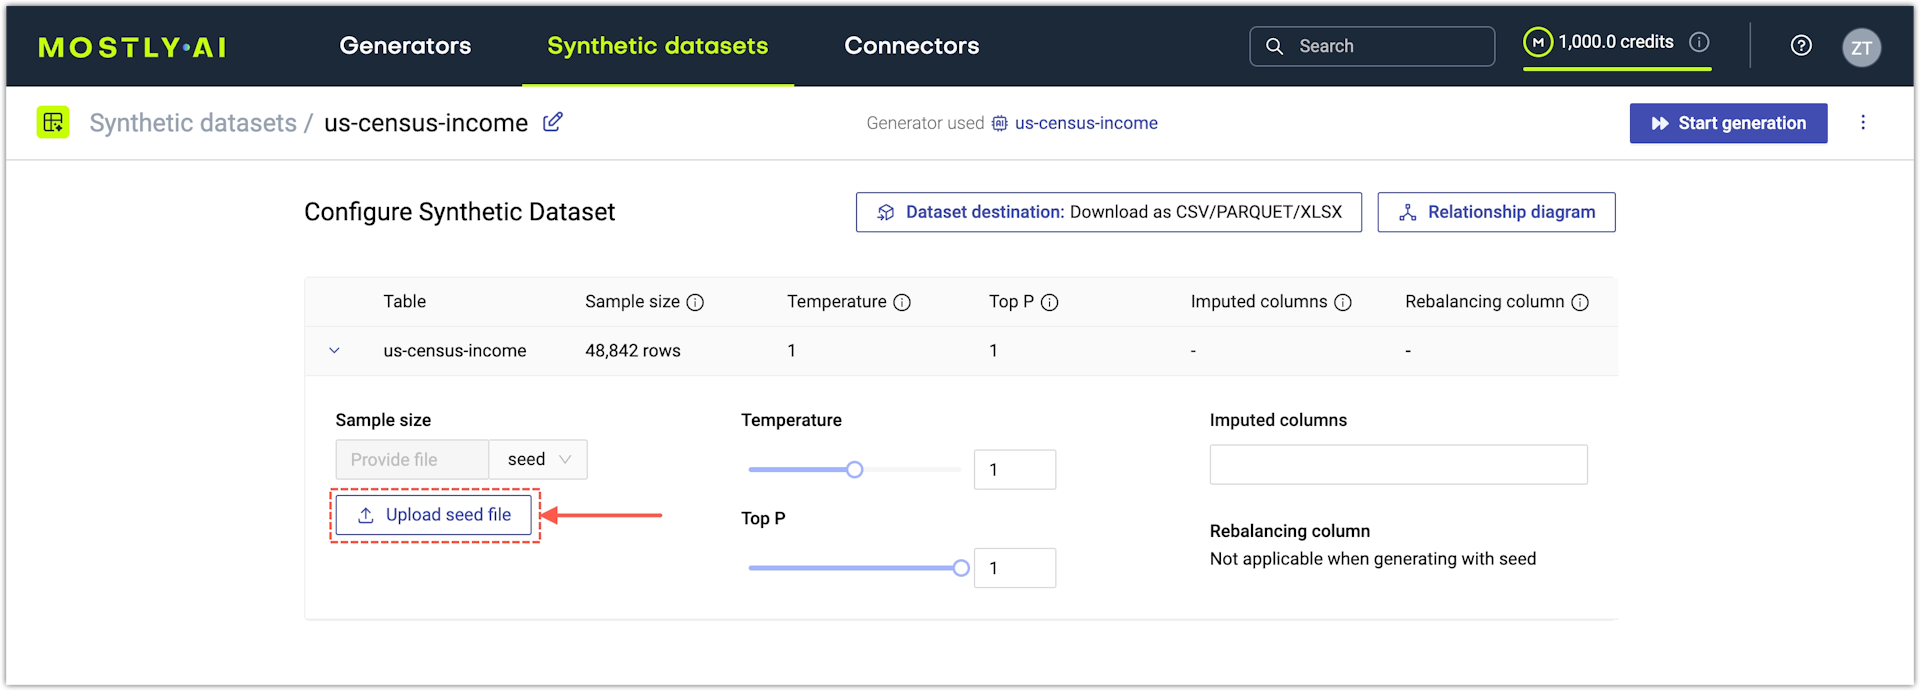
If you use the web application, you can upload a seed dataset from the Sample size options after you start a new synthetic dataset.
- Start a new synthetic dataset.
- On the Synthetic dataset configuration page, expand the subject table.
- Expand Conditional generation.
- Click Choose file.
- (Optional) Adjust the rest of the generation settings.
- Click Start generation in the upper right.
Examples
The three examples below showcase what you can achieve with seeded generation.
The examples below are also available as a Jupyter Notebook. You can also find it in our Tutorials section.
- Perform multi-column dataset rebalancing. You create a seed dataset with two columns that have a new distribution. You then use the seed for conditional generation and see how the rest of the columns are impacted by the rebalancing.
- Generate partially synhetic geo data. Use the original geographical coordinates from the original training dataset to generate the remaining columns as synthetic data.
- Generate synthetic names. Train a generator on the [baseball/players] table and generate the first names and last names of baseball players by using a seed dataset that contains the country of origin of the players.
Rebalance datasets with seeded generation
In this example, you learn how to rebalance the US Census dataset with seed generation, where the seed dataset contains an equal distribution of females and males and an uncorrelated income attribute. The goal is to remove the gender gap and see how the rest of the attributes in the original dataset change in the generated synthetic dataset.
The information below provides a sequence of steps with an explanation of each step. You can use the code snippets in a Jupyter Notebook and adjust them as you see fit.
Prerequistes
To reproduce this example, you need the following Python packages.
To install in a Jupyter Notebook environment, use the following:
!pip install mostlyai pandas numpy matplotlibSteps
- Import the Python packages needed for this example.
python
from mostlyai.sdk import MostlyAI import pandas as pd import numpy as np - Get an API key and instantiate the Python SDK. For details, see here.
python
mostly = MostlyAI(api_key="INSERT_API_KEY") - Train a generator on the US Adult dataset or get an existing one.
- Train a new generator.
python
df = pd.read_csv('http://mostly.ai/docs/datasets/us-census-income.csv.gz') g = mostly.train(data=df, name="Tutorial Seeded Generation - US Census") - Get an existing generator trained on the US Adult dataset.
python
g = mostly.generators.get("INSERT_GENERATOR_ID")
- Train a new generator.
- Create a seed dataset.
Create the seed dataset with a Pandas DataFrame. Use NumPy to randomly generate the seed values.
For thesexattribute, you create a 50/50 split betweenMaleandFemale.
For theincomeattribute, you keep the share of low- and high-income earners constant. However, you can see how you can randomize between men and women, effectively removing the gender income gap.pythonnp.random.seed(1) n = 48_842 # generate the same number of records as in the original dataset p_inc = (df.income=='>50K').mean() # get the probability of the high-income category seed = pd.DataFrame({ 'sex': np.random.choice(['Male', 'Female'], n, p=[.5, .5]), # generate 50/50 split between Females and Males 'income': np.random.choice(['<=50K', '>50K'], n, p=[1-p_inc, p_inc]), # generate income categories based on the probabilities of the original dataset }) - Generate a rebalanced dataset with the seed dataset as context.
python
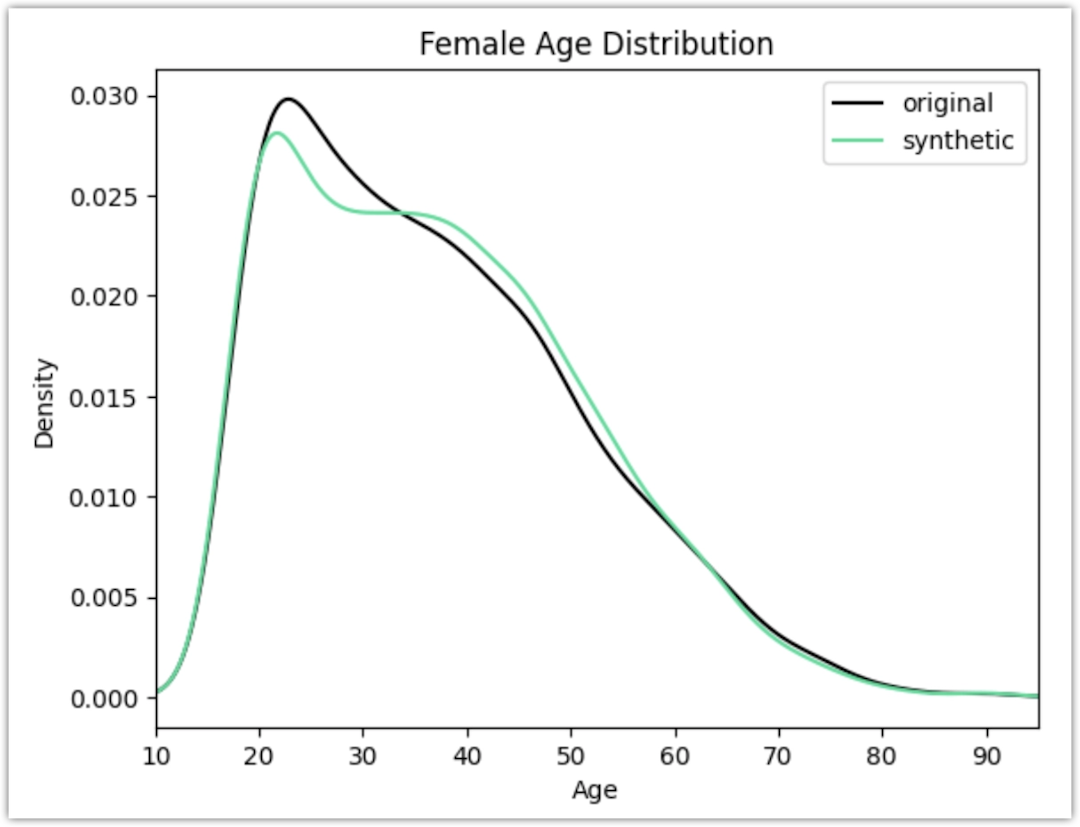
sd = mostly.generate(generator=g, seed=seed) - Use Matplotlib to compare the age distribution of records from the original vs rebalanced dataset.
python
import matplotlib.pyplot as plt
plt.xlim(10, 95)
plt.title('Female Age Distribution')
plt.xlabel('Age')
df[df.sex=='Female'].age.plot.kde(color='black', bw_method=0.2)
syn[syn.sex=='Female'].age.plot.kde(color='#24db96', bw_method=0.2)
plt.legend({'original': 'black', 'synthetic': '#24db96'})
plt.show()
To meet the criteria of removing the gender income gap, the generated synthetic records for women are now significantly older as shown in the chart.
You can explore other shifts in the distributions that are generated as a consequence of the provided seed data.
Generate partially synthetic geographical data
For this use case, you will be using 2019 AirBnB listings for Manhattan. The dataset consists of 48,895 records, and 10 mixed-type columns, with two of those representing the latitude and longitude of the listing. You will use this dataset to create synthetic attributes for all the actual locations, that were contained in the original.
Prerequistes
To reproduce this example, you need the following Python packages.
To install in a Jupyter Notebook environment, use the following:
!pip install mostlyai pandas matplotlibSteps
- Import the Python packages needed for this example.
python
from mostlyai.sdk import MostlyAI import pandas as pd import matplotlib.pyplot as plt - Read the original dataset into a Pandas DataFrame object.
python
# fetch original data df_orig = pd.read_csv('https://github.com/mostly-ai/public-demo-data/raw/dev/airbnb/airbnb.csv.gz') df_orig - Pre-process the original data.
MOSTLY AI expect latitude and longitude in a single table column. Because of this, you need to concatenate the latitude and longitude in a single column.
In this example, you do not create artifical seed data. Instead, you use real data: the concatenatedLAT_LONGvariable and theneighbourhoodvariable as a seed dataframe.pythondf = df_orig.copy() # concatenate latitude and longitude to "LAT, LONG" format df['LAT_LONG'] = df['latitude'].astype(str) + ', ' + df['longitude'].astype(str) df = df.drop(columns=['latitude', 'longitude']) # define list of columns, on which we want to condition on seed_cols = ['neighbourhood', 'LAT_LONG'] # create dataframe that will be used as seed df_seed = df[seed_cols] display(df_seed.head()) - Train a generator with the pre-processed AirBnB dataset.
python
# Train a generator on the pre-processed AirBnB data config = { 'name': 'Conditional Generation Tutorial AirBnB', 'tables': [{ 'name': 'AirBnB', 'data': df, 'tabular_model_configuration': {'max_training_time': 2}, 'columns': [ {'name': 'neighbourhood_group', 'included': True, 'model_encoding_type': 'CATEGORICAL'}, {'name': 'neighbourhood', 'included': True, 'model_encoding_type': 'CATEGORICAL'}, {'name': 'room_type', 'included': True, 'model_encoding_type': 'CATEGORICAL'}, {'name': 'price', 'included': True, 'model_encoding_type': 'NUMERIC_AUTO'}, {'name': 'minimum_nights', 'included': True, 'model_encoding_type': 'NUMERIC_AUTO'}, {'name': 'number_of_reviews', 'included': True, 'model_encoding_type': 'NUMERIC_AUTO'}, {'name': 'last_review', 'included': True, 'model_encoding_type': 'DATETIME'}, {'name': 'reviews_per_month', 'included': True, 'model_encoding_type': 'NUMERIC_AUTO'}, {'name': 'availability_365', 'included': True, 'model_encoding_type': 'NUMERIC_AUTO'}, {'name': 'LAT_LONG', 'included': True, 'model_encoding_type': 'LAT_LONG'} ] }] } g_airbnb = mostly.train(config=config) - Generate a partially synthetic dataset with the seed.
python
# generate a synthetic dataset with a seed sd = mostly.generate(generator=g_airbnb, seed=df_seed) # start using it syn_partial = sd.data() print(f"Created synthetic data with {syn_partial.shape[0]:,} records and {syn_partial.shape[1]:,} attributes") - Compare the partial synthetic data to the original data.
python
%%capture --no-display
def plot_manhattan(df, title):
    ax = df_orig.plot.scatter(
        x='longitude',
        y='latitude',
        s=0.1,
        alpha=1,
        color=np.log(df.price.clip(lower=50, upper=2_000)),
        cmap=plt.colormaps['YlOrRd'],
    )
    ax.set_aspect(1.3)
    ax.set_title(title)
    plt.show()

plot_manhattan(df_orig, 'Original Data')
plot_manhattan(syn_partial, 'Partially Synthetic Data')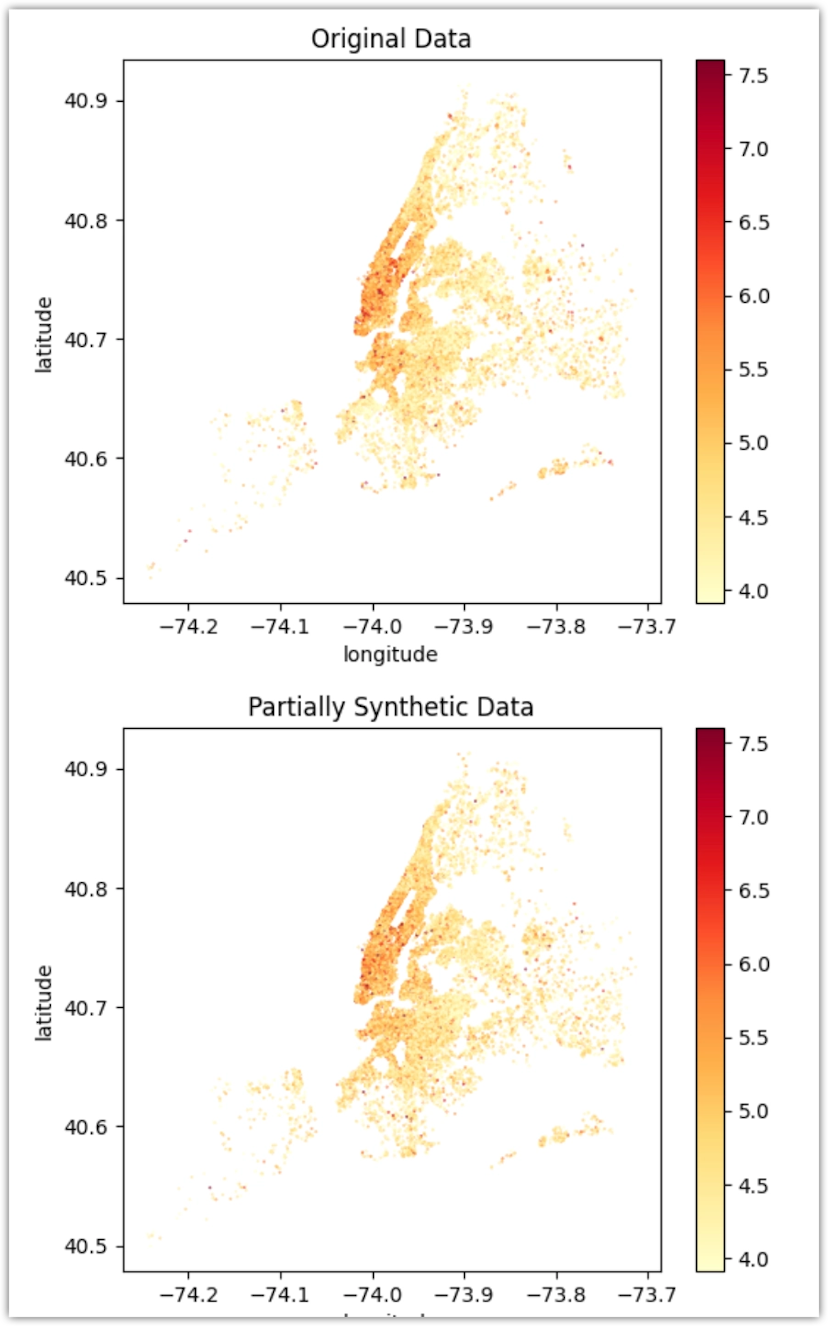
Generate synthetic names
With the Language/Text encoding type, you can train the MOSTLY_AI/LSTMFromScratch model to generate synthetic names. In this example, you will train a generator on the baseball/players table and generate the first names and last names of baseball players by using a seed dataset that contains the country of origin of the players.
Prerequistes
To reproduce this example, you need the following Python packages.
To install in a Jupyter Notebook environment, use the following:
!pip install mostlyai pandasSteps
- Train a generator with a dataset containing names of people. For this example, we will use the baseball dataset.
- Create a new generator and add the
players.csvtable from the baseball dataset. Step result: The
 nameFirstandnameLastcolumns have the Language/Text encoding type auto-detected. - Click Configure models.
- Expand the
languagemodel for the players table. - For Model, make sure the MOSTLY_AI/LSTMFromScratch model is selected.

- Click Start training.
- Create a new generator and add the
- Get the generator ID.
- With the generator open, click its kebab menu and select Copy ID.

- Past the ID in a Jupyter Notebook or another safe location.
- With the generator open, click its kebab menu and select Copy ID.
- In a Jupyter Notebook, live-probe the generator for names from the country Mexico.
💡
The baseball dataset contains players from the countries USA, Canada, Mexico, Cuba, and others. The goal is to demonstrate how the LSTM model is able to learn the names of players from specific countries.
- Get the generator by ID.
python
g = mostly.generators.get("INSERT_GENERATOR_ID") - Create a seed with 3 rows of the country Mexico.
python
seed = pd.DataFrame({ 'country': ['Mexico'] * 5 }) - Live-prove the generator with the seed dataset.
python
sp = mostly.generate(g, seed=seed)
sp[['nameFirst', 'nameLast', 'country']]
- Get the generator by ID.
The generator probe returns the following generator names from country Mexico.
  nameFirst   nameLast country
0     Pedro  Hernandez  Mexico
1   Roberto  Hernandez  Mexico
2     Cesar     Garcia  Mexico
3     Dixie    Ramirez  Mexico
4     Edmon       Pino  Mexico
What’s next
With seeded generation, you can probe generators with a specific context, whether that is hypothetical (example 1) or real (example 2), and gain corresponding insights for specific scenarios. You can also generate synthetic text based on the provided context (example 3).
In addition, you can:
- use a different set of fixed columns for the US Census dataset
- generate a very large number of records for a fixed value set, e.g. create 1 million records of 48 year old female Professors
- generate a fully synthetic dataset of the AirBnB Manhattan dataset
- fine-tune an LLM with a question answering dataset to then generate synthetic answers based on seeded questions