Set sample size and temperature
With MOSTLY AI, you can set the sample size, or that is, the amount of data to generate. You can also set generation temperature and Top P to define how creative or conservative the generated synthetic samples should be.
Set sample size
With the default options, a generator generates each table with the same size (number of rows) as your original tables. You can set a different sample size.
Note: You can apply Sample size only to subject tables. Linked tables are generated based on the sequence length that each subject (row) in a subject table has in the linked table. Bear in mind that synthetic linked tables might have variations due to extreme sequence length protection.
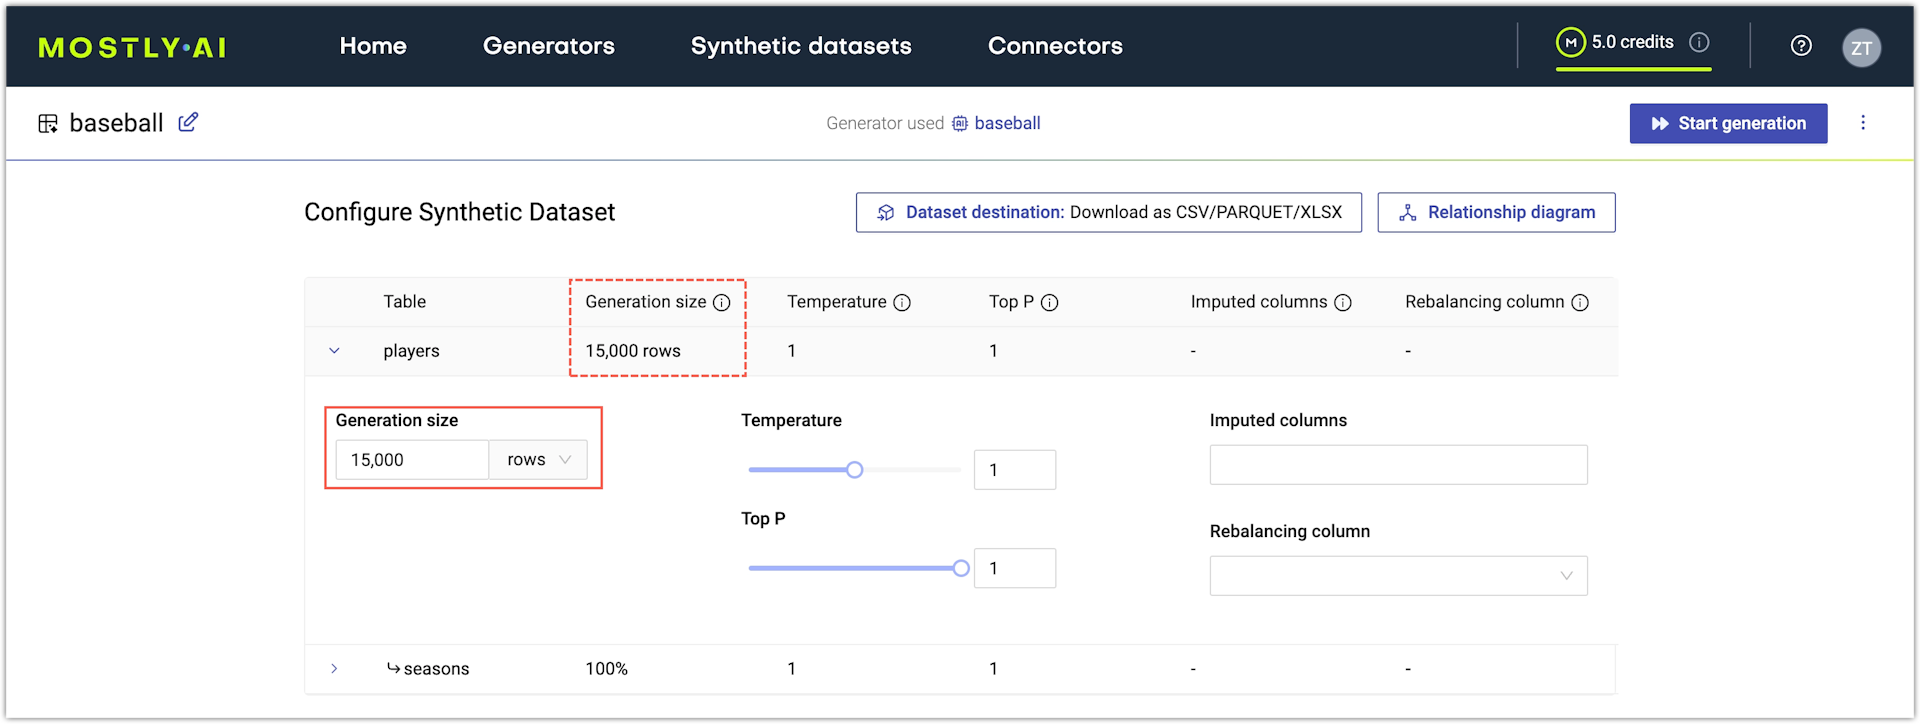
If you use the web application, you can set the Sample size after you expand a table on the Configure synthetic dataset page.
Steps
- From a generator, click Generate data in the upper right.
- Expand the generation settings for a table.
- Set Sample size as the number of rows to generate.
Set temperature and Top P
Use the Temperature and Top P settings to control the level of creativity or conservativeness that the model applies when it generates data.
Temperature
By default, MOSTLY AI applies a Temperature set to 1 to all columns which indicates a temperature representative of the original data distributions. With Temperature set to 1, the generated data samples mimic the distribution of the samples in the original data and they accurately represent the common as well as any of the less common samples from the original dataset.
A conservative temperature (lower than 1) results in the increased generation of samples that are similar or close to the more common ones in the original data. With a conservative temperature, you prioritize improved rule adherence over the accuracy of the generated data.
A creative temperature (higher than 1) boosts the generation of samples that are less common or even uncommon in the original data. In statistical terms, the creative temperature boosts the generation of outliers at the expense of common data samples. You can use a creative temperature to intentionally dilute business-sensitive information that is part of your original data. You can then use the generated synthetic data to stress-test systems with novel, unusual, but at the same time plausible data samples.
Top P
By default, MOSTLY AI applies Top P with a setting of 1 to all columns. When Top P is set to 1, the generated values are considered from the entire range of values observed in the original data. If you reduce Top P to 0.9, the generated values will be sampled from the topmost frequently occurring values in the original data and any less frequently occurring values will be ignored.
For a simplified example, with Top P set to 1, the probability to generate the value France for a column countries is equal to the frequency at which the country appears in the original data. If that frequency is 5% and three other countries appear most frequently with 30% probability for each, then the model will disregard the generation of France if Top P is set to 0.9 and will generate primarily from the top 3 countries.
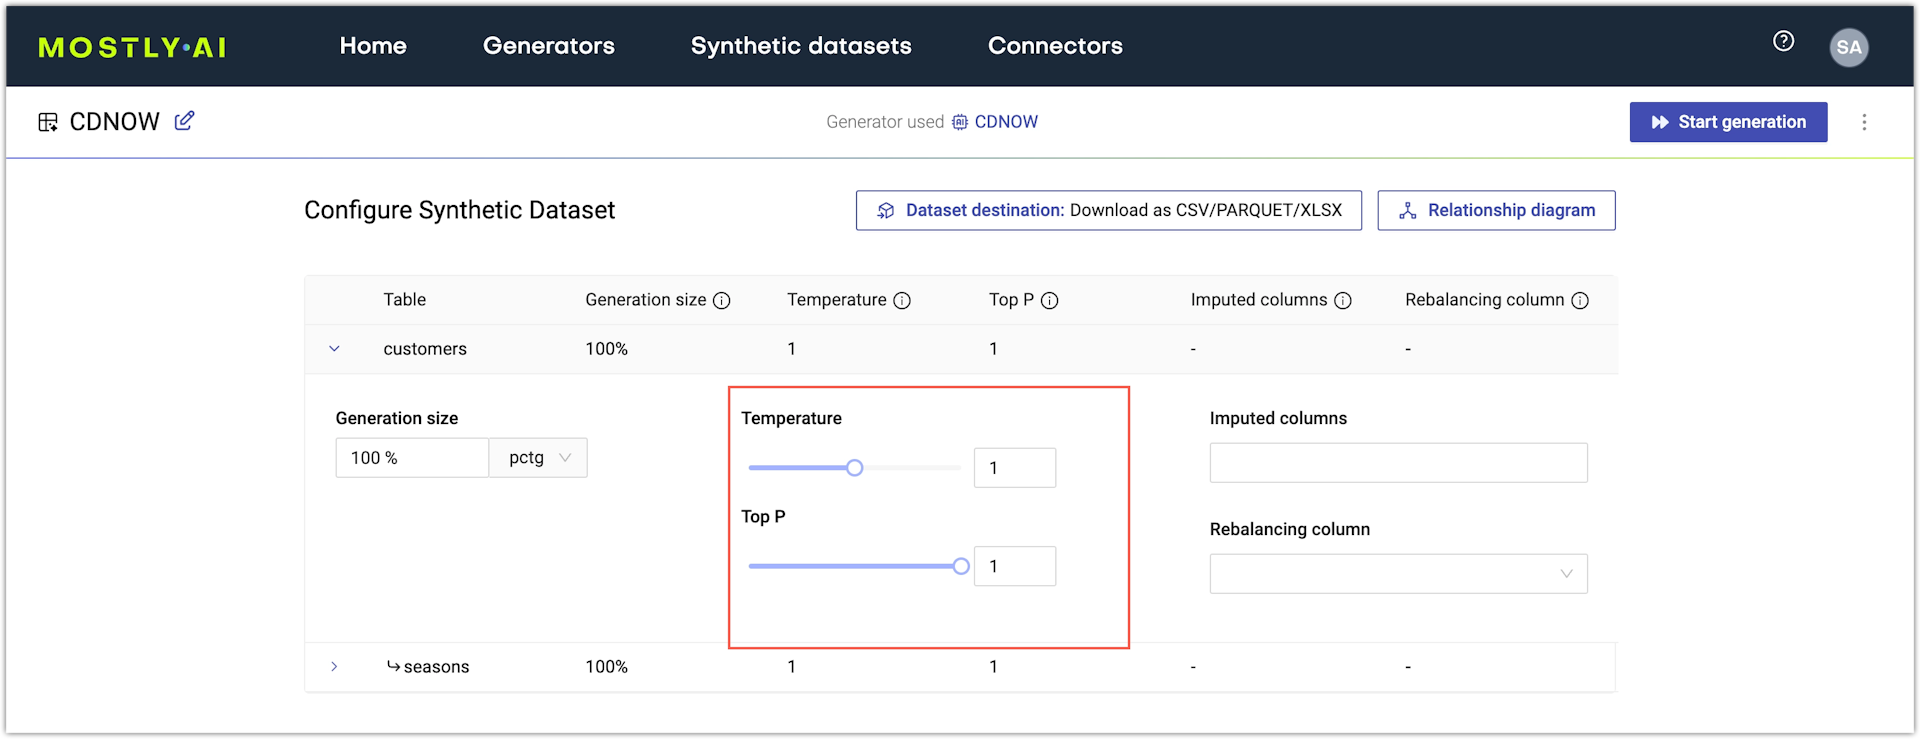
If you use the web application, you can set Temperature and Top P from the respective sliders on the Configure synthetic dataset page.
Steps
- From a generator, click Generate data in the upper right.
- Expand the generation settings for a table.
- Expand Sampling controls.
- For Temperature, use the slider to set a value in the range of
0to2, where0is extremely conservative and2is extremely creative. - For Top P, use the slider to set a value in the range of
0.9to1.00.