Data imputation
You can generate synthetic data that fills in any null values you might have in your original data with statistically reliable values. To do so, use the Imputed columns setting when you configure a new synthetic dataset.
Prerequisites
To use Imputed columns, the model responsible for the table containing missing or null values must have flexible generation enabled.
Add imputed columns to a synthetic dataset
When you configure a new synthetic dataset, you can specify any columns you want to impute.
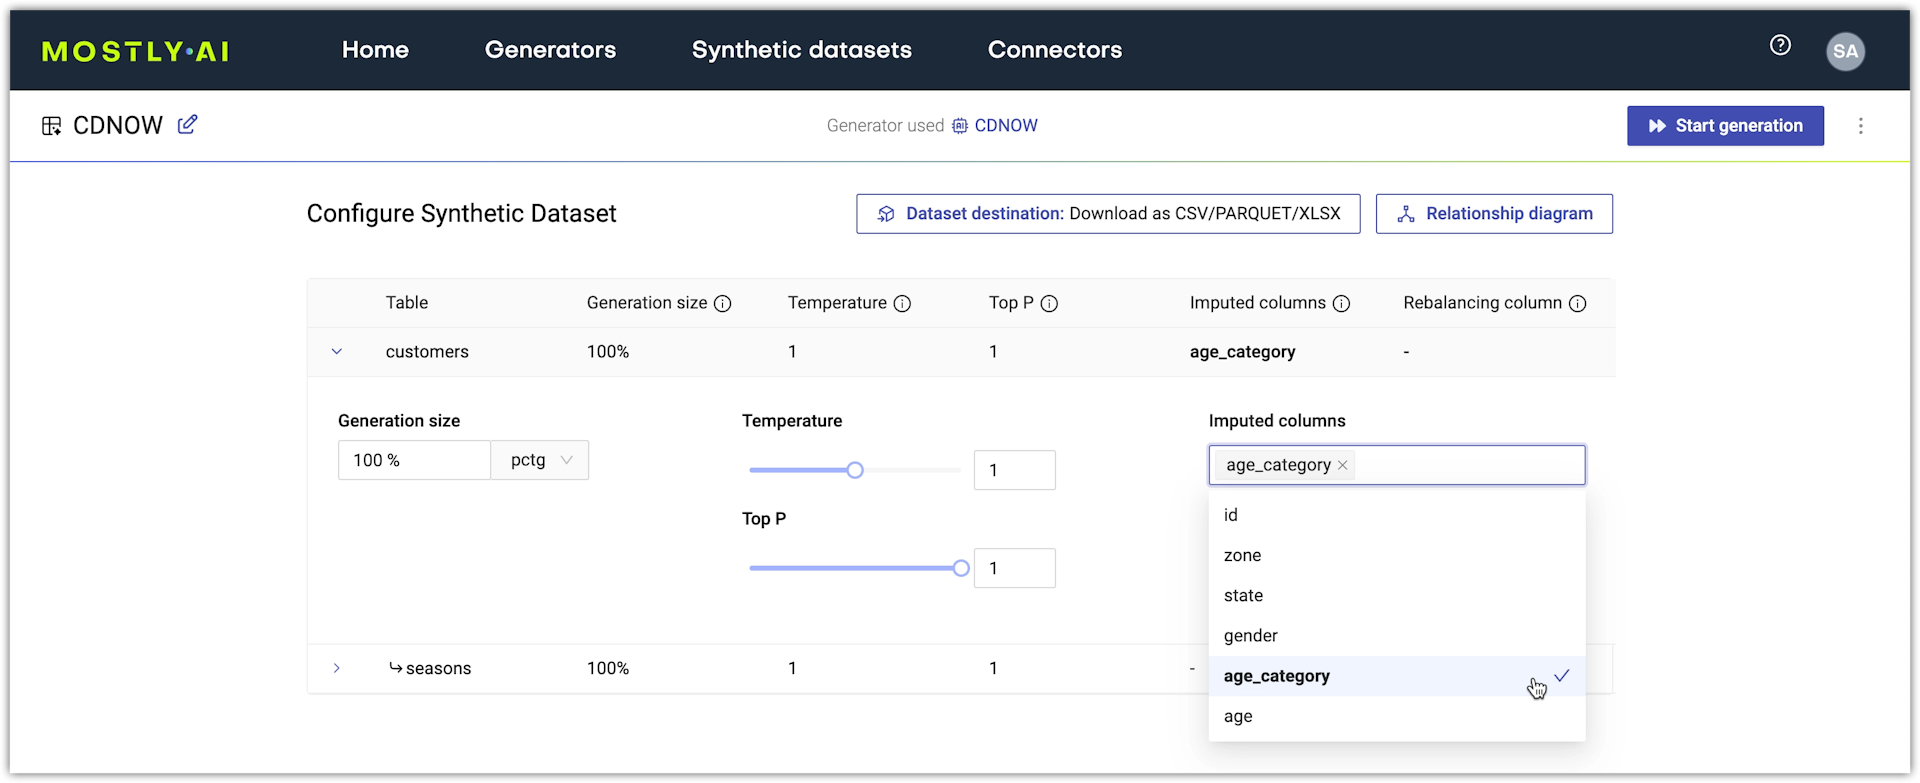
In the web application, you can select which columns to impute from the Imputed columns menu on the Synthetic dataset configuration page.
In this example, you can see a demonstration of a generator trained on the CDNOW dataset that has Flexible generation enabled. The age_category column from the customers table contains 2.5% of null values or 557 null values out of 23,570 rows.
Steps
- Open the generator you want to use.
- Click Generate data in the upper right.
- Expand the generation settings for a table.
- Expand Imputation.
- Click Imputed columns box and select a column to impute.
- (Optional) Add more columns to impute if you want.
- Click Start generation.
Result
When you examine the age_category column in the customers of the generated data, no null values appear.